|
|
|

|
|||||
|
|
|
Conagra Brands, Inc. (CAG) posted first-quarter fiscal 2026 results, wherein both top and bottom lines beat the Zacks Consensus Estimate. However, both metrics declined year over year.
Conagra’s quarterly adjusted earnings per share (EPS) were 39 cents, which beat the Zacks Consensus Estimate of 33 cents. The bottom line declined 26.4% year over year.

Conagra Brands price-consensus-eps-surprise-chart | Conagra Brands Quote
The company generated net sales of $2,632.6 million, which declined 5.8% year over year but surpassed the Zacks Consensus Estimate of $2,609 million. The top-line decline resulted from a 5.1% unfavorable impact of M&A, a 0.6% decrease in organic net sales and 0.1% adverse currency movements.
Organic net sales decreased 0.6%, reflecting a 0.6% positive impact from price/mix, driven by favorable trade expense timing and product mix, offset by a 1.2% decline in volume. During the quarter, the company gained volume share in several categories, including frozen desserts, refrigerated whipped topping, hot dogs, pudding, canned tomatoes, and frozen multi-serve meals.
The adjusted gross profit declined 11.3% to $644 million, as productivity gains were outweighed by lower sales, cost inflation and lost profit from divested businesses. The adjusted gross margin contracted 153 basis points (bps) to 24.4%. We estimated a 25.8% adjusted gross margin.
Adjusted SG&A expenses, excluding advertising and promotional costs, increased 1.5% year over year to $333 million, driven by higher incentive compensation.
Adjusted EBITDA (including equity method investment earnings and pension and post-retirement non-service income) was $441 million, down 16.4% year over year.
Grocery & Snacks: Quarterly net sales in the segment were $1,079.6 million, which was down 8.7% year over year and beat our estimate of $1,052.6 million. The decline was driven by a 7.7% adverse impact from M&A and a 1.0% drop in organic net sales. Within organic results, a 0.6% benefit from price/mix was more than offset by a 1.6% decline in volume.
Refrigerated & Frozen: Net sales decreased 0.9% year over year to $1,076.2 million, beating our estimate of $1,057.1 million. Results reflected a 1.1% headwind from M&A, partially offset by a 0.2% increase in organic net sales. Organic performance included a 0.3% decline from price/mix and a 0.5% increase in volume.
International: Net sales declined 18% year over year to $212.3 million, missing our estimate of $239.4 million. The decrease was attributable to a 13.2% unfavorable impact from M&A, a 3.5% decline in organic net sales, and a 1.3% drag from foreign exchange. Organic results reflected a 1.7% benefit from price/mix, offset by a 5.2% decline in volume.
Foodservice: Reported sales were $264.5 million, down 0.8% year over year but slightly up from our estimate of $264 million. The decline included a 1.0% headwind from M&A, partly offset by a 0.2% increase in organic net sales. Organic results reflected a 3.8% benefit from price/mix, largely offset by a 3.6% decline in volume.
The company exited the quarter with cash and cash equivalents of $698.1 million, senior long-term debt (excluding current installments) of $7,222.6 million and total stockholders’ equity of $8,915.8 million.
For the first quarter of fiscal 2026, Conagra generated $120.6 million in net cash flows from operating activities, with capital expenditures amounting to $146.8 million. The company generated a free cash flow of negative $26.2 million.
Conagra also declared a quarterly dividend of 35 cents per share, payable on Nov. 26, 2025, to its shareholders of record as of Oct. 30.
For fiscal 2026, the company still expects a negative 1% to positive 1% in organic net sales growth. The adjusted operating margin is anticipated between 11% and 11.5%, while adjusted earnings are forecasted between $1.70 and $1.85 per share, down from $2.30 in fiscal 2025.
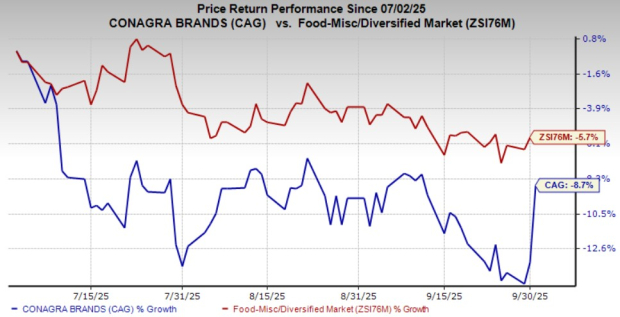
Shares of this Zacks Rank #4 (Sell) company have tumbled 8.7% in the past three months compared with the industry’s decline of 5.7%.
Celsius Holdings, Inc. (CELH) develops, processes, manufactures, markets, sells and distributes functional energy drinks. It sports a Zacks Rank #1 (Strong Buy) at present. You can see the complete list of today’s Zacks #1 Rank stocks here.
The Zacks Consensus Estimate for Celsius Holdings’ current fiscal-year sales and earnings indicates growth of 75.56% and 54.3%, respectively, from the prior-year levels. CELH delivered a trailing four-quarter earnings surprise of 5.4%, on average.
Laird Superfood, Inc. (LSF) manufactures and markets plant-based, natural and functional food in the United States. It has a Zacks Rank #2 (Buy) at present. LSF delivered a trailing four-quarter earnings surprise of 11.3%, on average.
The Zacks Consensus Estimate for Laird Superfood’s current fiscal-year sales and earnings indicates growth of 21% and 23.8%, respectively, from the prior-year levels.
Smithfield Foods, Inc. (SFD) produces packaged meats and fresh pork in the United States and internationally. It holds a Zacks Rank #2 at present. SFD delivered a trailing four-quarter earnings surprise of 6.6%, on average.
The Zacks Consensus Estimate for Smithfield Foods’ current fiscal-year sales and earnings indicates growth of 7.1% and 28.7%, respectively, from the prior-year levels.
Want the latest recommendations from Zacks Investment Research? Today, you can download 7 Best Stocks for the Next 30 Days. Click to get this free report
This article originally published on Zacks Investment Research (zacks.com).
| Jul-17 | |
| Jul-16 | |
| Jul-16 | |
| Jul-15 | |
| Jul-15 | |
| Jul-15 | |
| Jul-15 | |
| Jul-15 | |
| Jul-15 | |
| Jul-15 | |
| Jul-15 | |
| Jul-15 | |
| Jul-15 | |
| Jul-15 | |
| Jul-15 |
Join thousands of traders who make more informed decisions with our premium features. Real-time quotes, advanced visualizations, alerts, and much more.
Learn more about Finviz Elite