|
|
|

|
|||||
|
|
|
Las Vegas Sands (LVS) is looking like an interesting pick from a technical perspective, as the company reached a key level of support. Recently, LVS crossed above the 20-day moving average, suggesting a short-term bullish trend.
The 20-day simple moving average is a popular investing tool. Traders like this SMA because it offers a look back at a stock's price over a shorter period and helps smooth out price fluctuations. The 20-day can also show more trend reversal signals than longer-term moving averages.
Similar to other SMAs, if a stock's price moves above the 20-day, the trend is considered positive, while price falling below the moving average can signal a downward trend.
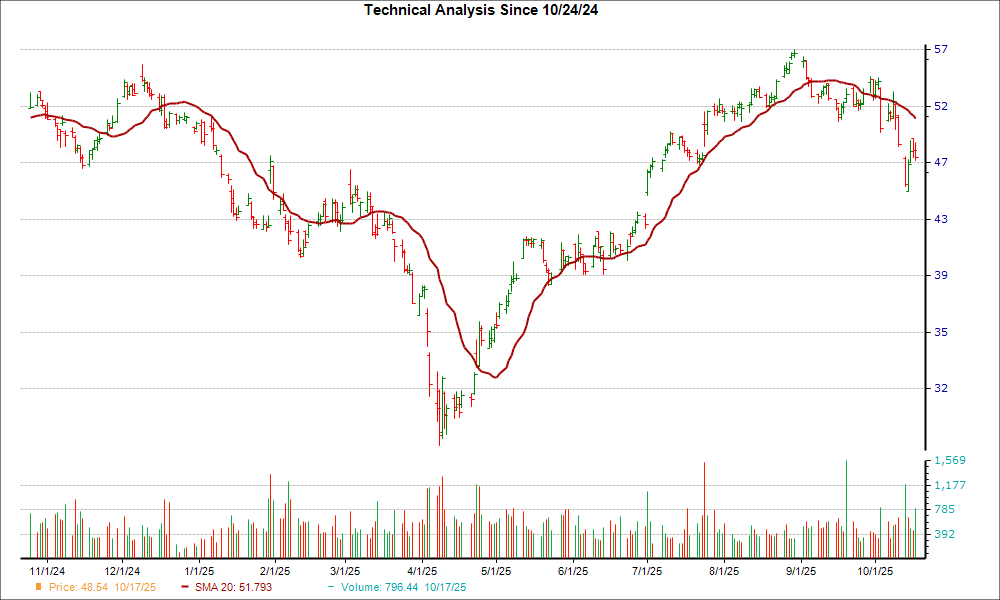
LVS could be on the verge of another rally after moving 7.2% higher over the last four weeks. Plus, the company is currently a Zacks Rank #1 (Strong Buy) stock.
Looking at LVS's earnings estimate revisions, investors will be even more convinced of the bullish uptrend. There have been 4 revisions higher for the current fiscal year compared to none lower, and the consensus estimate has moved up as well.
Investors may want to watch LVS for more gains in the near future given the company's key technical level and positive earnings estimate revisions.
Want the latest recommendations from Zacks Investment Research? Today, you can download 7 Best Stocks for the Next 30 Days. Click to get this free report
This article originally published on Zacks Investment Research (zacks.com).
| 3 hours | |
| Mar-11 | |
| Mar-06 | |
| Feb-27 | |
| Feb-27 | |
| Feb-24 | |
| Feb-23 | |
| Feb-19 | |
| Feb-18 | |
| Feb-18 | |
| Feb-17 | |
| Feb-16 | |
| Feb-13 | |
| Feb-13 | |
| Feb-12 |
Join thousands of traders who make more informed decisions with our premium features. Real-time quotes, advanced visualizations, backtesting, and much more.
Learn more about Finviz Elite