|
|
|

|
|||||
|
|
|

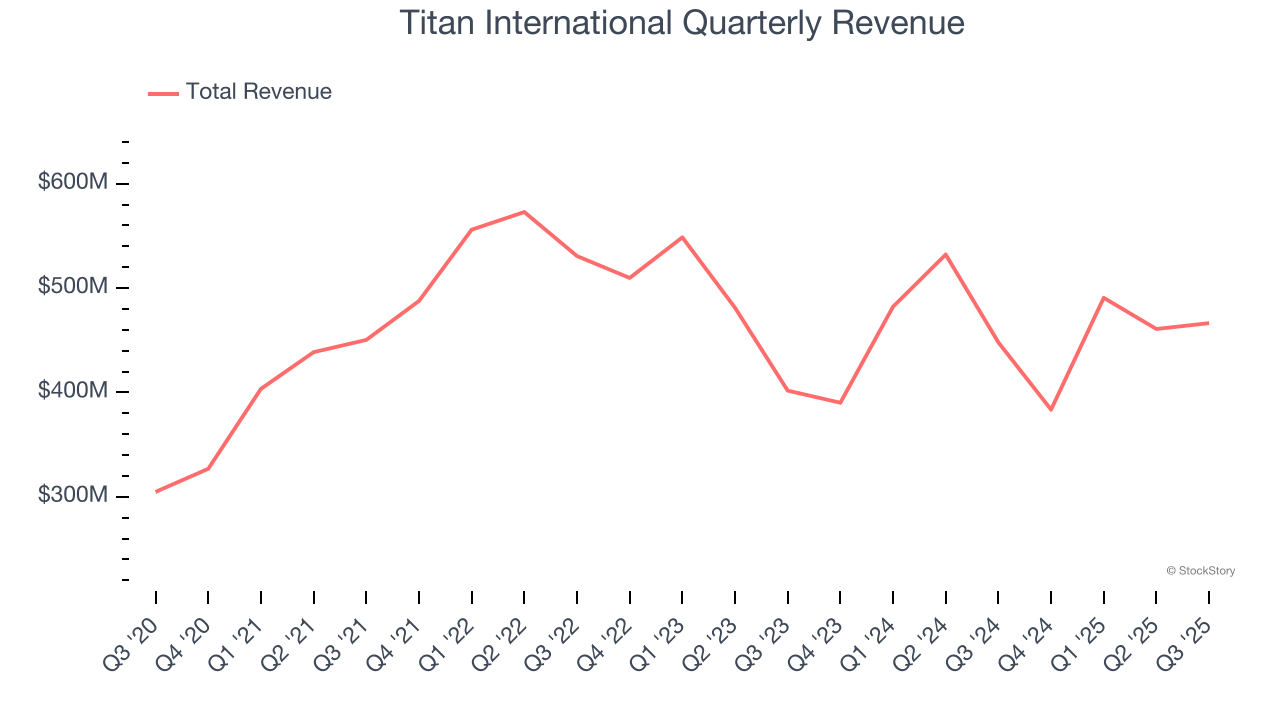
Agricultural and farm machinery company Titan (NSYE:TWI) reported revenue ahead of Wall Streets expectations in Q3 CY2025, with sales up 4.1% year on year to $466.5 million. On the other hand, next quarter’s revenue guidance of $397.5 million was less impressive, coming in 5.5% below analysts’ estimates. Its GAAP loss of $0.04 per share was $0.01 below analysts’ consensus estimates.
Is now the time to buy Titan International? Find out by accessing our full research report, it’s free for active Edge members.
Acquiring Goodyear’s farm tire business in 2005, Titan (NSYE:TWI) is a manufacturer and supplier of wheels, tires, and undercarriages used in off-highway vehicles such as construction vehicles.
Examining a company’s long-term performance can provide clues about its quality. Any business can put up a good quarter or two, but many enduring ones grow for years. Over the last five years, Titan International grew its sales at a decent 7.9% compounded annual growth rate. Its growth was slightly above the average industrials company and shows its offerings resonate with customers.
Long-term growth is the most important, but within industrials, a half-decade historical view may miss new industry trends or demand cycles. Titan International’s recent performance marks a sharp pivot from its five-year trend as its revenue has shown annualized declines of 3.7% over the last two years. Titan International isn’t alone in its struggles as the Agricultural Machinery industry experienced a cyclical downturn, with many similar businesses observing lower sales at this time.
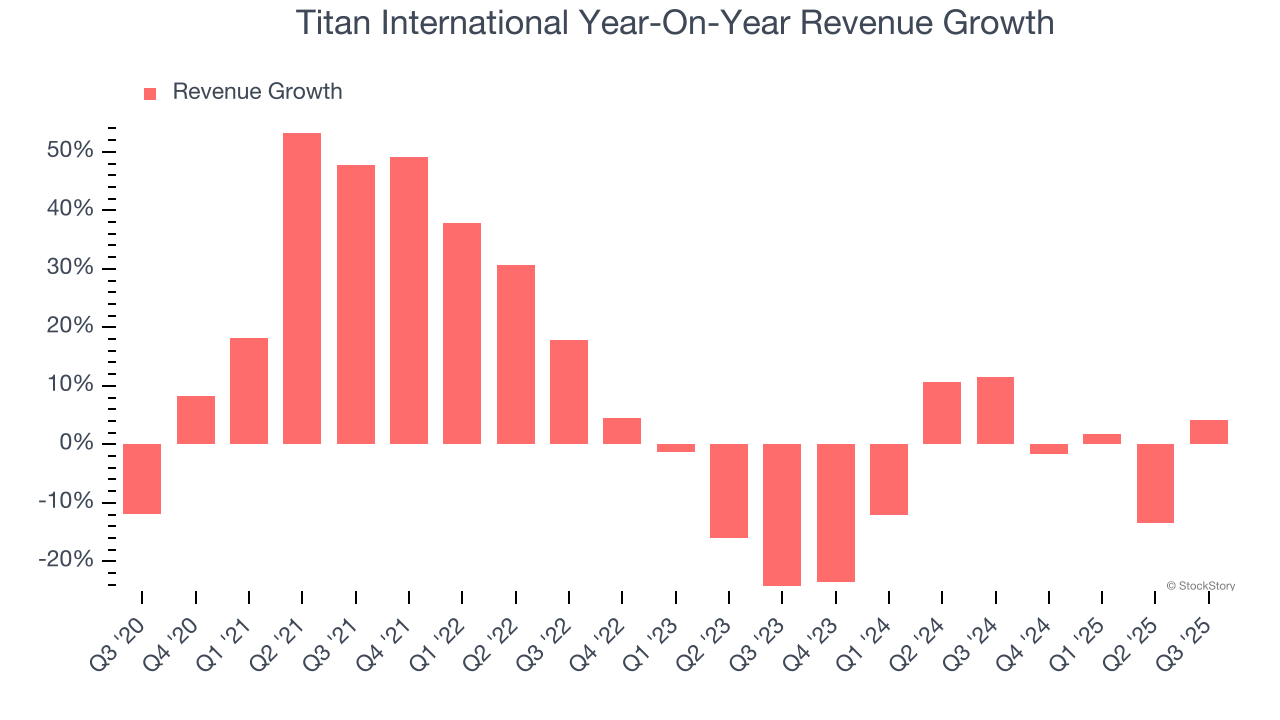
This quarter, Titan International reported modest year-on-year revenue growth of 4.1% but beat Wall Street’s estimates by 1.7%. Company management is currently guiding for a 3.6% year-on-year increase in sales next quarter.
Looking further ahead, sell-side analysts expect revenue to grow 5.9% over the next 12 months. Although this projection implies its newer products and services will spur better top-line performance, it is still below average for the sector.
Software is eating the world and there is virtually no industry left that has been untouched by it. That drives increasing demand for tools helping software developers do their jobs, whether it be monitoring critical cloud infrastructure, integrating audio and video functionality, or ensuring smooth content streaming. Click here to access a free report on our 3 favorite stocks to play this generational megatrend.
Titan International was profitable over the last five years but held back by its large cost base. Its average operating margin of 5.4% was weak for an industrials business. This result isn’t too surprising given its low gross margin as a starting point.
Analyzing the trend in its profitability, Titan International’s operating margin decreased by 3.9 percentage points over the last five years. This raises questions about the company’s expense base because its revenue growth should have given it leverage on its fixed costs, resulting in better economies of scale and profitability. Titan International’s performance was poor no matter how you look at it - it shows that costs were rising and it couldn’t pass them onto its customers.
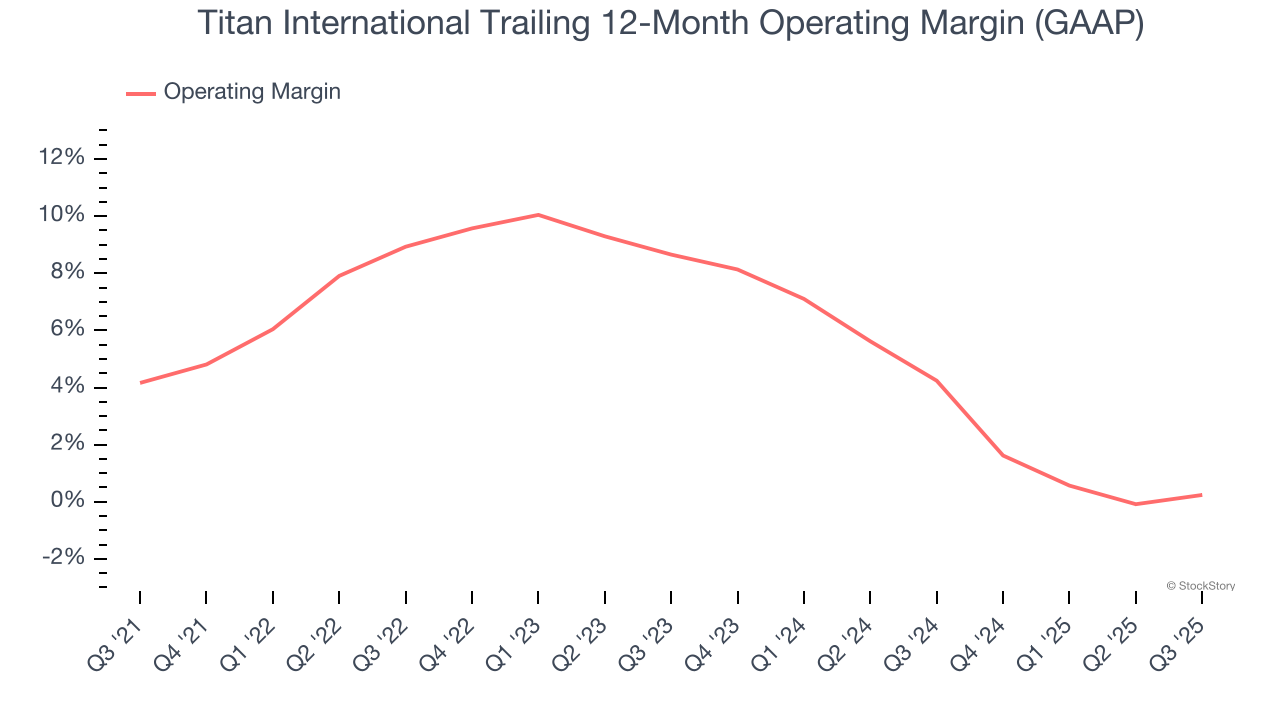
In Q3, Titan International generated an operating margin profit margin of 2.1%, up 1.2 percentage points year on year. Since its gross margin expanded more than its operating margin, we can infer that leverage on its cost of sales was the primary driver behind the recently higher efficiency.
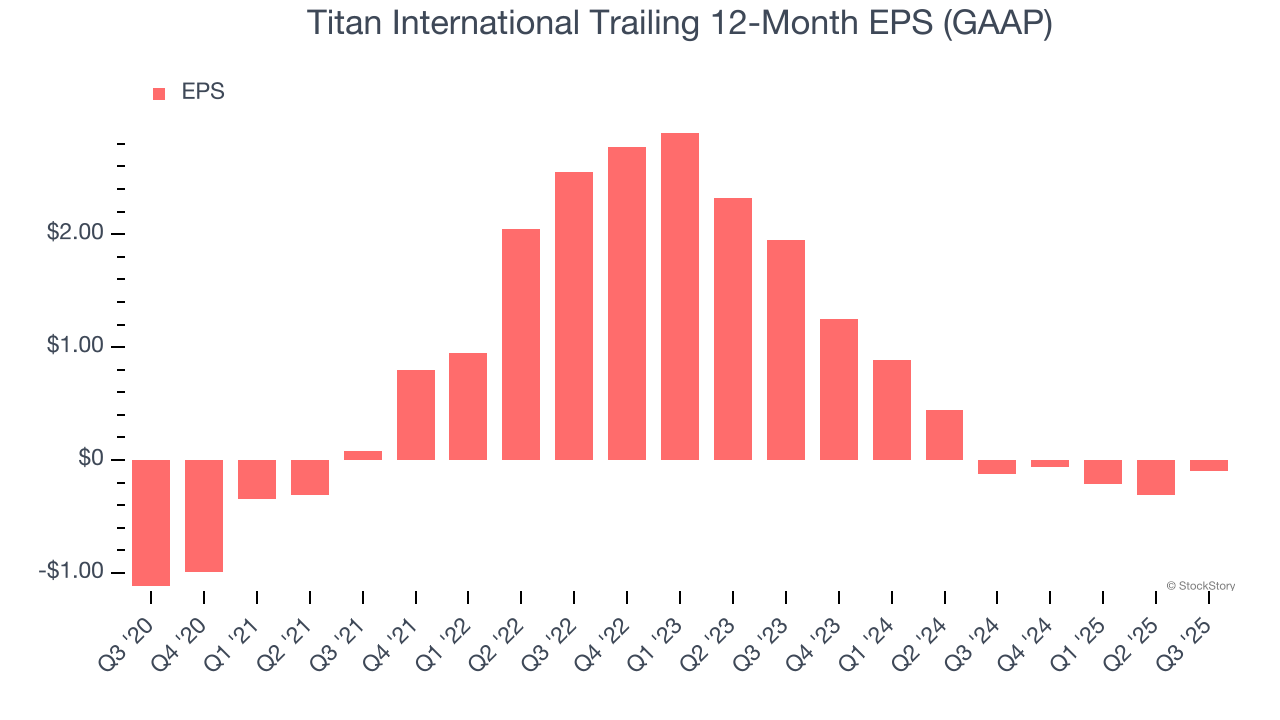
We track the long-term change in earnings per share (EPS) for the same reason as long-term revenue growth. Compared to revenue, however, EPS highlights whether a company’s growth is profitable.
Although Titan International’s full-year earnings are still negative, it reduced its losses and improved its EPS by 38.3% annually over the last five years. The next few quarters will be critical for assessing its long-term profitability.
Like with revenue, we analyze EPS over a more recent period because it can provide insight into an emerging theme or development for the business.
Sadly for Titan International, its EPS declined by more than its revenue over the last two years, dropping 43.2%. This tells us the company struggled to adjust to shrinking demand.
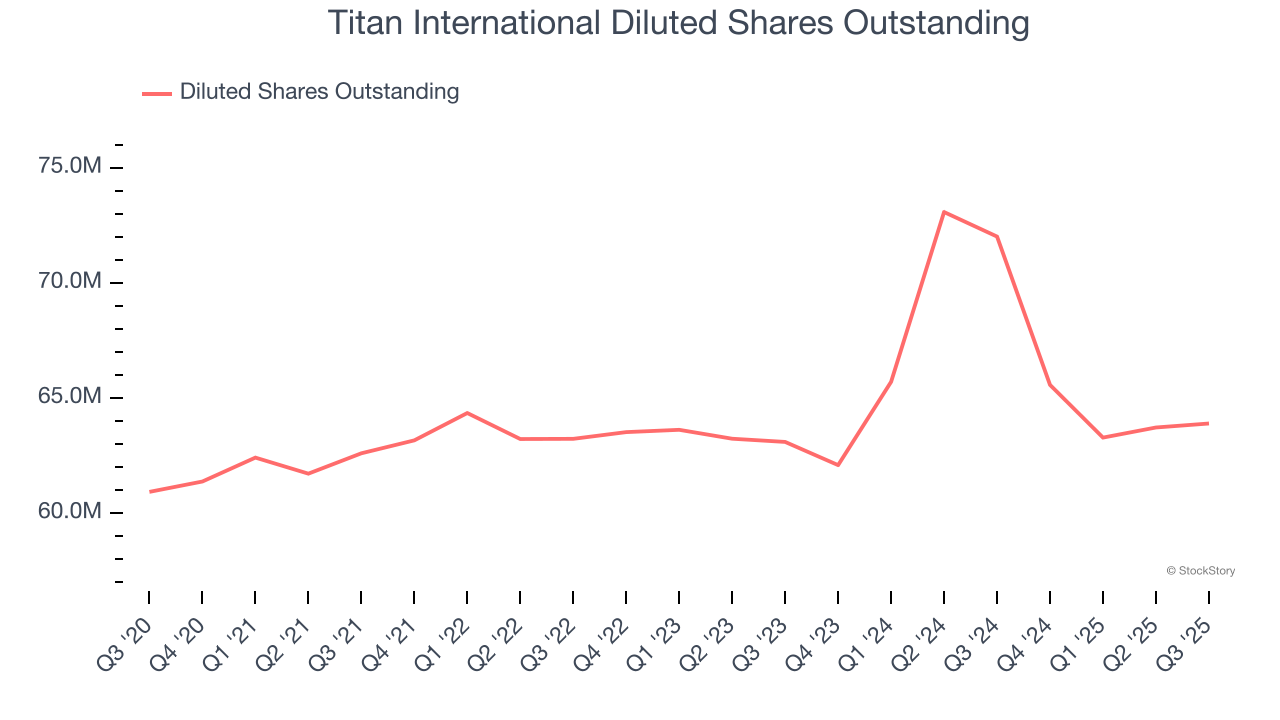
Diving into the nuances of Titan International’s earnings can give us a better understanding of its performance. We mentioned earlier that Titan International’s operating margin expanded this quarter, but a two-year view shows its margin has declinedwhile its share count has grown 1.3%. This means the company not only became less efficient with its operating expenses but also diluted its shareholders.
In Q3, Titan International reported EPS of negative $0.04, up from negative $0.25 in the same quarter last year. Despite growing year on year, this print missed analysts’ estimates. Over the next 12 months, Wall Street is optimistic. Analysts forecast Titan International’s full-year EPS of negative $0.10 will flip to positive $0.22.
We were impressed by how significantly Titan International blew past analysts’ EBITDA expectations this quarter. We were also happy its revenue outperformed Wall Street’s estimates. On the other hand, its revenue and EBITDA guidance for next quarter missed. Overall, this was a mixed quarter. The stock traded up 2.8% to $8.17 immediately following the results.
So should you invest in Titan International right now? What happened in the latest quarter matters, but not as much as longer-term business quality and valuation, when deciding whether to invest in this stock. We cover that in our actionable full research report which you can read here, it’s free for active Edge members.
| 9 hours | |
| 10 hours | |
| Jul-14 | |
| May-01 | |
| May-01 | |
| Apr-30 | |
| Apr-30 | |
| Apr-30 | |
| Apr-08 | |
| Mar-30 | |
| Mar-18 | |
| Mar-09 | |
| Mar-05 | |
| Feb-28 | |
| Feb-26 |
Join thousands of traders who make more informed decisions with our premium features. Real-time quotes, advanced visualizations, alerts, and much more.
Learn more about Finviz Elite