|
|
|

|
|||||
|
|
|
Macy’s, Inc. M has reported third-quarter fiscal 2025 results, wherein the top and bottom lines surpassed the Zacks Consensus Estimate. However, net sales decreased and earnings increased from the year-ago quarter. Comparable sales (comps) increased on an owned and owned-plus-licensed-plus-marketplace basis. As a result, the company has raised its fiscal 2025 outlook.
M remains confident that its strong balance sheet, diversified brands and categories, and its range from off-price to luxury provide the ability to navigate a changing retail environment. The company also reaffirmed its commitment to the Bold New Chapter strategy and intends to reinvest the majority of related savings to support long-term revenue growth.

Macy's, Inc. price-consensus-eps-surprise-chart | Macy's, Inc. Quote
The company has reported adjusted earnings of 9 cents per share, surpassing the Zacks Consensus Estimate of an adjusted loss of 13 cents. Also, the bottom line increased from adjusted earnings of 4 cents in the year-ago period.
Net sales of $4,713 million beat the consensus estimate of $4,595 million. However, the top line dipped 0.6% from the year-ago quarter. On an owned basis, comparable sales rose 2.5%, and on an owned-plus-licensed-plus-marketplace basis, they increased 3.2%. Each of the company’s nameplates contributed to the positive comparable sales growth.
M’s go-forward business comps, including both go-forward locations and digital platforms across all nameplates, increased 2.7% on an owned basis and 3.4% on an owned-plus-licensed-plus-marketplace basis.
Net credit card revenues were $158 million, up 31.7% from the year-ago period. The metric represented 3.4% of sales, up 90 basis points from the year-ago quarter.
Macy’s Media Network revenues were $42 million, flat year over year. The metric represented 0.9% of sales, unchanged from the year-ago quarter.
Comps across the Macy’s brand increased 1.4% year over year on an owned basis and 2% on an owned-plus-licensed-plus-marketplace basis.
At the Bloomingdale’s brand, comps increased 8.8% on an owned basis and 9% on an owned-plus-licensed-plus-marketplace basis, marking its fifth consecutive quarter of growth.
Comps at the Bluemercury brand rose 1.1% on an owned basis, marking its 19th consecutive quarter of growth.
The gross margin in the fiscal third quarter was 39.4%, which beat our estimate of 39%. This represented a decline of 20 basis points from last year, driven by a 50-basis-point impact of tariffs, which was better than expected due to successful mitigation efforts.
The Zacks Rank #2 (Buy) company reported selling, general and administrative (SG&A) expenses of $2.02 billion, down 1.9% year over year. This reduction reflects savings from closed Macy’s stores and ongoing cost discipline, partially offset by continued investments in key growth initiatives, including Reimagine 125 locations, Bloomingdale’s and digital capabilities across all nameplates. As a percentage of total revenues, SG&A expenses declined 90 basis points to 41.2%. We estimated SG&A expenses to decrease 2% year over year in the fiscal third quarter.
Macy’s reported an adjusted EBITDA of $285 million, down 4.4% from $273 million in the year-ago quarter. The adjusted EBITDA margin was 5.8%, up 20 basis points year over year.
The company ended the fiscal third quarter with cash and cash equivalents of $447 million, long-term debt of $2.43 billion, and shareholders' equity of $4.33 billion. The company does not face any significant long-term debt maturities until 2030. Merchandise inventories increased 0.7% on a year-over-year basis. In the first nine months of fiscal 2025, net cash provided by operating activities was $247 million.
Asset sale gains were $12 million compared with $66 million in the prior period. The company continues to focus on closing underperforming stores. With a strong balance sheet, it is positioned to pursue transactions strategically to maximize monetization value.
In the third quarter of fiscal 2025, the company repurchased 2.8 million shares for $50 million. As of the end of the quarter, $1.2 billion was available under its $2-billion share repurchase authorization.
The company has updated its annual outlook, raising net sales and adjusted earnings per share expectations. The guidance continues to reflect an assumption that consumers will remain more selective in the fourth quarter of fiscal 2025. It also expects current tariffs to be unchanged and includes the flexibility to adjust to shifts in consumer behavior and competitive dynamics.
Macy’s expects net sales of $21.48-$21.63 billion compared with the earlier stated $21.15-$21.45 billion. Comparable owned-plus-licensed-plus-marketplace sales are expected to be flat to up 0.5% from that reported in 2024, an improvement from the prior expectation of a decline of 1.5-0.5%.
For the company’s go-forward business, comparable owned-plus-licensed-plus-marketplace sales are expected to be flat to up 1% year over year, as compared with the earlier view of a decline of 1.5% to flat.
Adjusted EBITDA as a percentage of total revenues is anticipated to be 7.8-8% compared with the previously stated 7.4-7.9%. Core adjusted EBITDA as a percentage of total revenues is forecast at 7.5-7.8%, compared with the earlier mentioned 7-7.5%. Adjusted earnings per share are expected between $2.00 and $2.20, up from the prior stated $1.70-$2.05.
The guidance includes the expected impacts of fiscal 2024 store closures, primarily within the Macy’s nameplate, which reduced annual net sales by $700 million. Expected fiscal-year asset sale gains of $60-$65 million are lower than the prior stated $90 million and are anticipated to reduce adjusted earnings per share by 7-8 cents from the previous guidance. The outlook does not reflect the impacts of any future share repurchases under the company’s existing authorization.
M Stock Past 3-Month Performance
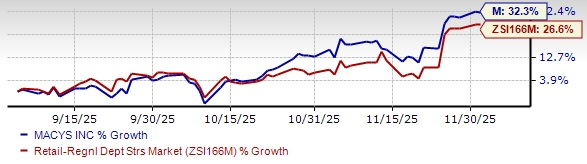
M shares have gained 32.3% in the past three months compared with the industry’s 26.6% growth.
We have highlighted three other top-ranked stocks, namely, FIGS Inc. FIGS, Boot Barn Holdings, Inc. BOOT and Allbirds Inc. BIRD.
FIGS is a direct-to-consumer healthcare apparel and lifestyle brand. It sports a Zacks Rank #1 (Strong Buy) at present. You can see the complete list of today’s Zacks #1 Rank stocks here.
The Zacks Consensus Estimate for FIGS’ current financial-year earnings and sales indicates growth of 400% and 7%, respectively, from the year-ago actuals. FIGS delivered a trailing four-quarter average earnings surprise of 87.5%.
Boot Barn operates as a lifestyle retail chain devoted to western and work-related footwear, apparel and accessories. It currently carries a Zacks Rank of 2.
The Zacks Consensus Estimate for Boot Barn’s fiscal 2026 earnings and sales implies growth of 20.5% and 16.2%, respectively, from the year-ago actuals. Boot Barn delivered a trailing four-quarter average earnings surprise of 5.4%.
Allbirds is a lifestyle brand with naturally derived materials to make footwear and apparel products. It carries a Zacks Rank of 2 at present.
The Zacks Consensus Estimate for Allbirds’ current financial-year sales and earnings indicates a decline of 15.1% and growth of 19.9%, respectively, from the year-ago actuals. BIRD delivered a trailing four-quarter average earnings surprise of 18.5%.
Want the latest recommendations from Zacks Investment Research? Today, you can download 7 Best Stocks for the Next 30 Days. Click to get this free report
This article originally published on Zacks Investment Research (zacks.com).
| Jul-06 | |
| Jul-06 | |
| Jul-02 | |
| Jul-01 | |
| Jun-25 | |
| Jun-25 | |
| Jun-24 | |
| Jun-23 | |
| Jun-22 | |
| Jun-22 | |
| Jun-19 | |
| Jun-19 | |
| Jun-19 | |
| Jun-18 | |
| Jun-18 |
Join thousands of traders who make more informed decisions with our premium features. Real-time quotes, advanced visualizations, alerts, and much more.
Learn more about Finviz Elite