|
|
|

|
|||||
|
|
|

Manufacturing company Nordson (NASDAQ:NDSN) fell short of the markets revenue expectations in Q3 CY2025, with sales flat year on year at $751.8 million. Next quarter’s revenue guidance of $650 million underwhelmed, coming in 0.9% below analysts’ estimates. Its non-GAAP profit of $3.03 per share was 3.4% above analysts’ consensus estimates.
Is now the time to buy Nordson? Find out by accessing our full research report, it’s free for active Edge members.
Founded in 1954, Nordson Corporation (NASDAQ:NDSN) manufactures dispensing equipment and industrial adhesives, sealants and coatings.
A company’s long-term performance is an indicator of its overall quality. Any business can have short-term success, but a top-tier one grows for years. Regrettably, Nordson’s sales grew at a tepid 5.6% compounded annual growth rate over the last five years. This fell short of our benchmark for the industrials sector and is a rough starting point for our analysis.
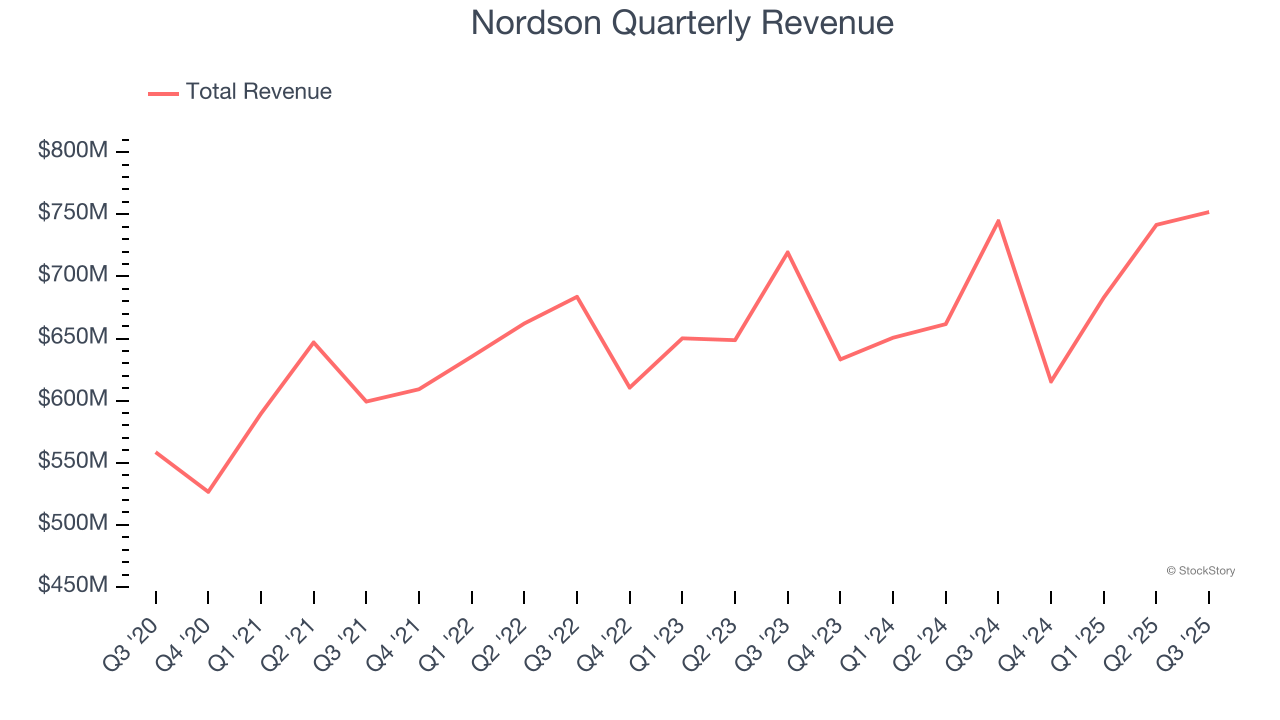
We at StockStory place the most emphasis on long-term growth, but within industrials, a half-decade historical view may miss cycles, industry trends, or a company capitalizing on catalysts such as a new contract win or a successful product line. Nordson’s recent performance shows its demand has slowed as its annualized revenue growth of 3.1% over the last two years was below its five-year trend.
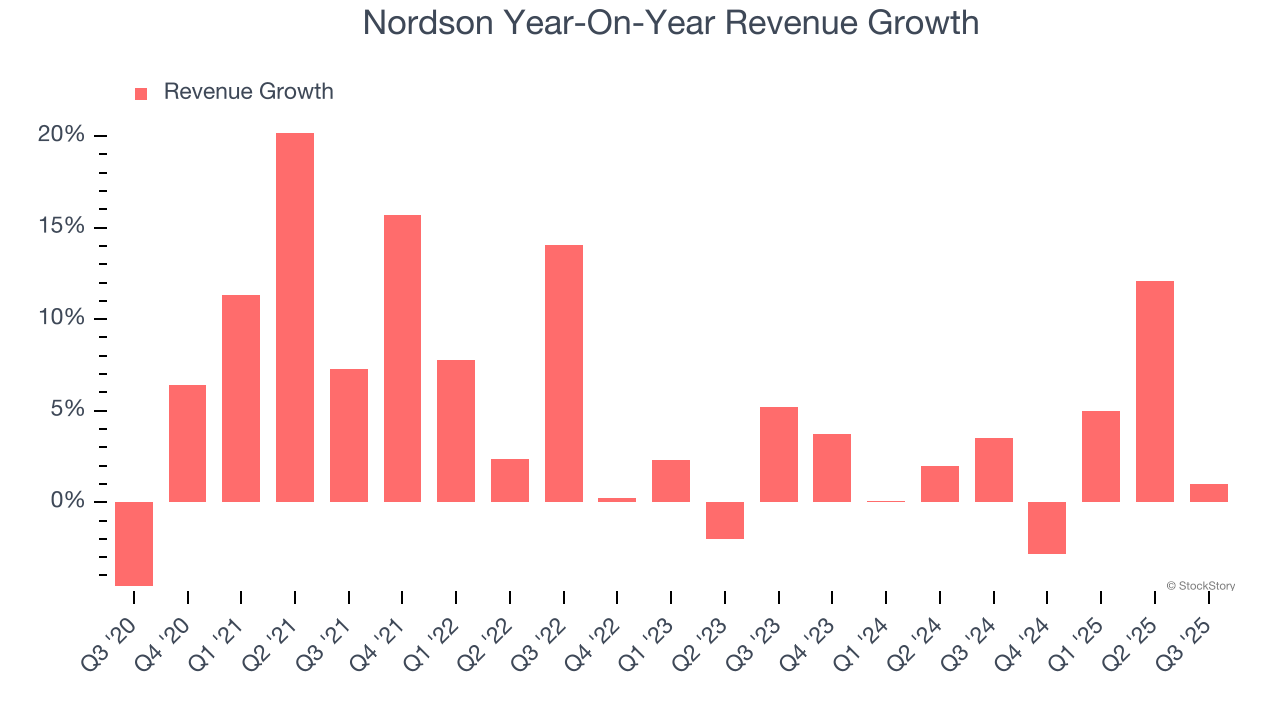
We can dig further into the company’s sales dynamics by analyzing its organic revenue, which strips out one-time events like acquisitions and currency fluctuations that don’t accurately reflect its fundamentals. Over the last two years, Nordson’s organic revenue averaged 2.6% year-on-year declines. Because this number is lower than its two-year revenue growth, we can see that some mixture of acquisitions and foreign exchange rates boosted its headline results.

This quarter, Nordson’s $751.8 million of revenue was flat year on year, falling short of Wall Street’s estimates. Company management is currently guiding for a 5.6% year-on-year increase in sales next quarter.
Looking further ahead, sell-side analysts expect revenue to grow 4.6% over the next 12 months. While this projection implies its newer products and services will catalyze better top-line performance, it is still below average for the sector.
The 1999 book Gorilla Game predicted Microsoft and Apple would dominate tech before it happened. Its thesis? Identify the platform winners early. Today, enterprise software companies embedding generative AI are becoming the new gorillas. a profitable, fast-growing enterprise software stock that is already riding the automation wave and looking to catch the generative AI next.
Operating margin is a key measure of profitability. Think of it as net income - the bottom line - excluding the impact of taxes and interest on debt, which are less connected to business fundamentals.
Nordson’s operating margin might fluctuated slightly over the last 12 months but has generally stayed the same, averaging 25.8% over the last five years. This profitability was elite for an industrials business thanks to its efficient cost structure and economies of scale. This result isn’t surprising as its high gross margin gives it a favorable starting point.
Analyzing the trend in its profitability, Nordson’s operating margin might fluctuated slightly but has generally stayed the same over the last five years. This raises questions about the company’s expense base because its revenue growth should have given it leverage on its fixed costs, resulting in better economies of scale and profitability.
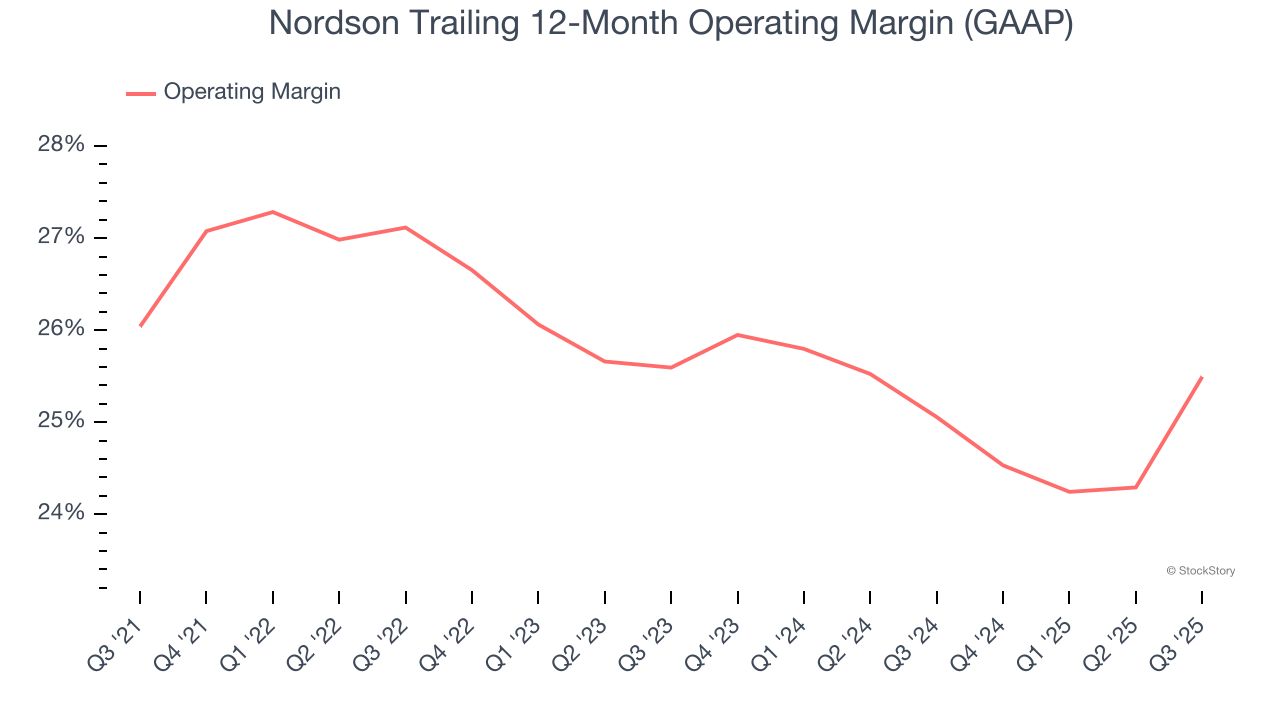
This quarter, Nordson generated an operating margin profit margin of 28.5%, up 4.5 percentage points year on year. The increase was encouraging, and because its operating margin rose more than its gross margin, we can infer it was more efficient with expenses such as marketing, R&D, and administrative overhead.
Revenue trends explain a company’s historical growth, but the long-term change in earnings per share (EPS) points to the profitability of that growth – for example, a company could inflate its sales through excessive spending on advertising and promotions.
Nordson’s EPS grew at a solid 11.8% compounded annual growth rate over the last five years, higher than its 5.6% annualized revenue growth. This tells us the company became more profitable on a per-share basis as it expanded.
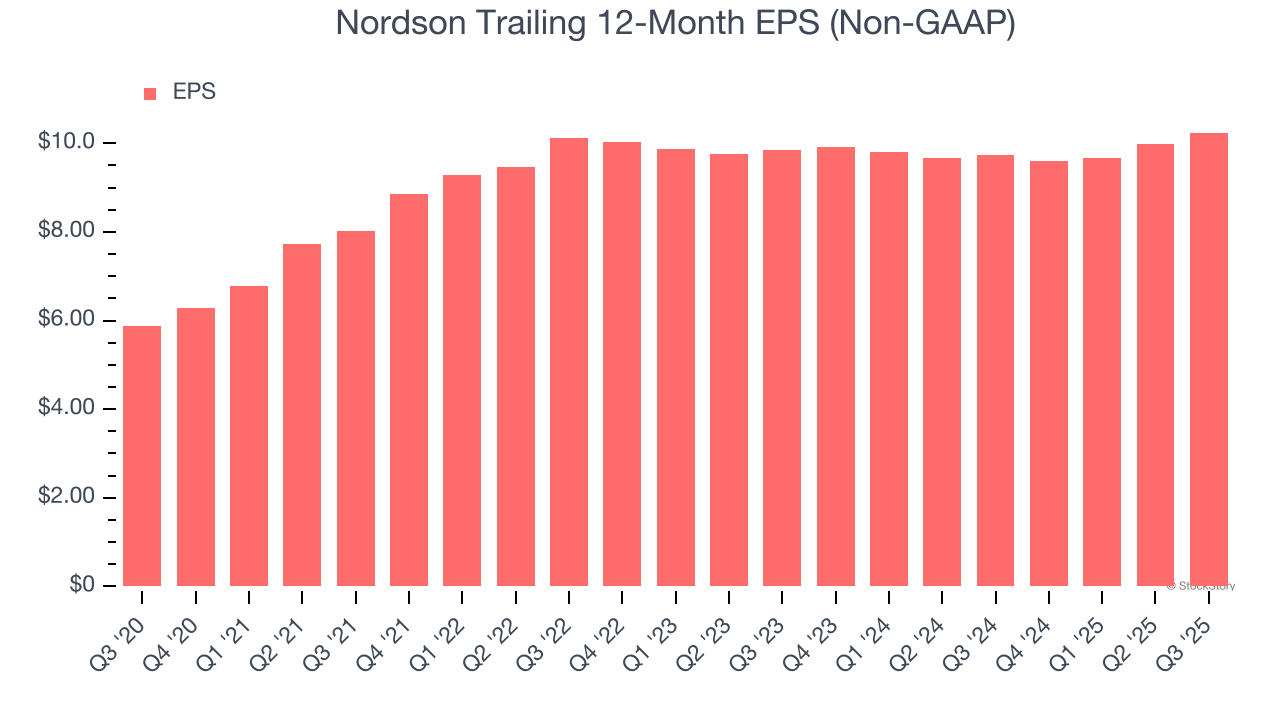
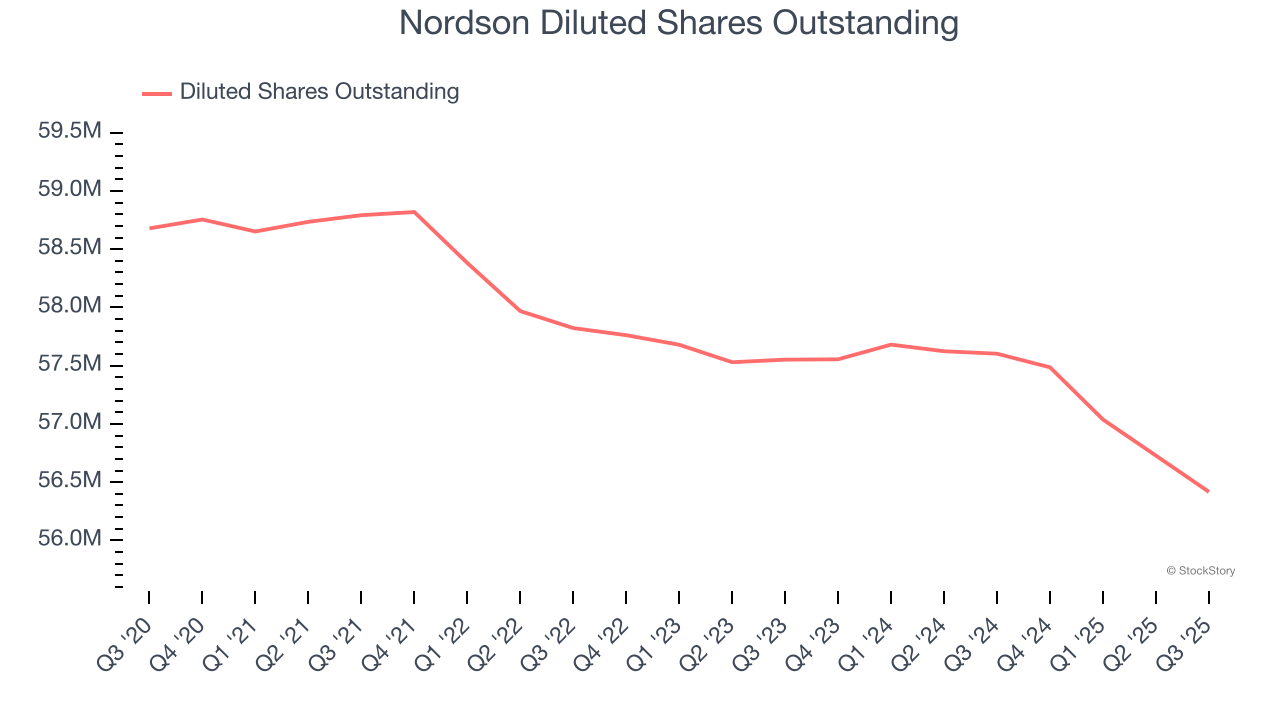
We can take a deeper look into Nordson’s earnings quality to better understand the drivers of its performance. A five-year view shows that Nordson has repurchased its stock, shrinking its share count by 3.9%. This tells us its EPS outperformed its revenue not because of increased operational efficiency but financial engineering, as buybacks boost per share earnings.
Like with revenue, we analyze EPS over a shorter period to see if we are missing a change in the business.
For Nordson, its two-year annual EPS growth of 2% was lower than its five-year trend. We hope its growth can accelerate in the future.
In Q3, Nordson reported adjusted EPS of $3.03, up from $2.78 in the same quarter last year. This print beat analysts’ estimates by 3.4%. Over the next 12 months, Wall Street expects Nordson’s full-year EPS of $10.24 to grow 8.9%.
It was encouraging to see Nordson beat analysts’ EBITDA expectations this quarter. We were also glad its full-year EPS guidance slightly exceeded Wall Street’s estimates. On the other hand, its revenue slightly missed and its full-year revenue guidance fell slightly short of Wall Street’s estimates. Overall, this quarter was mixed. The stock traded up 1.4% to $239.33 immediately following the results.
So do we think Nordson is an attractive buy at the current price? If you’re making that decision, you should consider the bigger picture of valuation, business qualities, as well as the latest earnings. We cover that in our actionable full research report which you can read here, it’s free for active Edge members.
| Jul-23 | |
| Jul-20 | |
| Jun-04 | |
| May-21 | |
| May-20 | |
| May-20 | |
| May-20 | |
| May-20 | |
| Apr-30 | |
| Apr-14 | |
| Apr-12 | |
| Apr-04 | |
| Mar-10 | |
| Mar-09 | |
| Mar-06 |
Join thousands of traders who make more informed decisions with our premium features. Real-time quotes, advanced visualizations, alerts, and much more.
Learn more about Finviz Elite