|
|
|

|
|||||
|
|
|
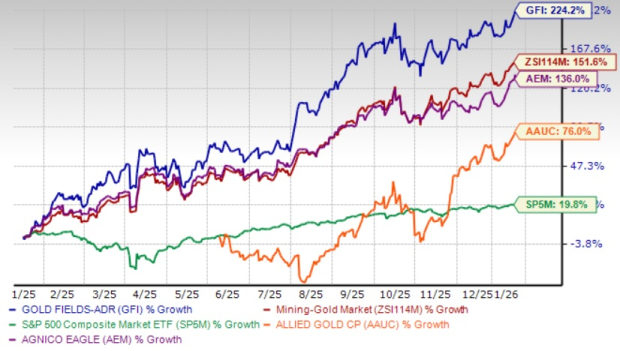
Gold Fields Limited GFI has gained 224.2% over the past year compared with the Zacks Mining-Gold industry’s 151.6% increase and the S&P 500’s 19.8% rise.
Among its peers, Agnico Eagle Mines Limited AEM and Allied Gold Corporation AAUC are up 136% and 76%, respectively.
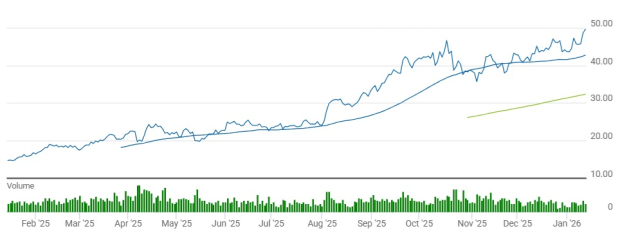
Technical indicators show that GFI has been trading above the 50-day and 200-day simple moving average (SMA). The 50-day SMA is reading higher than the 200-day SMA, indicating a bullish trend.
Let’s look at the GFI’s fundamentals to analyze the stock better.
Gold Fields delivered a strong operational performance in the third quarter of 2025 with group attributable gold-equivalent production of 621,000 ounces, up 6% quarter on quarter and 22% year on year, driven by continued momentum across its portfolio and a successful ramp-up at the Salares Norte mine in Chile. The ramp-up was a standout contributor, with gold-equivalent output at the asset totaling 112,200 ounces, marking a 53% quarter-on-quarter rise.
The operation achieved commercial production and improved throughput and recoveries in line with the plan. Cost discipline was evident, with All-in Sustaining Costs (AISC) declining 10% quarter on quarter to $1,557 per ounce and All-in Costs (AIC) dropping 11% to $1,835 per ounce, reflecting higher sold ounces and lower capital intensity in the period.
In Australia, assets including Gruyere and St Ives maintained steady operational performance during the quarter, supported by reliable ore feed, effective mine planning and high processing plant availability. Meanwhile, South Deep in South Africa recorded a constructive quarter, aided by improved underground access, consistent mining activity and ongoing operational optimization initiatives designed to enhance operational flexibility.
From a capital allocation standpoint, Gold Fields maintained a disciplined yet growth-oriented strategy. Its free cash flow was around $166 million in the third quarter.
The company significantly increased its interim dividend to 7 rand per share (equivalent to approximately 38 cents) on Aug. 22, 2025, up from 3 rand a year ago, highlighting management’s commitment to returning value to shareholders.
At the same time, it continued to fund major capital projects, particularly the ongoing development and winterization efforts at Salares Norte. For 2025, Gold Fields has guided total capital expenditure (Capex) of approximately $1.5 billion, including both sustaining and growth Capex.
At the end of the first half of the year, cash and equivalents topped $1 billion, offering flexibility for operations and growth. Although net debt rose due to project investments, the net debt-to-EBITDA was 0.17x, indicating manageable leverage. The company also extended its $1.2 billion ESG-linked credit facility, aligning funding with its sustainability target. The total debt/capital of GFI is 35.44% compared with its industry’s 12.31%.
Gold Fields’ recent growth strategy has been anchored by a combination of organic project delivery and a transformative acquisition that enhances scale and portfolio quality. The most significant development has been the Salares Norte project in Chile, which achieved commercial production in 2025 and is progressing through its ramp-up phase, with ongoing capital focused on throughput optimization, recovery improvements and winterization to ensure reliable year-round operations.
The company continues to bolster its portfolio by investing in high-quality and long-life assets. Through the 2024 acquisition of Osisko Mining, it gained full ownership of the Windfall project in Quebec, Canada. Gold Fields is progressing the project, aiming to reach a final investment decision (FID) in the first quarter of 2026. The project is expected to yield roughly 300,000 ounces of gold per year, with an estimated all-in sustaining cost of about $758 per ounce, making it a key strategic asset within Gold Fields’ portfolio.
In Australia, Gold Fields has completed its A$3.7 billion acquisition of Gold Road Resources, securing full ownership of the Tier-1 Gruyere gold mine in Western Australia. Gruyere, which previously operated as a 50:50 joint venture, produces approximately 350,000 ounces of gold annually.
The company continues to advance optimization and development initiatives at South Deep in South Africa, where production remained solid at approximately 78,000 ounces of gold in the third quarter of 2025, in line with planned output and reflecting stable underground access and improved mining rates as the optimization program progresses. In Australia, St Ives also delivered strong production, contributing roughly 184,500 ounces of gold in the first half of 2025, driven by increased volumes from new open pits such as Swiftsure and Invincible Footwall South.
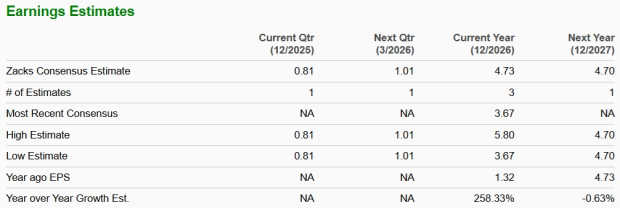
The Zacks Consensus Estimate for 2026 and 2027 for GFI has been revised higher over the past 90 days.
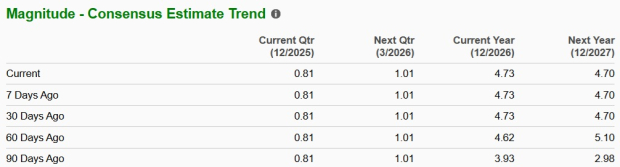
The Zacks Consensus Estimate for GFI’s 2026 earnings is currently pegged at $4.73, suggesting solid year-over-year growth of 258.33%.
GFI is currently trading at a forward 12-month price-to-sales multiple of 3.96X, below the industry average of 4.08X and above its five-year median.
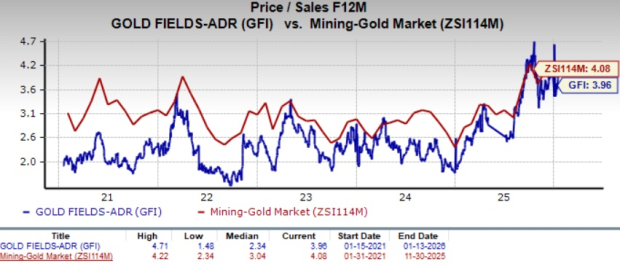
The forward 12-month price-to-sales multiples for Agnico Eagle and Allied Gold are 7.86X and 1.73X, respectively. GFI has a Value Score of C, AEM has a score of D and AAUC has a score of B.
Gold Fields offers a solid long-term position supported by stable production, disciplined cost management and leverage to firm gold prices. The company’s expanding projects and ongoing operational improvements provide a constructive backdrop for future growth. However, near-term headwinds, including project execution risks and volatility in gold prices, temper the outlook and limit upside potential in the short run. The stock presents a balanced risk-reward profile, making a hold stance a suitable approach.
GFI currently carries a Zacks Rank of #3 (Hold).
You can see the complete list of today’s Zacks #1 Rank (Strong Buy) stocks here.
Want the latest recommendations from Zacks Investment Research? Today, you can download 7 Best Stocks for the Next 30 Days. Click to get this free report
This article originally published on Zacks Investment Research (zacks.com).
| Jul-30 | |
| Jul-30 | |
| Jul-30 | |
| Jul-30 | |
| Jul-29 | |
| Jul-29 | |
| Jul-29 | |
| Jul-29 | |
| Jul-29 | |
| Jul-28 | |
| Jul-24 | |
| Jul-23 | |
| Jul-21 | |
| Jul-10 | |
| Jul-08 |
Join thousands of traders who make more informed decisions with our premium features. Real-time quotes, advanced visualizations, alerts, and much more.
Learn more about Finviz Elite