|
|
|

|
|||||
|
|
|
The S&P 500 has produced phenomenal returns over the last three years.
Those returns have been led by a small minority of the stocks in the index.
History says this index fund could outperform the S&P 500 over the next decade.
The S&P 500 (SNPINDEX: ^GSPC) has been on a historical run over the past three years. The index produced a total return of 86% from the start of 2023 through the end of 2025. Most investors are probably looking at their portfolio at the start of 2026 with big smiles on their faces.
But those returns have been heavily concentrated in just a handful of stocks. In fact, unless you stick exclusively to S&P 500 index funds, your returns over the last three years have likely looked much different from the index average. Just seven stocks accounted for nearly half the total return of the S&P 500 last year. Thirty-percent or fewer of the index components have outperformed the average index return in each of the last three years.
Where to invest $1,000 right now? Our analyst team just revealed what they believe are the 10 best stocks to buy right now, when you join Stock Advisor. See the stocks »
The result is a historic event in the S&P 500. The market-cap-weighted index outperformed the equal-weight version of the S&P 500 by the widest margin over any three-year period since 1971. And history has a clear answer about what happens in 2026 and beyond.
Image source: Getty Images.
While the S&P 500 produced a total return of 86% between 2023 and 2025, its equal-weight counterpart produced a total return of just 43% in that time. Put another way, someone who invested in an S&P 500 index fund at the start of 2023 has a portfolio worth 30% more than someone who thought the equal-weight index fund looked like a better option.
The last time the ratio of outperformance approached that level was in the late 1990s. The S&P 500 produced returns that were 28% higher than the equal-weight index in the three-year period from 1997 to 1999.
That period is well-known as the height of the dot-com bubble. And many have drawn similarities between today's stock market and that of the late '90s. The excitement surrounding artificial intelligence (AI) and companies in the industry echoes that surrounding internet stocks 30 years ago. Meanwhile, valuations have climbed to levels not seen since the tail end of the dot-com bubble, and there's been increasing concentration in the benchmark stock index.
We saw a stunning reversal when the bubble popped. The equal-weight index went on to outperform the S&P 500 for seven consecutive years. In the 10-year period that followed, known as the "lost decade," the equal-weight index produced a total return of 65% while the S&P 500 declined 9%. So it seems the decade wasn't lost for the entirety of the S&P 500 components.
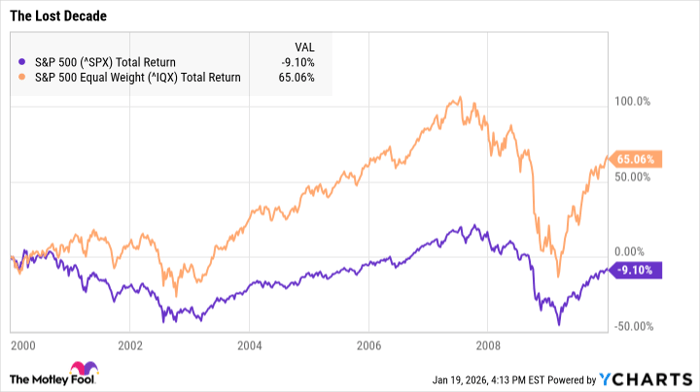
The lost decade is a bit of an anomaly in stock market history. Not only did we see the dot-com bubble pop, but the great financial crisis took its toll later in the decade. Those two events were unrelated, so investors should exercise caution when drawing conclusions from that period.
But that's not the only time high market concentration ultimately led to years of outperformance by the equal-weight index. The Nifty Fifty -- a grouping of 50 prominent stocks in the late 1960s and 1970s -- pushed stocks higher, but ultimately led to the bear market of 1973 and 1974. The equal-weight index outperformed in nine of 10 years between 1974 and 1983, producing a total return of 410% during the period versus 173% for the S&P 500.
That is to say, the market can move in cycles of increasing concentration to broader performance. As the market becomes increasingly concentrated, the odds are good we'll move back toward broader performance for S&P 500 components.
What's more, the equal-weight index has historically outperformed over the long run. After all, it's much easier for a smaller company to produce a relatively large increase in value. Since 1971, the equal-weight index has outperformed the S&P 500 by an average of 1.2% per year, which can add up over the long run.
With that in mind, investors may want to consider adding an equal-weight index fund to their portfolio, like the Invesco S&P 500 Equal Weight ETF (NYSEMKT: RSP). It can be a simple way to reduce concentration risk and capitalize on expectations that the market will broaden out from its current level over time.
Before you buy stock in S&P 500 Index, consider this:
The Motley Fool Stock Advisor analyst team just identified what they believe are the 10 best stocks for investors to buy now… and S&P 500 Index wasn’t one of them. The 10 stocks that made the cut could produce monster returns in the coming years.
Consider when Netflix made this list on December 17, 2004... if you invested $1,000 at the time of our recommendation, you’d have $460,340!* Or when Nvidia made this list on April 15, 2005... if you invested $1,000 at the time of our recommendation, you’d have $1,123,789!*
Now, it’s worth noting Stock Advisor’s total average return is 937% — a market-crushing outperformance compared to 194% for the S&P 500. Don't miss the latest top 10 list, available with Stock Advisor, and join an investing community built by individual investors for individual investors.
*Stock Advisor returns as of January 22, 2026.
Adam Levy has no position in any of the stocks mentioned. The Motley Fool has no position in any of the stocks mentioned. The Motley Fool has a disclosure policy.
| Jul-09 | |
| Jul-09 | |
| Jul-08 | |
| Jul-05 | |
| Jul-02 | |
| May-28 | |
| May-12 | |
| Apr-28 | |
| Apr-21 | |
| Apr-15 | |
| Apr-14 | |
| Mar-27 | |
| Mar-17 | |
| Mar-17 | |
| Mar-16 |
Join thousands of traders who make more informed decisions with our premium features. Real-time quotes, advanced visualizations, alerts, and much more.
Learn more about Finviz Elite