|
|
|

|
|||||
|
|
|

Industrial conglomerate Honeywell (NASDAQ:HON) missed Wall Street’s revenue expectations in Q4 CY2025, but sales rose 6.4% year on year to $9.76 billion. The company’s full-year revenue guidance of $39.3 billion at the midpoint came in 0.8% below analysts’ estimates. Its non-GAAP profit of $2.59 per share was 2.1% above analysts’ consensus estimates.
Is now the time to buy Honeywell? Find out by accessing our full research report, it’s free.
Originally founded in 1906 as a thermostat company, Honeywell (NASDAQ:HON) is a multinational conglomerate known for its aerospace systems, building technologies, performance materials, and safety and productivity solutions.
A company’s long-term sales performance is one signal of its overall quality. Any business can have short-term success, but a top-tier one grows for years. Unfortunately, Honeywell’s 2.8% annualized revenue growth over the last five years was sluggish. This fell short of our benchmarks and is a rough starting point for our analysis.
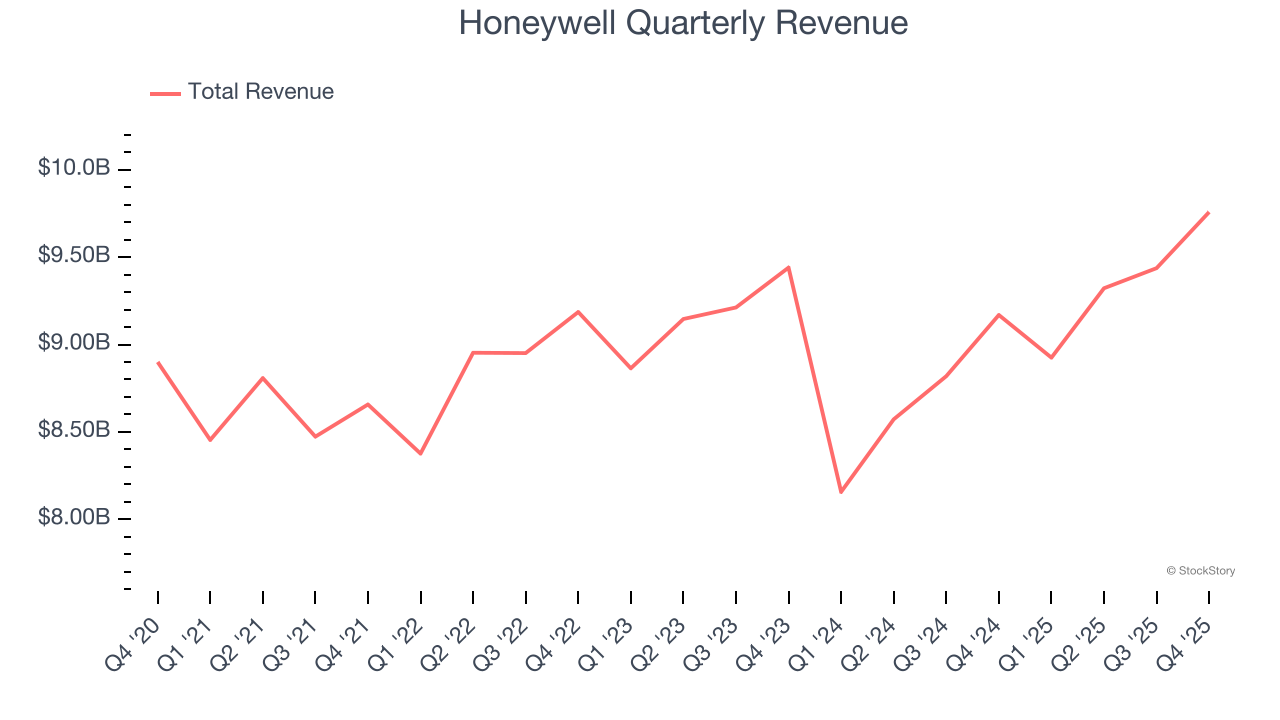
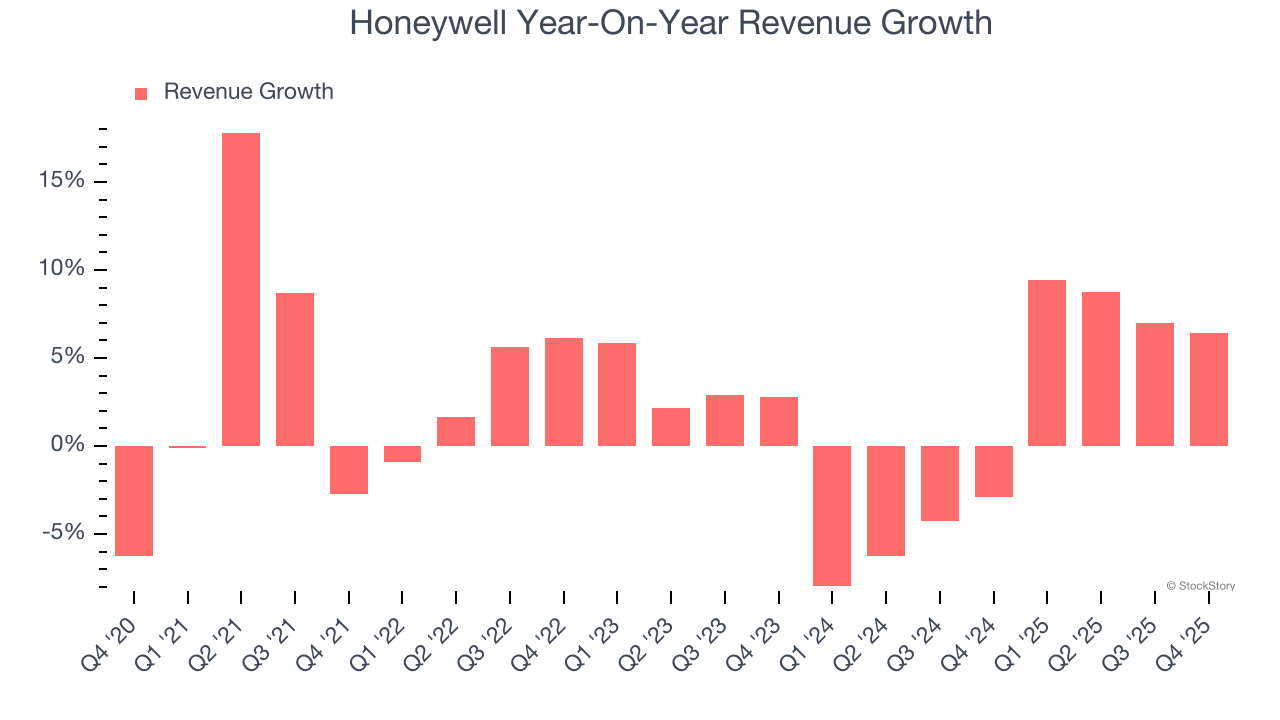
Long-term growth is the most important, but within industrials, a half-decade historical view may miss new industry trends or demand cycles. Honeywell’s recent performance shows its demand has slowed as its annualized revenue growth of 1.1% over the last two years was below its five-year trend.
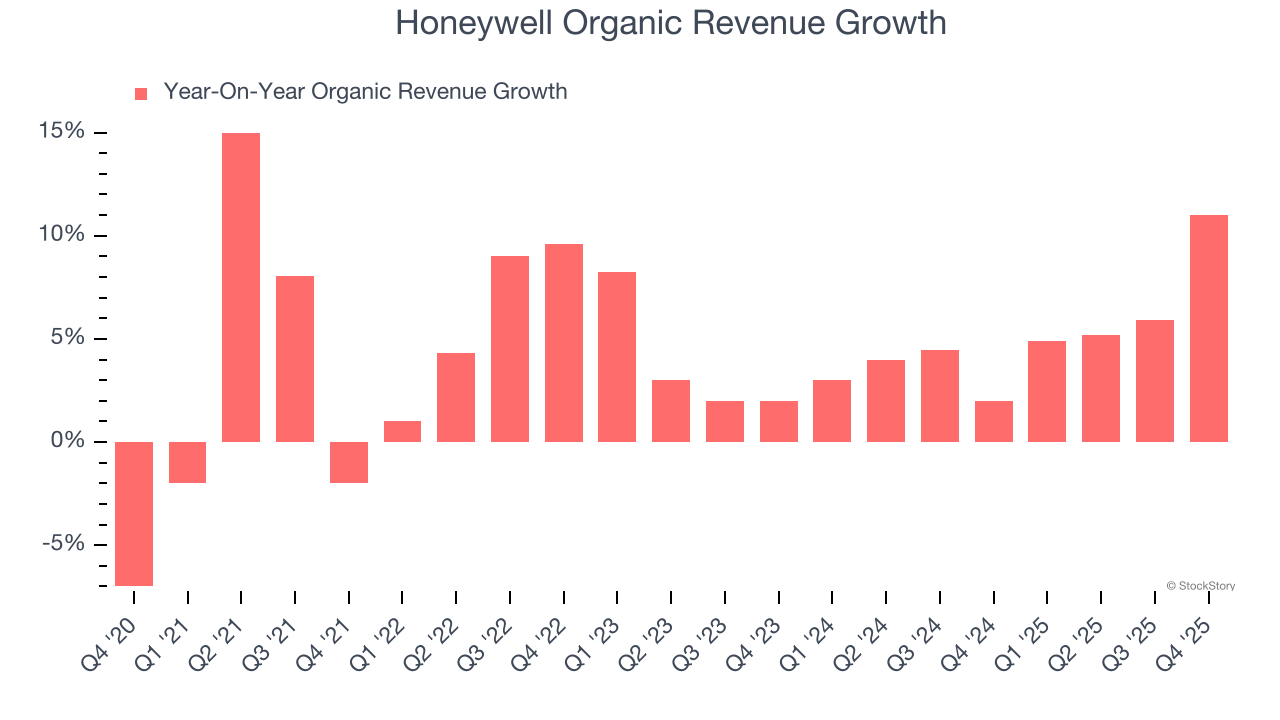
We can dig further into the company’s sales dynamics by analyzing its organic revenue, which strips out one-time events like acquisitions and currency fluctuations that don’t accurately reflect its fundamentals. Over the last two years, Honeywell’s organic revenue averaged 5.1% year-on-year growth. Because this number is better than its two-year revenue growth, we can see that some mixture of divestitures and foreign exchange rates dampened its headline results.
This quarter, Honeywell’s revenue grew by 6.4% year on year to $9.76 billion, missing Wall Street’s estimates.
Looking ahead, sell-side analysts expect revenue to grow 5.7% over the next 12 months. While this projection implies its newer products and services will fuel better top-line performance, it is still below the sector average.
Microsoft, Alphabet, Coca-Cola, Monster Beverage—all began as under-the-radar growth stories riding a massive trend. We’ve identified the next one: a profitable AI semiconductor play Wall Street is still overlooking. Go here for access to our full report.
Honeywell has been a well-oiled machine over the last five years. It demonstrated elite profitability for an industrials business, boasting an average operating margin of 20.6%. This result isn’t too surprising as its gross margin gives it a favorable starting point.
Analyzing the trend in its profitability, Honeywell’s operating margin decreased by 2.9 percentage points over the last five years. This raises questions about the company’s expense base because its revenue growth should have given it leverage on its fixed costs, resulting in better economies of scale and profitability.
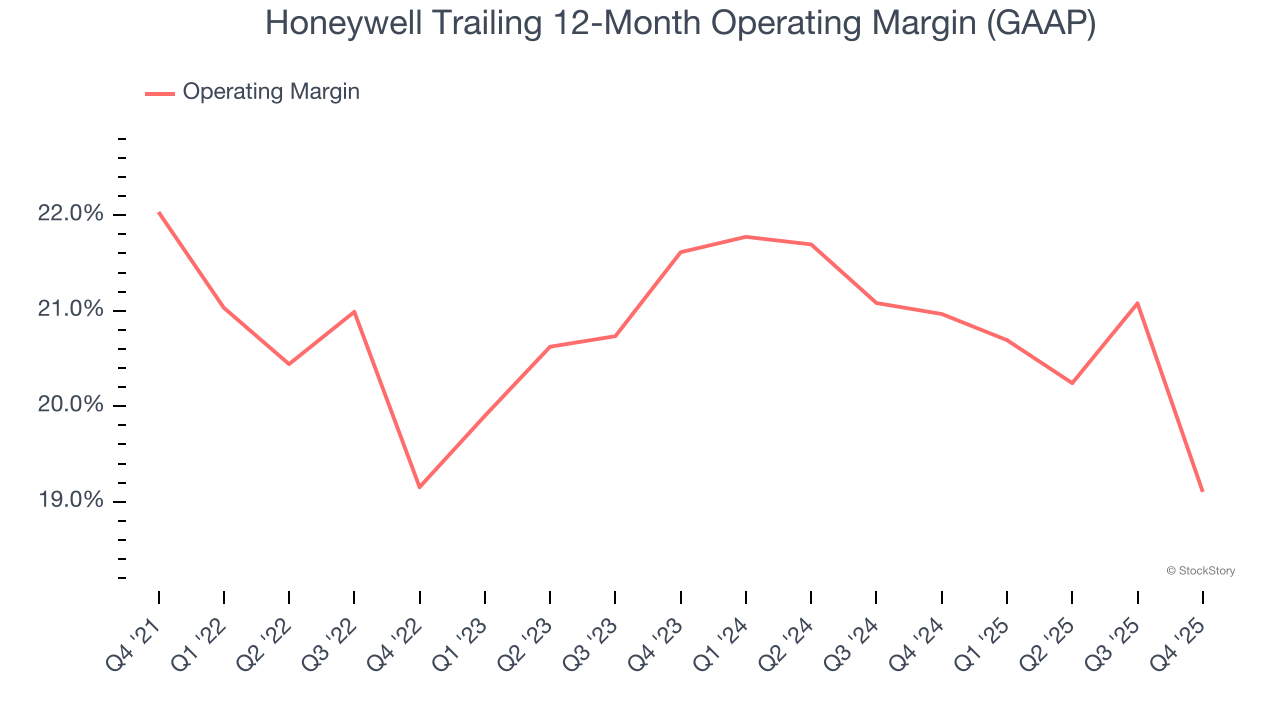
This quarter, Honeywell generated an operating margin profit margin of 10.2%, down 7.4 percentage points year on year. Conversely, its revenue and gross margin actually rose, so we can assume it was less efficient because its operating expenses like marketing, R&D, and administrative overhead grew faster than its revenue.
Revenue trends explain a company’s historical growth, but the long-term change in earnings per share (EPS) points to the profitability of that growth – for example, a company could inflate its sales through excessive spending on advertising and promotions.
Honeywell’s EPS grew at a decent 8.5% compounded annual growth rate over the last five years, higher than its 2.8% annualized revenue growth. However, this alone doesn’t tell us much about its business quality because its operating margin didn’t improve.
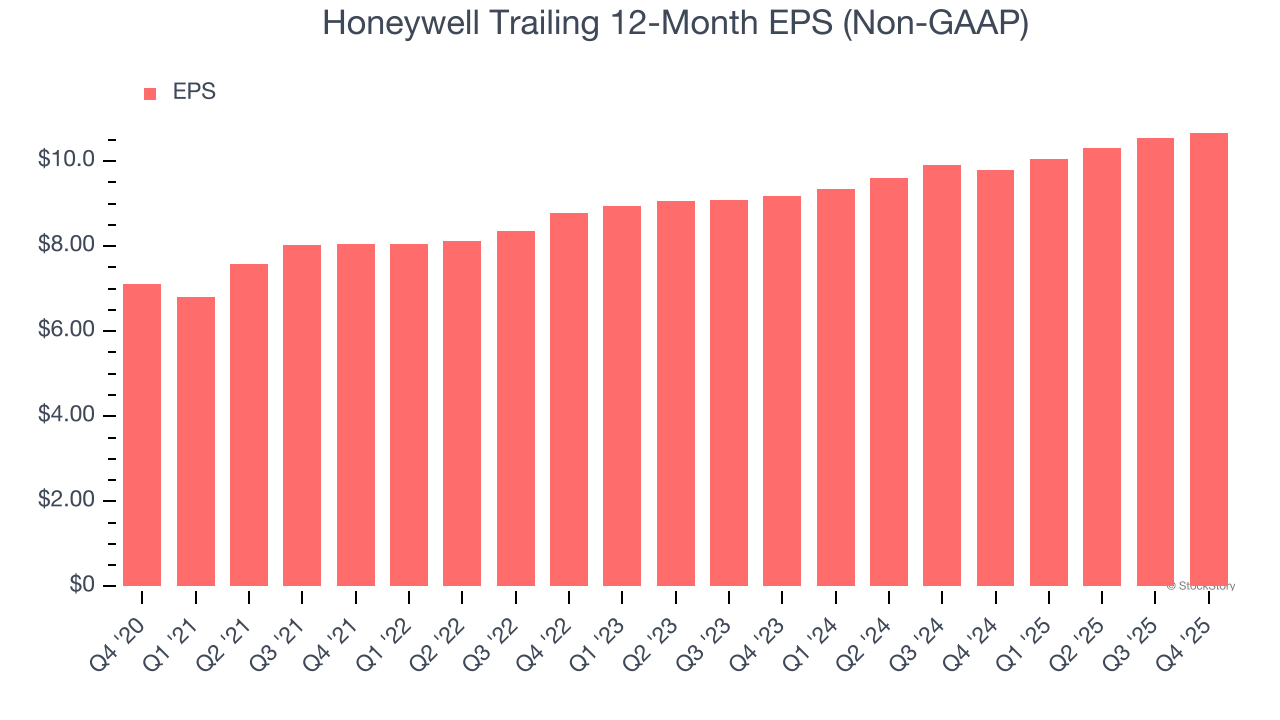
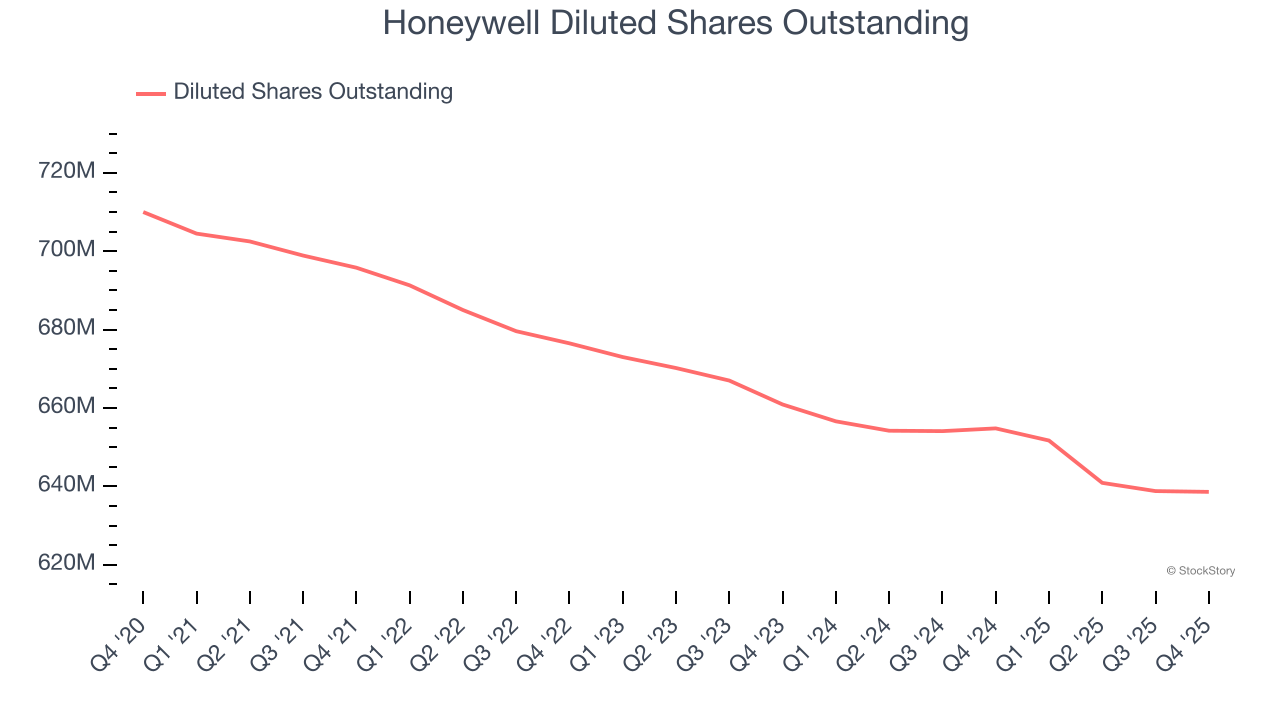
Diving into Honeywell’s quality of earnings can give us a better understanding of its performance. A five-year view shows that Honeywell has repurchased its stock, shrinking its share count by 10.1%. This tells us its EPS outperformed its revenue not because of increased operational efficiency but financial engineering, as buybacks boost per share earnings.
Like with revenue, we analyze EPS over a more recent period because it can provide insight into an emerging theme or development for the business.
For Honeywell, its two-year annual EPS growth of 7.9% is similar to its five-year trend, implying stable earnings.
In Q4, Honeywell reported adjusted EPS of $2.59, up from $2.47 in the same quarter last year. This print beat analysts’ estimates by 2.1%. Over the next 12 months, Wall Street expects Honeywell’s full-year EPS of $10.67 to shrink by 2.2%.
We enjoyed seeing Honeywell beat analysts’ organic revenue expectations this quarter. We were also glad its full-year EPS guidance slightly exceeded Wall Street’s estimates. On the other hand, its revenue missed and its full-year revenue guidance fell slightly short of Wall Street’s estimates. Zooming out, we think this was a mixed quarter. The stock remained flat at $216.89 immediately following the results.
Should you buy the stock or not? What happened in the latest quarter matters, but not as much as longer-term business quality and valuation, when deciding whether to invest in this stock. We cover that in our actionable full research report which you can read here (it’s free).
| Apr-09 | |
| Apr-03 | |
| Apr-02 | |
| Apr-02 | |
| Apr-01 | |
| Apr-01 | |
| Mar-31 | |
| Mar-28 | |
| Mar-27 | |
| Mar-27 | |
| Mar-27 | |
| Mar-26 | |
| Mar-26 | |
| Mar-26 | |
| Mar-25 |
Join thousands of traders who make more informed decisions with our premium features. Real-time quotes, advanced visualizations, alerts, and much more.
Learn more about Finviz Elite