|
|
|

|
|||||
|
|
|

Professional services firm Marsh & McLennan (NYSE:MMC) beat Wall Street’s revenue expectations in Q4 CY2025, with sales up 8.7% year on year to $6.60 billion. Its non-GAAP profit of $2.12 per share was 7.4% above analysts’ consensus estimates.
Is now the time to buy Marsh & McLennan? Find out by accessing our full research report, it’s free.
John Doyle, President and CEO, said: "Our fourth quarter results capped another solid year for Marsh. For the full year, we generated 10% revenue growth, 4% underlying revenue growth, double-digit adjusted NOI growth, 9% adjusted EPS growth and our 18th consecutive year of reported margin expansion. We also launched our new brand, successfully completed the integration of McGriff and announced our Thrive program. "
With roots dating back to 1871 and a presence in over 130 countries, Marsh & McLennan (NYSE:MMC) is a global professional services firm that helps organizations manage risk, strategy, and workforce challenges through its four specialized businesses.
Examining a company’s long-term performance can provide clues about its quality. Even a bad business can shine for one or two quarters, but a top-tier one grows for years.
With $26.98 billion in revenue over the past 12 months, Marsh & McLennan is a behemoth in the business services sector and benefits from economies of scale, giving it an edge in distribution. This also enables it to gain more leverage on its fixed costs than smaller competitors and the flexibility to offer lower prices.
As you can see below, Marsh & McLennan grew its sales at an impressive 9.4% compounded annual growth rate over the last five years. This is an encouraging starting point for our analysis because it shows Marsh & McLennan’s demand was higher than many business services companies.
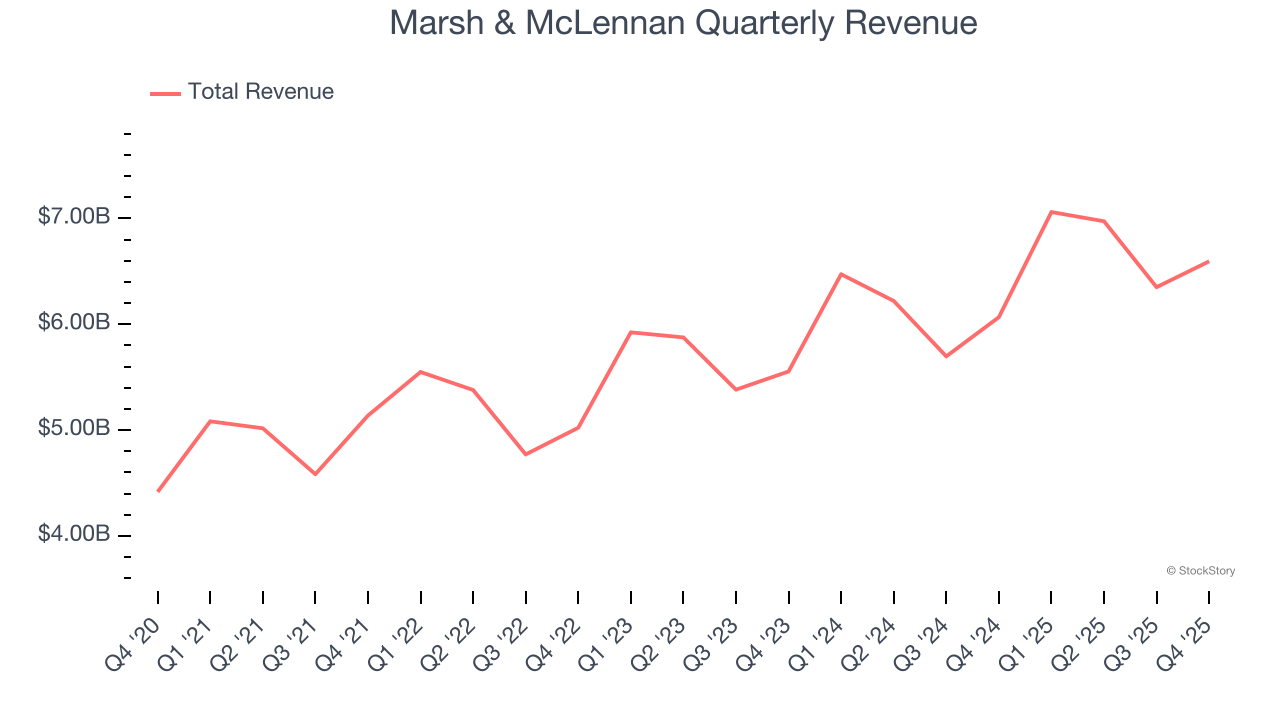
We at StockStory place the most emphasis on long-term growth, but within business services, a half-decade historical view may miss recent innovations or disruptive industry trends. Marsh & McLennan’s annualized revenue growth of 8.9% over the last two years aligns with its five-year trend, suggesting its demand was predictably strong.
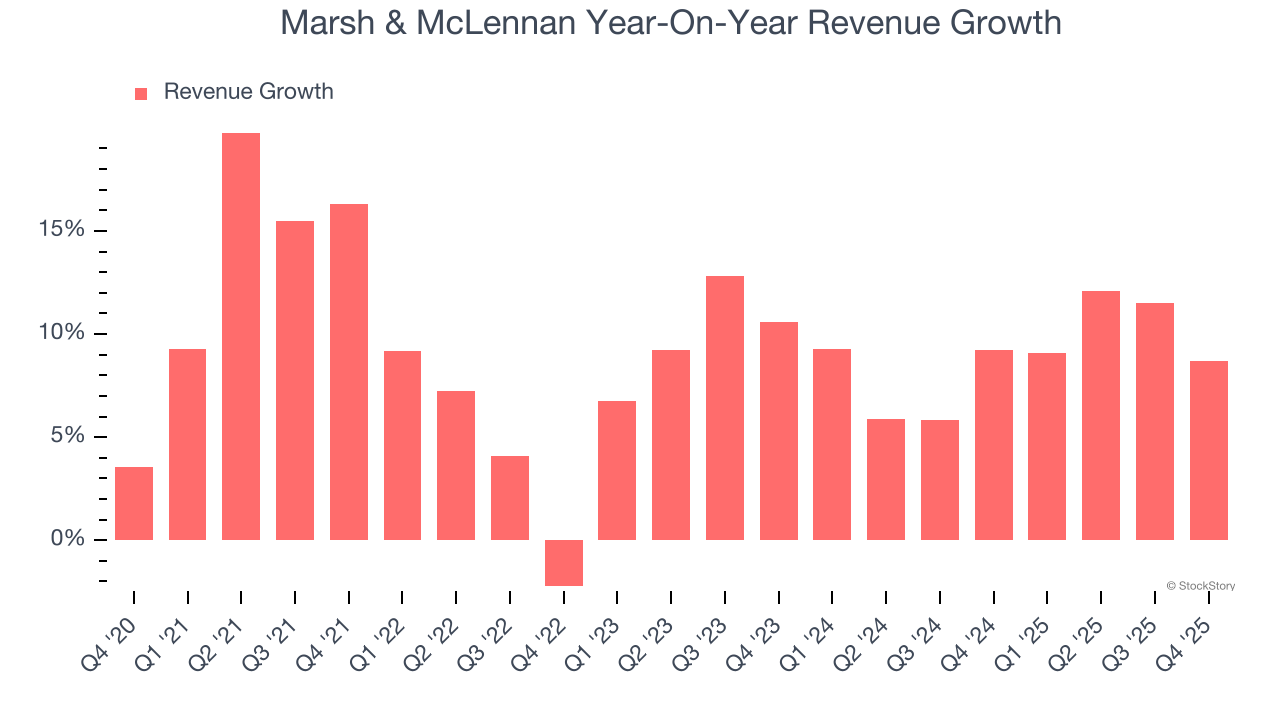
This quarter, Marsh & McLennan reported year-on-year revenue growth of 8.7%, and its $6.60 billion of revenue exceeded Wall Street’s estimates by 0.7%.
Looking ahead, sell-side analysts expect revenue to grow 4.5% over the next 12 months, a deceleration versus the last two years. This projection is underwhelming and implies its products and services will face some demand challenges. At least the company is tracking well in other measures of financial health.
Microsoft, Alphabet, Coca-Cola, Monster Beverage—all began as under-the-radar growth stories riding a massive trend. We’ve identified the next one: a profitable AI semiconductor play Wall Street is still overlooking. Go here for access to our full report.
Marsh & McLennan has been a well-oiled machine over the last five years. It demonstrated elite profitability for a business services business, boasting an average operating margin of 22.6%.
Looking at the trend in its profitability, Marsh & McLennan’s operating margin rose by 1.3 percentage points over the last five years, as its sales growth gave it operating leverage.
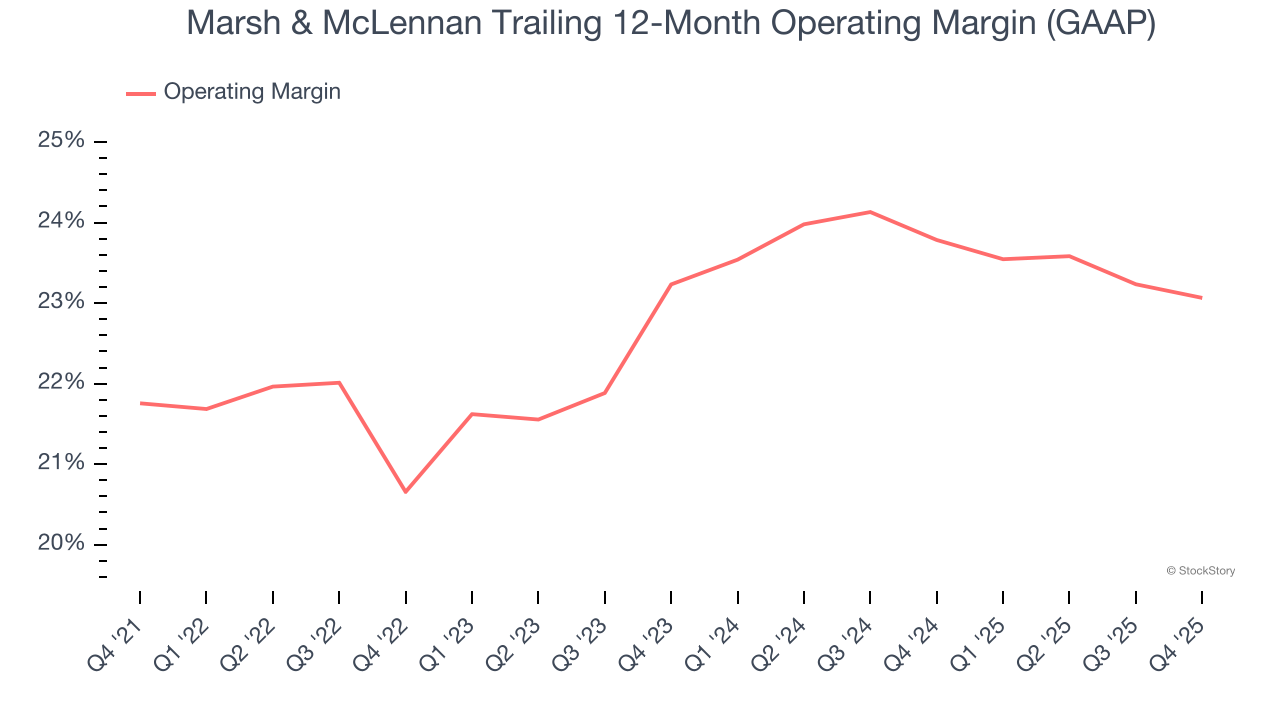
In Q4, Marsh & McLennan generated an operating margin profit margin of 18.5%, in line with the same quarter last year. This indicates the company’s overall cost structure has been relatively stable.
Revenue trends explain a company’s historical growth, but the long-term change in earnings per share (EPS) points to the profitability of that growth – for example, a company could inflate its sales through excessive spending on advertising and promotions.
Marsh & McLennan’s EPS grew at a spectacular 14.4% compounded annual growth rate over the last five years, higher than its 9.4% annualized revenue growth. This tells us the company became more profitable on a per-share basis as it expanded.
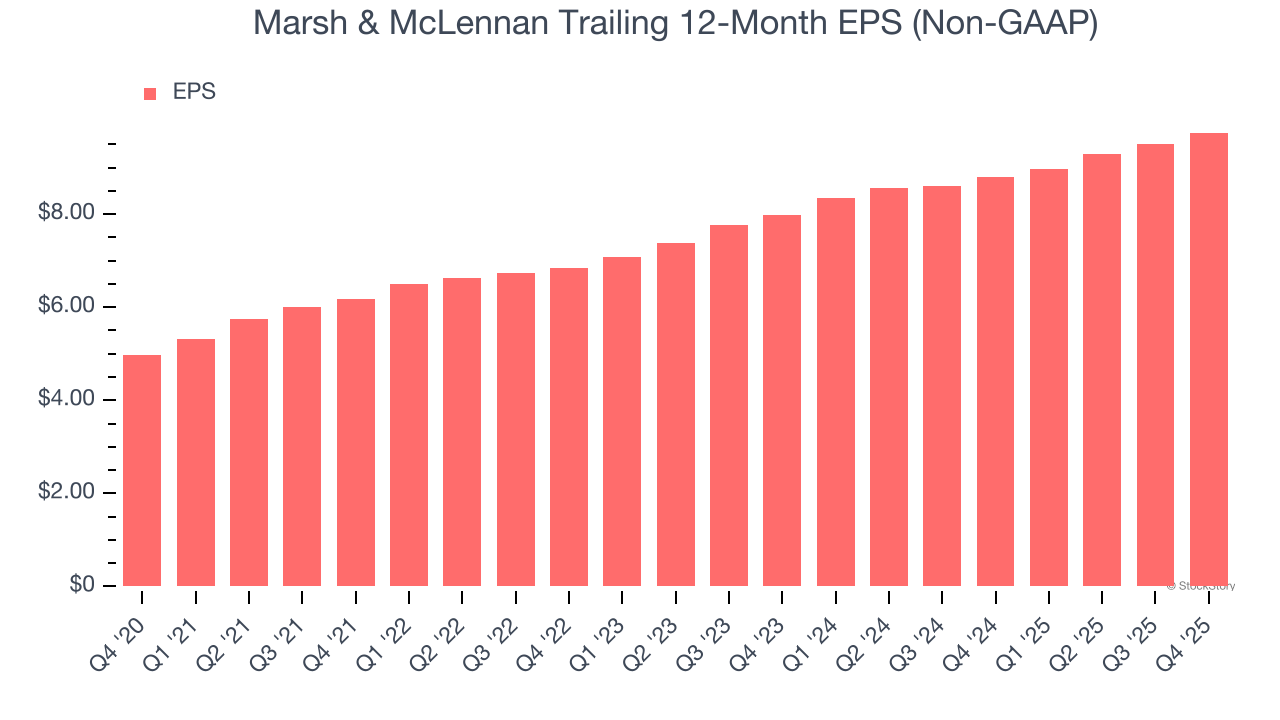
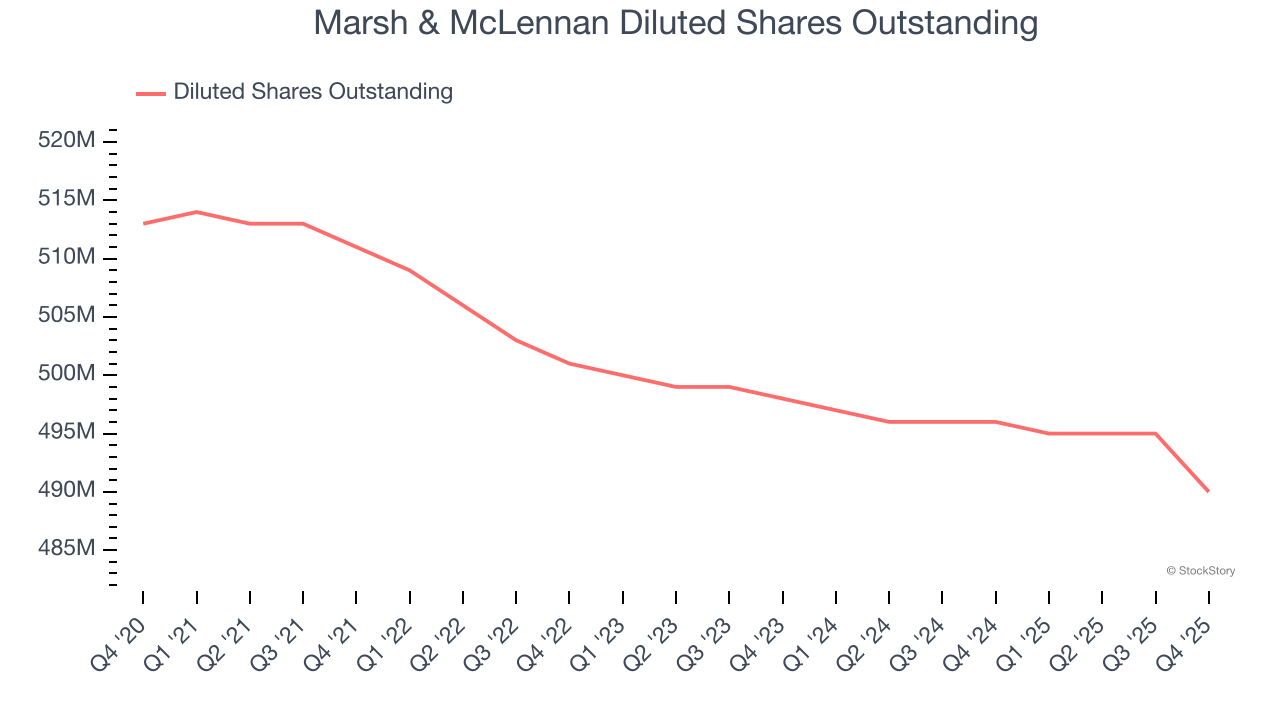
Diving into the nuances of Marsh & McLennan’s earnings can give us a better understanding of its performance. As we mentioned earlier, Marsh & McLennan’s operating margin was flat this quarter but expanded by 1.3 percentage points over the last five years. On top of that, its share count shrank by 4.5%. These are positive signs for shareholders because improving profitability and share buybacks turbocharge EPS growth relative to revenue growth.
Like with revenue, we analyze EPS over a more recent period because it can provide insight into an emerging theme or development for the business.
For Marsh & McLennan, its two-year annual EPS growth of 10.5% was lower than its five-year trend. This wasn’t great, but at least the company was successful in other measures of financial health.
In Q4, Marsh & McLennan reported adjusted EPS of $2.12, up from $1.87 in the same quarter last year. This print beat analysts’ estimates by 7.4%. Over the next 12 months, Wall Street expects Marsh & McLennan’s full-year EPS of $9.75 to grow 5.5%.
It was good to see Marsh & McLennan beat analysts’ EPS expectations this quarter. We were also happy its revenue narrowly outperformed Wall Street’s estimates. Overall, we think this was a decent quarter with some key metrics above expectations. The stock remained flat at $178.60 immediately after reporting.
Indeed, Marsh & McLennan had a rock-solid quarterly earnings result, but is this stock a good investment here? If you’re making that decision, you should consider the bigger picture of valuation, business qualities, as well as the latest earnings. We cover that in our actionable full research report which you can read here (it’s free).
| Jul-08 | |
| Jun-23 | |
| Jun-01 | |
| Jun-01 | |
| May-21 | |
| May-20 | |
| May-19 | |
| May-07 | |
| May-06 | |
| May-04 | |
| Apr-30 | |
| Apr-29 | |
| Apr-29 | |
| Apr-28 | |
| Apr-28 |
Join thousands of traders who make more informed decisions with our premium features. Real-time quotes, advanced visualizations, alerts, and much more.
Learn more about Finviz Elite