|
|
|

|
|||||
|
|
|
It's no longer accurate to say that SanDisk Corp. (NASDAQ:SNDK) is merely outperforming. The stock is trading as if conventional market rules have been suspended — moving with a force that looks increasingly untethered from gravity.
On Monday alone, shares of SanDisk surged 15%. Zoom out, and the scale of the move becomes increasingly difficult to contextualize: the stock is up more than 1,700% over the past year, 150% in the last month, and 250% over the past three months.
Last week, SanDisk blew past earnings estimates and raised forecasts, fueled by booming demand for data-center memory chips.
The advance is being powered by a deepening memory and storage supply crunch. Exploding AI demand is crowding out traditional DRAM and NAND production, while hyperscalers prioritize immediate capacity over long-dated supply contracts.
The result is tightening availability across the industry and a sharp escalation in pricing power.
That dynamic has lifted the broader memory and storage complex. Shares of Seagate Technology Holdings (NASDAQ:STX), Western Digital Corp. (NASDAQ:WDC), Micron Technology Inc. (NASDAQ:MU), Samsung Electronics Co. and SK Hynix Inc. have all participated in the move to varying degrees.
But SanDisk has pulled decisively away from the pack — and the technical picture highlights just how extreme that separation has become.
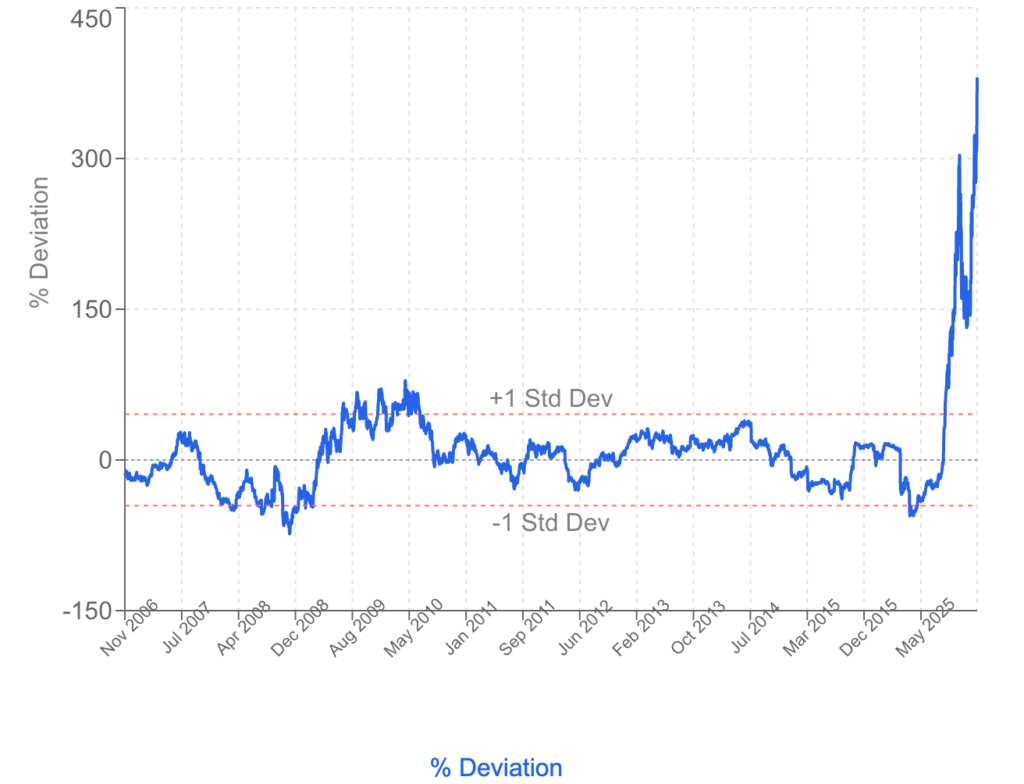
With a historical standard deviation of ±45.40% from the 200-day moving average, a 380% displacement places the stock in 8-sigma territory.
For perspective, a 2-sigma deviation is already considered statistically unusual and typically signals a sharply extended condition.
A 3-sigma move is rare. An 8-sigma separation is almost unheard of.
That alone does not imply an imminent reversal. Parabolic advances can persist far longer than conventional models anticipate, especially when fundamentals, supply constraints, and positioning reinforce one another.
But at these extremes, traditional technical frameworks lose much of their predictive power.
At this distance from the mean, risk becomes nonlinear. Volatility turns asymmetric—and when gravity eventually reasserts itself, it rarely does so gently.
Image: Shutterstock
| 8 min | |
| 13 min | |
| 40 min | |
| 51 min | |
| 1 hour | |
| 1 hour | |
| 1 hour | |
| 2 hours | |
| 2 hours | |
| 2 hours |
DRAM: Is the fastest-growing ETF ever just another momentum trade?
MU +17.90% SNDK +7.72%
Yahoo Finance Video
|
| 2 hours | |
| 2 hours | |
| 2 hours | |
| 2 hours | |
| 2 hours |
Join thousands of traders who make more informed decisions with our premium features. Real-time quotes, advanced visualizations, alerts, and much more.
Learn more about Finviz Elite