|
|
|

|
|||||
|
|
|
Many of the greatest financial minds share the same views about the power of flexibility in investing:
“Bend like a tree in the wind.” ~ William O’Neil
“I believe in maximum flexibility, so I reserve the right to change my position on any subject when the external environment relating to any topic changes, too.” ~ Stanley Druckenmiller
“When the facts change, I change my mind. What do you do, sir?” ~ John Maynard Keynes
Entering February, I wrote the article, “February Flinch: Why the Bull Market is Due for a Breather.” At the time, my bearish short-term view centered on deteriorating market leadership, bearish February seasonality trends, and sentiment that was extremely bullish. While the Nasdaq corrected by ~4%, several data points have changed to suggest bulls have regained control of the market. Below are the reasons I have flipped back to bull camp:
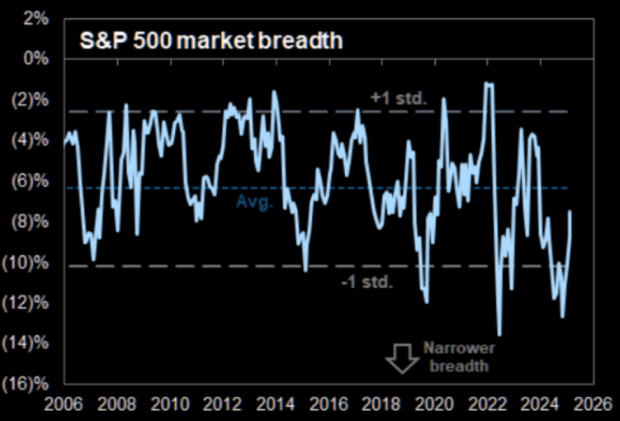
Market breadth (participation) is the best gauge of a bull market’s sustainability and strength. Recently, the S&P 500 market breadth plunged to its narrowest levels since the ‘Liberation Day’ market plunge last April. Today, the S&P 500 market breadth has expanded dramatically off the recent lows, a bullish sign.
Last week, investors piled into short positions as single-stock shorts set a record. However, stocks (particularly tech stocks) have rallied viciously off last week’s lows, meaning many shorts are likely caught offside. When shorts are caught offside, it can act as added fuel for the bull market.

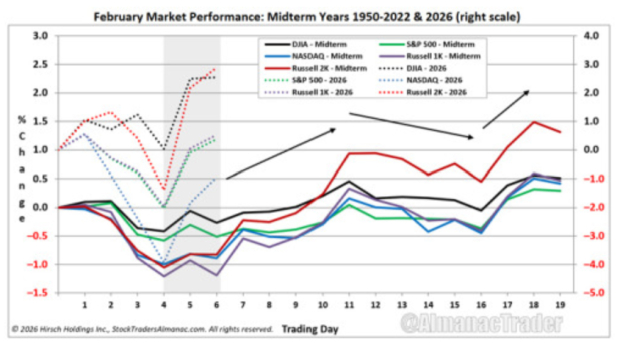
According to Jeffrey Hirsch (@almanactrader), the foremost expert on seasonality patterns, “Today’s across-the-board gains by DJIA, S&P 500, NASDAQ, and Russell 2000 build on last Friday’s surge and suggest the lows of February are likely in, barring an exogenous event.”
Trucking spot rates are up $0.61/mile over the past four months. Such strength is highly unusual for February, which is typically one of the slowest months of the year. The strength in the truckload index signals a robust underlying economy.

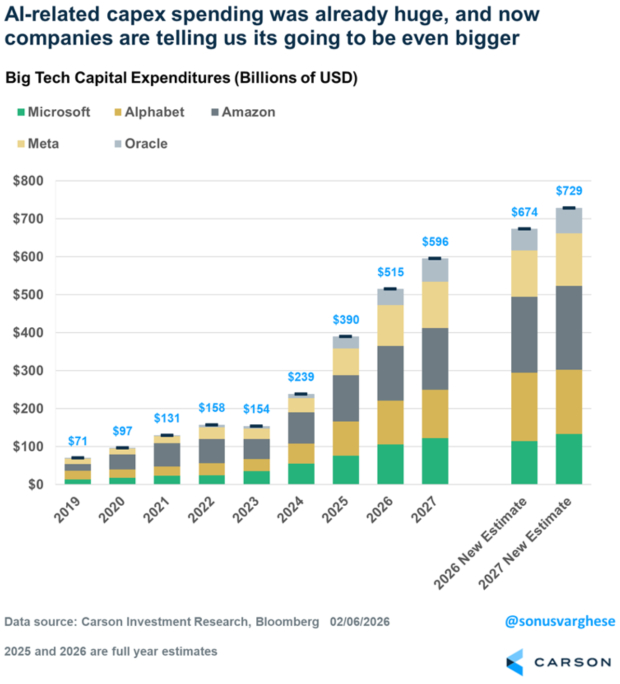
In 2025, CAPEX spending among hyperscalers such as Oracle (ORCL), Alphabet (GOOGL), Amazon (AMZN), Meta Platforms (META), and Microsoft (MSFT) totaled $390 billion. However, the latest estimates and guidance suggest that AI-related CAPEX spending will soar even higher to $515 billion in 2026. According to Ryan Detrick of Carson Research, AI spending now accounts for more than 2% of GDP, more than what was spent on the railroads in the 1850s.
Meanwhile, it’s critical for investors to understand that the AI CAPEX spending does not occur in a vacuum. Monday, several AI “Pick-and-shovel” infrastructure stocks like IREN (IREN), Cipher Mining (CIFR), Astera Labs (ALAB), TeraWulf (WULF), and Nebius Group (NBIS) soared on heavier-than-normal turnover, illustrating the snowballing effect of CAPEX spending. While many of these companies have yet to turn a profit, top-line estimates are extremely robust. For instance, Zacks Consensus Estimates suggest that Nebius Group’s annual revenues will leap nearly 5x in 2026.

Bottom Line
The combination of improving breadth, positive seasonal trends, and a massive wave of AI spending suggests the bulls are back in control of markets.
Want the latest recommendations from Zacks Investment Research? Today, you can download 7 Best Stocks for the Next 30 Days. Click to get this free report
This article originally published on Zacks Investment Research (zacks.com).
| 8 min | |
| 10 min |
Alphabet's Q2 earnings are a likely pacesetter for the market, Big Tech
ORCL GOOGL
Yahoo Finance Video
|
| 11 min | |
| 35 min | |
| 46 min | |
| 50 min | |
| 51 min | |
| 1 hour | |
| 1 hour | |
| 1 hour | |
| 1 hour | |
| 1 hour | |
| 1 hour | |
| 1 hour | |
| 1 hour |
Join thousands of traders who make more informed decisions with our premium features. Real-time quotes, advanced visualizations, alerts, and much more.
Learn more about Finviz Elite