|
|
|

|
|||||
|
|
|
The Hain Celestial Group, Inc. HAIN posted second-quarter fiscal 2026 results, with the top and bottom lines declining year over year. The top line surpassed the consensus mark and the bottom line met the same. HAIN shares declined 19.5% yesterday as investors focused on the magnitude of the volume declines, continued pressure in the snacks and baby categories, and near-term margin headwinds, including stranded costs tied to the announced divestiture of the North American snacks business.
Although management highlighted strong cash flow, debt-reduction initiatives and expectations for sequential improvement in the second half, the absence of formal guidance and leverage that remains elevated ahead of the 2026 maturity appears to have weighed on sentiment.

The Hain Celestial Group, Inc. price-consensus-eps-surprise-chart | The Hain Celestial Group, Inc. Quote
The company posted an adjusted loss of 3 cents per share. The bottom line declined from adjusted earnings of 8 cents in the year-ago quarter.
Net sales of $384.1 million beat the consensus estimate of $383 million, declining 6.7% year over year. Organic net sales also decreased 7%, led by a 9-point decline in the volume and mix, partially offset by a 2-point benefit from pricing actions.
Adjusted gross profit declined to $74.9 million from $94.3 million in the prior-year quarter. The adjusted gross margin contracted 340 basis points year over year to 19.5%, driven by cost inflation, unfavorable fixed-cost absorption, and lower volume and mix, partially offset by productivity gains and pricing. We anticipated the adjusted gross margin to be 21% in the quarter under review.
SG&A expenses were $60.9 million, down 13.2% from $70.2 million in the year-ago quarter, reflecting lower employee-related expenses and disciplined management of non-personnel costs following the implementation of overhead reduction actions. As a percentage of net sales, this metric decreased 110 bps year over year to 15.9% in the quarter under review.
Adjusted EBITDA was $24.3 million, down 35.9% from $37.9 million in the prior-year quarter. The adjusted EBITDA margin decreased 290 basis points year over year to 6.3%, which beat our estimate of 5.6%.
Net sales in the North America segment dropped 13.7% year over year to $197.8 million, falling short of our estimate of $200.6 million. Organic net sales declined 10.3% due to weakness in snacks and baby formula, partly offset by growth in beverages.
Adjusted gross profit in North America came in at $41.2 million, down 28.8% from the prior-year quarter.
The adjusted gross margin contracted 440 basis points to 20.8%, hurt by lower volume and mix, cost inflation, and unfavorable fixed-cost absorption, though productivity savings and pricing provided some cushion.
Adjusted EBITDA for the segment dropped 56.9% to $10.9 million from $25.3 million in the year-ago period. The decrease was primarily attributable to a lower gross margin, as noted above, and was partially offset by reduced SG&A expenses. Consequently, the adjusted EBITDA margin declined 550 basis points year over year to 5.5%.
Net sales in the International segment totaled $186.3 million, beating our estimate of $180.4 million and marking a year-over-year increase of 2.3%, benefiting from foreign currency tailwinds. However, organic net sales slipped 2.7% due to softness in baby and kids.
Adjusted gross profit decreased 7.8% to $33.7 million. The adjusted gross margin contracted 200 basis points to 18.1%. The margin contraction was primarily driven by cost inflation, unfavorable fixed-cost absorption, and lower volume and mix, partially offset by productivity savings and pricing.
Adjusted EBITDA declined 15.7% to $19 million from $22.5 million in the prior-year quarter, primarily reflecting the lower gross margin noted above. The adjusted EBITDA margin fell 220 basis points to 10.2%.
In the Snacks category, organic net sales plunged 19.9% year over year due to distribution losses and velocity challenges in North America.
Organic net sales in Baby & Kids fell 14.2%, reflecting industry-wide softness in purees in the U.K. and formula in North America.
Beverages were a relative bright spot, with organic net sales rising 2.6%, driven by growth in tea in North America.
For Meal Prep, organic net sales edged down 0.9%, as strength in yogurt in North America was mostly offset by weakness in spreads and drizzles in the U.K.
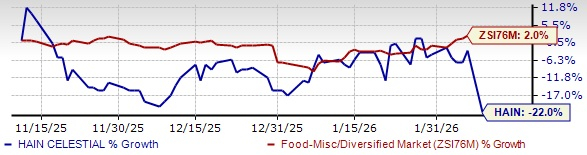
HAIN Stock Past 3-Month Performance
The company closed the quarter with cash and cash equivalents of $68 million, long-term debt (excluding the current portion) of $0.4 million, and total shareholders’ equity of $330.2 million.
Net cash provided by operating activities was $37 million for the quarter compared with $30.9 million in the prior-year period.
The free cash flow for the quarter was an inflow of $30 million compared with an inflow of $24.5 million in the prior-year period.
Capital expenditure (CapEx) totaled $7 million for the quarter compared with $6.4 million in the prior-year period. The company expects capital expenditure in the low $20-million range for fiscal 2026.
The company is not providing numeric guidance for fiscal 2026 operating results at this time due to uncertainty regarding the timing of completion of the strategic review. The company intends to provide pro-forma financial information upon the closing of the North American Snacks divestiture, which is expected in February.
The company expects the divestiture of North American Snacks to be gross margin and EBITDA-accretive. Following the divestiture, the go-forward North American portfolio is expected to generate a gross margin above 30% and an EBITDA margin in the low-double digits.
For fiscal 2026, the company expects strong cost management and productivity, supported by execution against its five actions to win in the marketplace. These efforts are expected to drive stronger top and bottom-line performances in the second half of the year than in the first half. For the full fiscal year, the company continues to expect positive free cash flow.
The company remains focused on strengthening its financial position through initiatives designed to stabilize sales, improve profitability, optimize cash flow and reduce debt. The strategic review and the agreement to divest the North American Snacks business represent important steps in this process, and the company continues to advance additional actions.
With solid liquidity, strong cash generation in the quarter and positive free cash flow expected in fiscal 2026, the company remains confident in its ability to deliver improved performance in the second half of the year and beyond.
Shares of this Zacks Rank #3 (Hold) company have lost 22% in the past three months against the industry’s 2% growth.
We have highlighted three better-ranked stocks, namely Mama's Creations Inc. MAMA, Hershey Company HSY and Medifast MED.
Mama's Creations is a marketer and manufacturer of fresh deli prepared foods, which serves grocery, mass, club and convenience stores. It currently sports a Zacks Rank #1 (Strong Buy). You can see the complete list of today’s Zacks #1 Rank stocks here.
MAMA delivered a trailing four-quarter earnings surprise of 133.3%, on average. The consensus estimate for Mama's Creations’ current fiscal-year sales and earnings indicates growth of 39.9% and 44.4%, respectively, from the year-ago period’s reported figures.
Hershey manufactures pantry items like baking ingredients, toppings and beverages; gum and mint refreshment products; and snack bites and mixes, as well as spreads. It currently sports a Zacks Rank of 1.
The Zacks Consensus Estimate for Hershey’s current financial-year earnings and revenues implies growth of 13.3% and 4.1%, respectively, from the year-ago actuals. HSY delivered a trailing four-quarter average earnings surprise of 17.2%.
Medifast is a leading manufacturer and distributor of clinically-proven healthy living products and programs. It has a Zacks Rank of 2 (Buy) at present.
The Zacks Consensus Estimate for Medifast’s current financial-year earnings and revenues implies declines of 156.5% and 36.7%, respectively, from the year-ago actuals. MED delivered a negative trailing four-quarter average earnings surprise of 640%.
Want the latest recommendations from Zacks Investment Research? Today, you can download 7 Best Stocks for the Next 30 Days. Click to get this free report
This article originally published on Zacks Investment Research (zacks.com).
| 5 hours | |
| Jul-15 | |
| Jul-11 | |
| Jul-10 | |
| Jul-09 | |
| Jul-08 | |
| Jul-08 | |
| Jul-08 | |
| Jul-08 | |
| Jun-29 | |
| Jun-29 | |
| Jun-29 | |
| Jun-29 | |
| Jun-25 | |
| Jun-24 |
Join thousands of traders who make more informed decisions with our premium features. Real-time quotes, advanced visualizations, alerts, and much more.
Learn more about Finviz Elite