|
|
|

|
|||||
|
|
|

Global entertainment and media company Warner Bros. Discovery (NASDAQ:WBD) reported Q4 CY2025 results topping the market’s revenue expectations, but sales fell by 5.7% year on year to $9.46 billion. Its GAAP loss of $0.10 per share was significantly below analysts’ consensus estimates.
Is now the time to buy Warner Bros. Discovery? Find out by accessing our full research report, it’s free.
Formed from the merger of WarnerMedia and Discovery, Warner Bros. Discovery (NASDAQ:WBD) is a multinational media and entertainment company, offering television networks, streaming services, and film and television production.
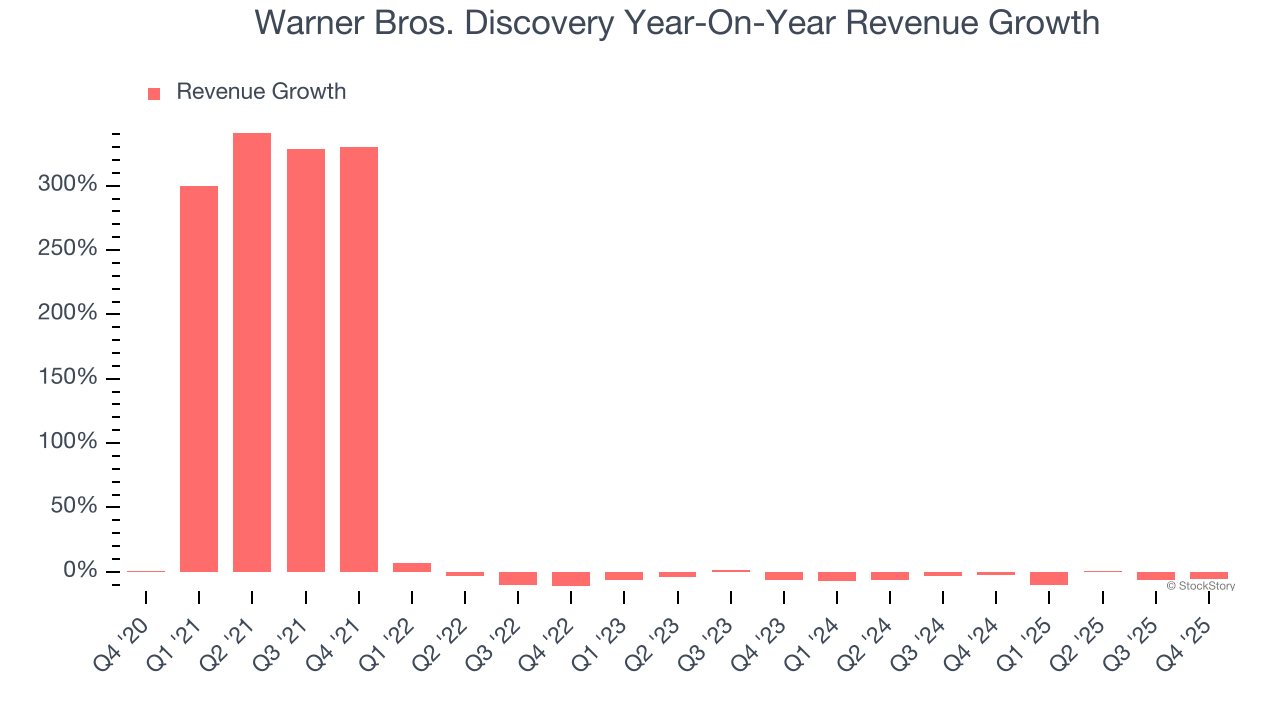
A company’s long-term sales performance is one signal of its overall quality. Even a bad business can shine for one or two quarters, but a top-tier one grows for years. Over the last five years, Warner Bros. Discovery grew its sales at a 28.4% annual rate. Though this growth is acceptable on an absolute basis, we need to see more than just topline growth for the consumer discretionary sector, which can display significant earnings volatility. This means our bar for the sector is particularly high, reflecting the non-essential and hit-driven nature of the products and services offered. Additionally, five-year CAGR starts around Covid, when revenue was depressed then rebounded.
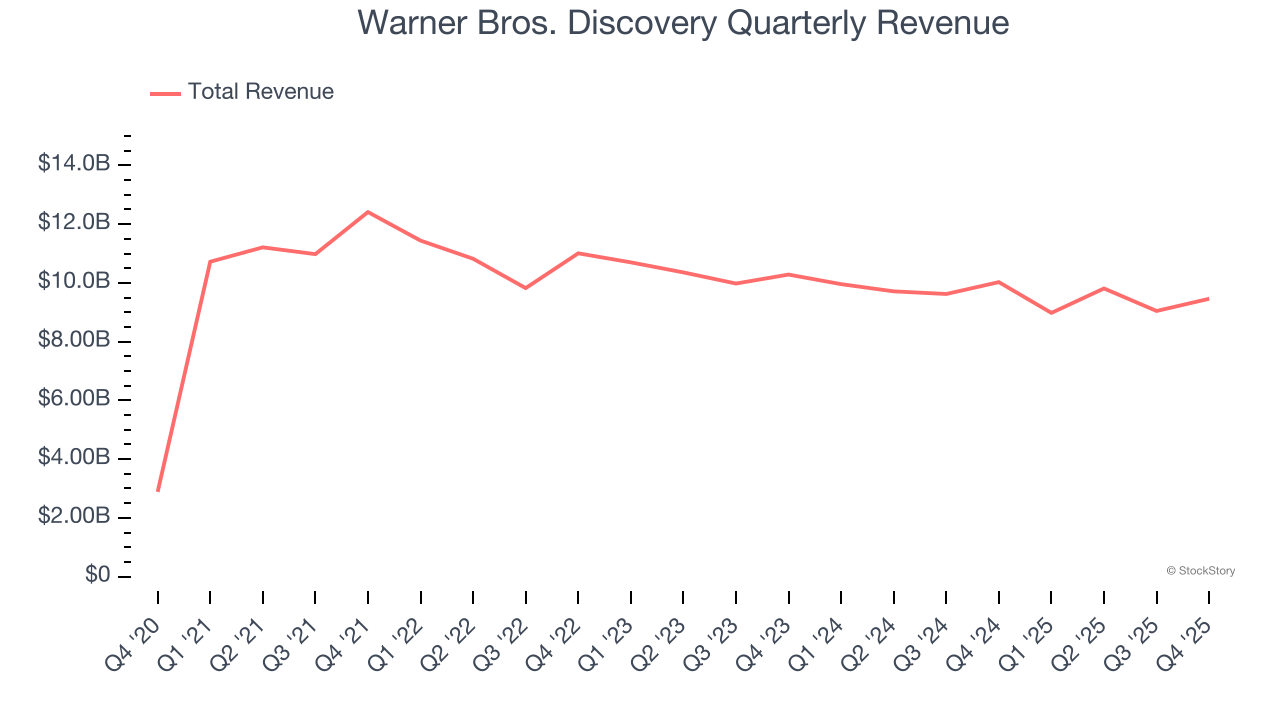
We at StockStory place the most emphasis on long-term growth, but within consumer discretionary, a stretched historical view may miss a company riding a successful new product or trend. Warner Bros. Discovery’s performance shows it grew in the past but relinquished its gains over the last two years, as its revenue fell by 5% annually.
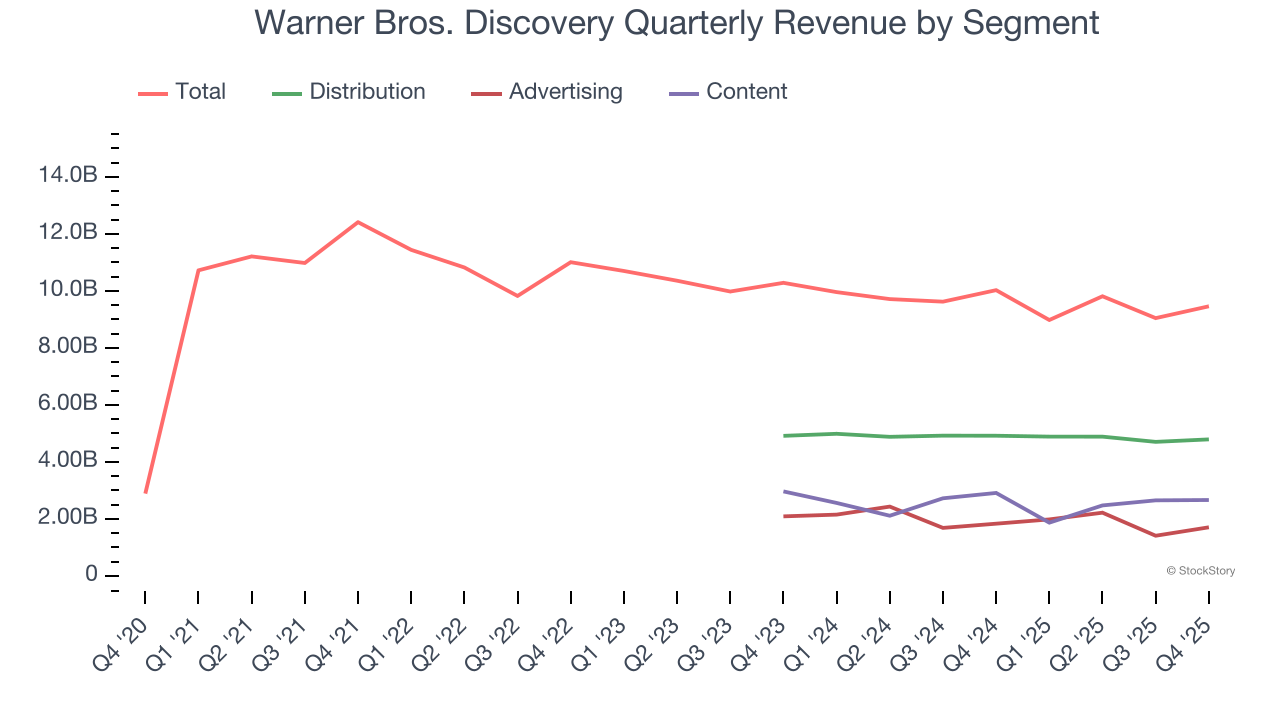
Warner Bros. Discovery also breaks out the revenue for its three most important segments: Distribution, Advertising, and Content, which are 50.6%, 18%, and 28.1% of revenue. Over the last two years, Warner Bros. Discovery’s revenues in all three segments declined. Its Distribution revenue (licensing fees) averaged year-on-year decreases of 1.8% while its Advertising (marketing services) and Content (films, streaming, games) revenues averaged drops of 10.4% and 4.6%.
This quarter, Warner Bros. Discovery’s revenue fell by 5.7% year on year to $9.46 billion but beat Wall Street’s estimates by 0.8%.
Looking ahead, sell-side analysts expect revenue to remain flat over the next 12 months. While this projection implies its newer products and services will spur better top-line performance, it is still below average for the sector.
While Wall Street chases Nvidia at all-time highs, an under-the-radar semiconductor supplier is dominating a critical AI component these giants can’t build without. Click here to access our free report one of our favorites growth stories.
Operating margin is a key measure of profitability. Think of it as net income - the bottom line - excluding the impact of taxes and interest on debt, which are less connected to business fundamentals.
Warner Bros. Discovery’s operating margin has risen over the last 12 months, but it still averaged negative 12.1% over the last two years. This is due to its large expense base and inefficient cost structure.
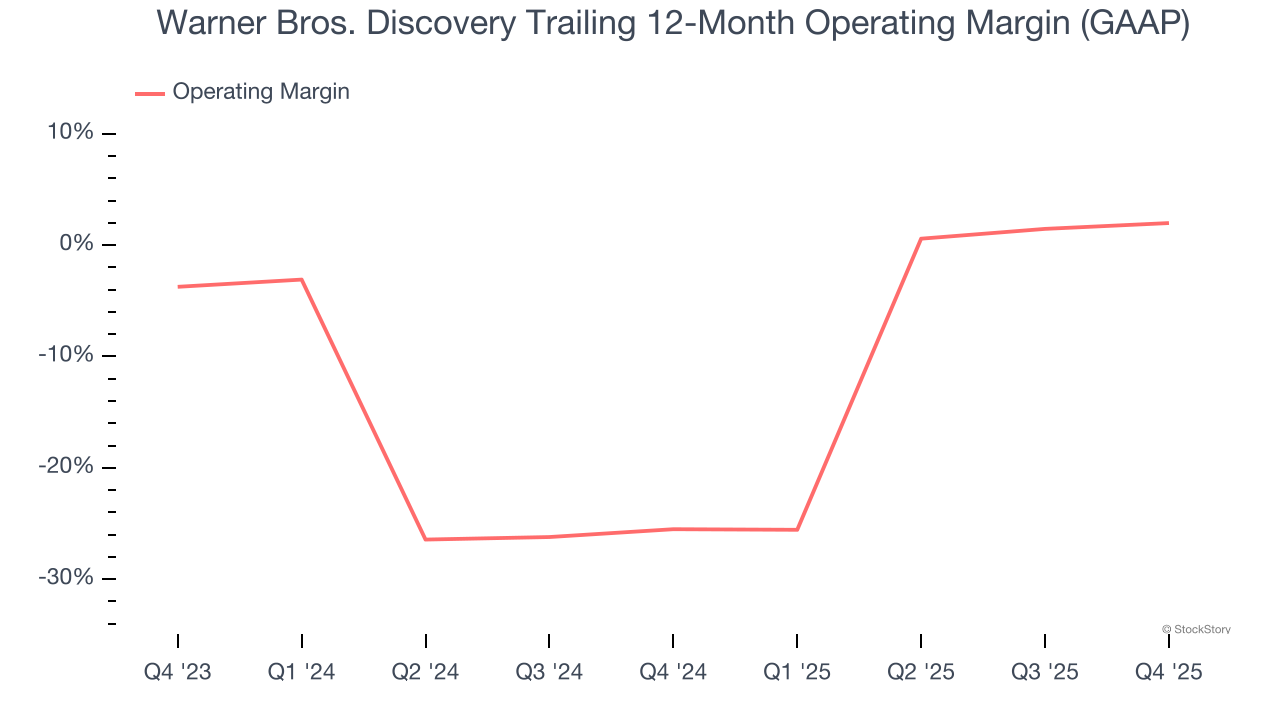
In Q4, Warner Bros. Discovery generated an operating margin profit margin of 3.7%, up 2.1 percentage points year on year. This increase was a welcome development, especially since its revenue fell, showing it was more efficient because it scaled down its expenses.
Revenue trends explain a company’s historical growth, but the long-term change in earnings per share (EPS) points to the profitability of that growth – for example, a company could inflate its sales through excessive spending on advertising and promotions.
Sadly for Warner Bros. Discovery, its EPS declined by 30.7% annually over the last five years while its revenue grew by 28.4%. This tells us the company became less profitable on a per-share basis as it expanded.
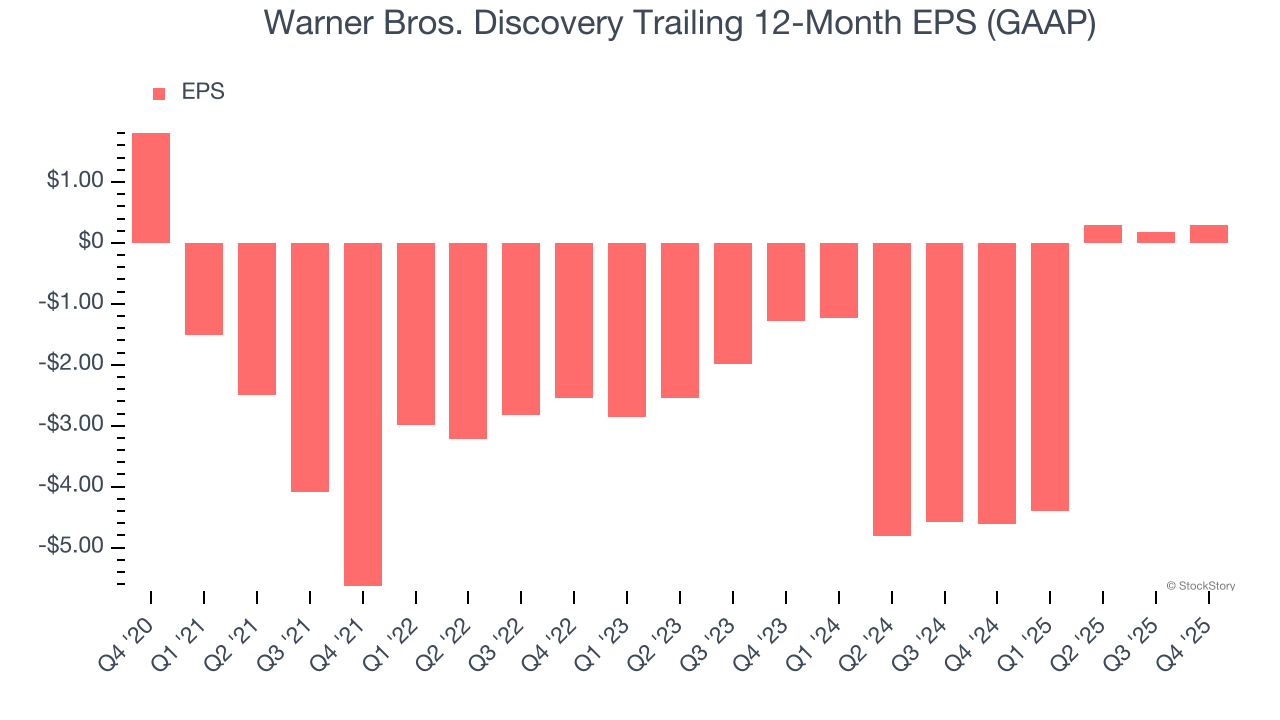
In Q4, Warner Bros. Discovery reported EPS of negative $0.10, up from negative $0.20 in the same quarter last year. Despite growing year on year, this print missed analysts’ estimates. Over the next 12 months, Wall Street expects Warner Bros. Discovery to perform poorly. Analysts forecast its full-year EPS of $0.29 will invert to negative negative $0.16.
It was encouraging to see Warner Bros. Discovery beat analysts’ EBITDA expectations this quarter. We were also happy its revenue narrowly outperformed Wall Street’s estimates. On the other hand, its EPS missed. Overall, this quarter could have been better. The stock remained flat at $28.92 immediately following the results.
Is Warner Bros. Discovery an attractive investment opportunity at the current price? We think that the latest quarter is only one piece of the longer-term business quality puzzle. Quality, when combined with valuation, can help determine if the stock is a buy. We cover that in our actionable full research report which you can read here (it’s free).
| 10 min | |
| 54 min | |
| 1 hour | |
| 1 hour | |
| 1 hour | |
| 1 hour | |
| 2 hours | |
| 2 hours | |
| 3 hours | |
| 3 hours | |
| 3 hours | |
| 4 hours |
Warner Bros. Discovery Revenue Declines as Netflix, Paramount Vie for Deal
WBD
The Wall Street Journal
|
| 4 hours |
Warner Bros. Discovery Revenue Decline as Netflix, Paramount Vie for Deal
WBD
The Wall Street Journal
|
| 4 hours | |
| 4 hours |
Join thousands of traders who make more informed decisions with our premium features. Real-time quotes, advanced visualizations, backtesting, and much more.
Learn more about FINVIZ*Elite