|
|
|

|
|||||
|
|
|
New Feature: See Wall Street analyst ratings directly on Finviz charts for deeper context into price action.

Affordable single-family home construction company LGI Homes (NASDAQ:LGIH) fell short of the market’s revenue expectations in Q1 CY2025, with sales falling 10.1% year on year to $351.4 million. Its GAAP profit of $0.17 per share was 73.1% below analysts’ consensus estimates.
Is now the time to buy LGI Homes? Find out by accessing our full research report, it’s free.
“During the quarter, we continued to see strong demand for new homes,” said Eric Lipar, Chairman and Chief Executive Officer of LGI Homes.
Based in Texas, LGI Homes (NASDAQ:LGIH) is a homebuilding company specializing in constructing affordable, entry-level single-family homes in desirable communities across the United States.
A company’s long-term sales performance is one signal of its overall quality. Any business can put up a good quarter or two, but the best consistently grow over the long haul. Regrettably, LGI Homes’s sales grew at a sluggish 1.5% compounded annual growth rate over the last five years. This was below our standards and is a poor baseline for our analysis.
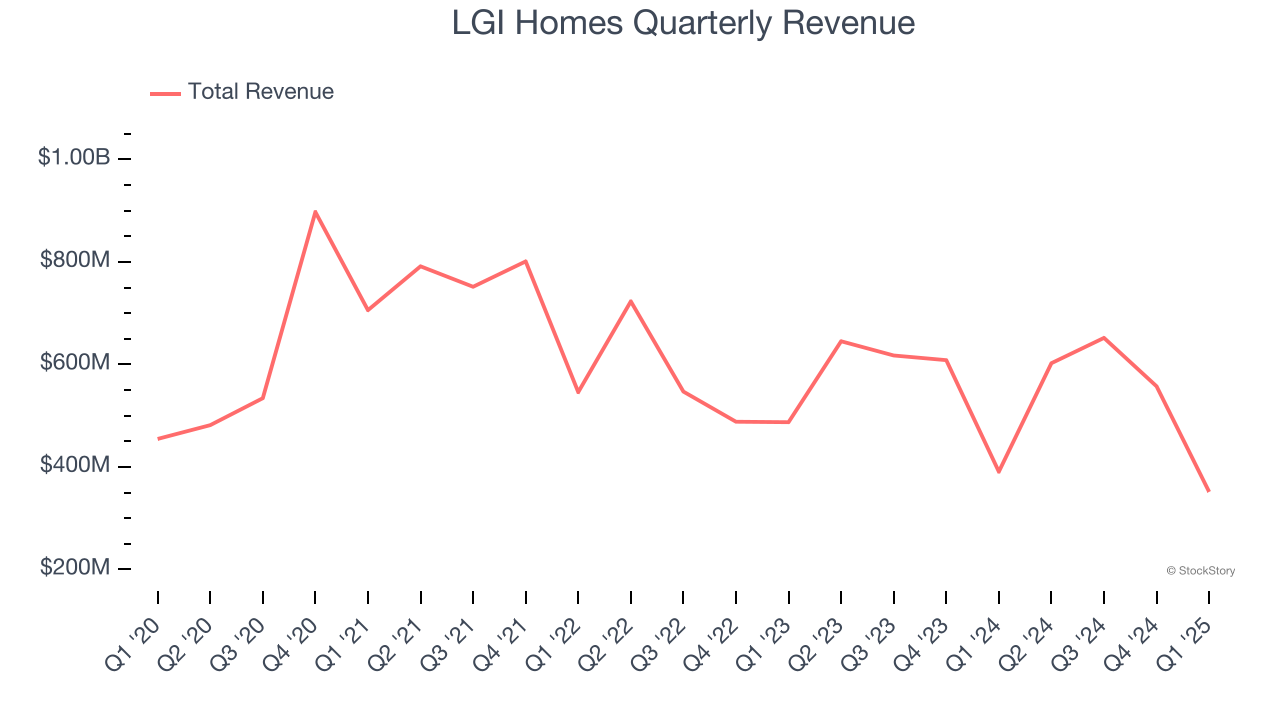
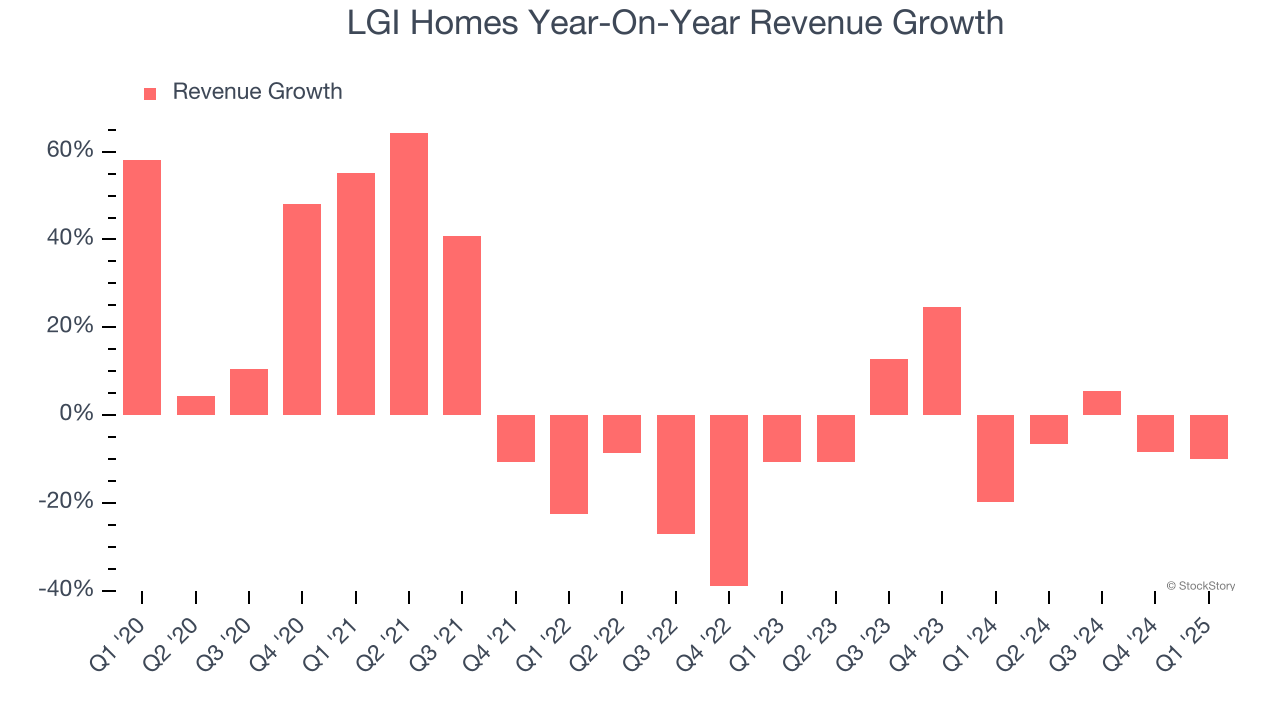
Long-term growth is the most important, but within industrials, a half-decade historical view may miss new industry trends or demand cycles. LGI Homes’s performance shows it grew in the past but relinquished its gains over the last two years, as its revenue fell by 1.9% annually.
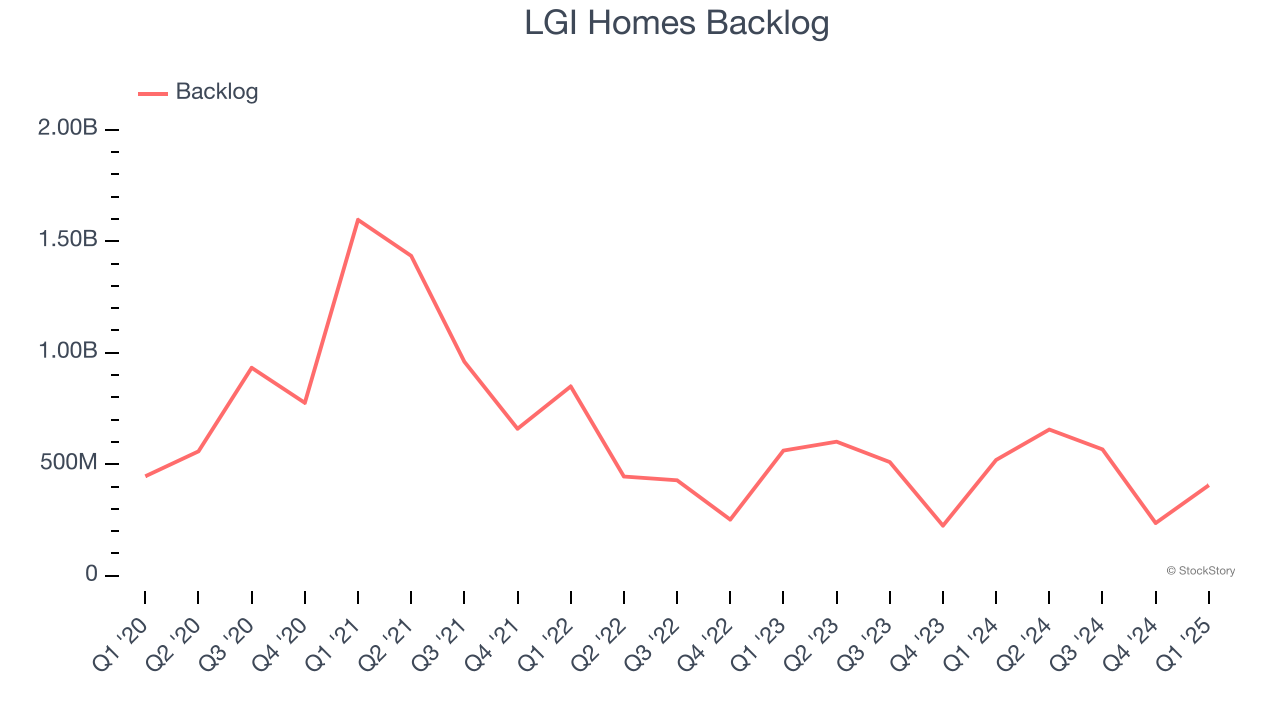
LGI Homes also reports its backlog, or the value of its outstanding orders that have not yet been executed or delivered. LGI Homes’s backlog reached $406.2 million in the latest quarter and averaged 4.9% year-on-year growth over the last two years. Because this number is better than its revenue growth, we can see the company accumulated more orders than it could fulfill and deferred revenue to the future. This could imply elevated demand for LGI Homes’s products and services but raises concerns about capacity constraints.
This quarter, LGI Homes missed Wall Street’s estimates and reported a rather uninspiring 10.1% year-on-year revenue decline, generating $351.4 million of revenue.
Looking ahead, sell-side analysts expect revenue to grow 10.9% over the next 12 months, an improvement versus the last two years. This projection is commendable and suggests its newer products and services will catalyze better top-line performance.
Here at StockStory, we certainly understand the potential of thematic investing. Diverse winners from Microsoft (MSFT) to Alphabet (GOOG), Coca-Cola (KO) to Monster Beverage (MNST) could all have been identified as promising growth stories with a megatrend driving the growth. So, in that spirit, we’ve identified a relatively under-the-radar profitable growth stock benefiting from the rise of AI, available to you FREE via this link.
Operating margin is one of the best measures of profitability because it tells us how much money a company takes home after procuring and manufacturing its products, marketing and selling those products, and most importantly, keeping them relevant through research and development.
LGI Homes has been an efficient company over the last five years. It was one of the more profitable businesses in the industrials sector, boasting an average operating margin of 13.9%. This result was particularly impressive because of its low gross margin, which is mostly a factor of what it sells and takes huge shifts to move meaningfully. Companies have more control over their operating margins, and it’s a show of well-managed operations if they’re high when gross margins are low.
Looking at the trend in its profitability, LGI Homes’s operating margin decreased by 7.6 percentage points over the last five years. This raises questions about the company’s expense base because its revenue growth should have given it leverage on its fixed costs, resulting in better economies of scale and profitability.
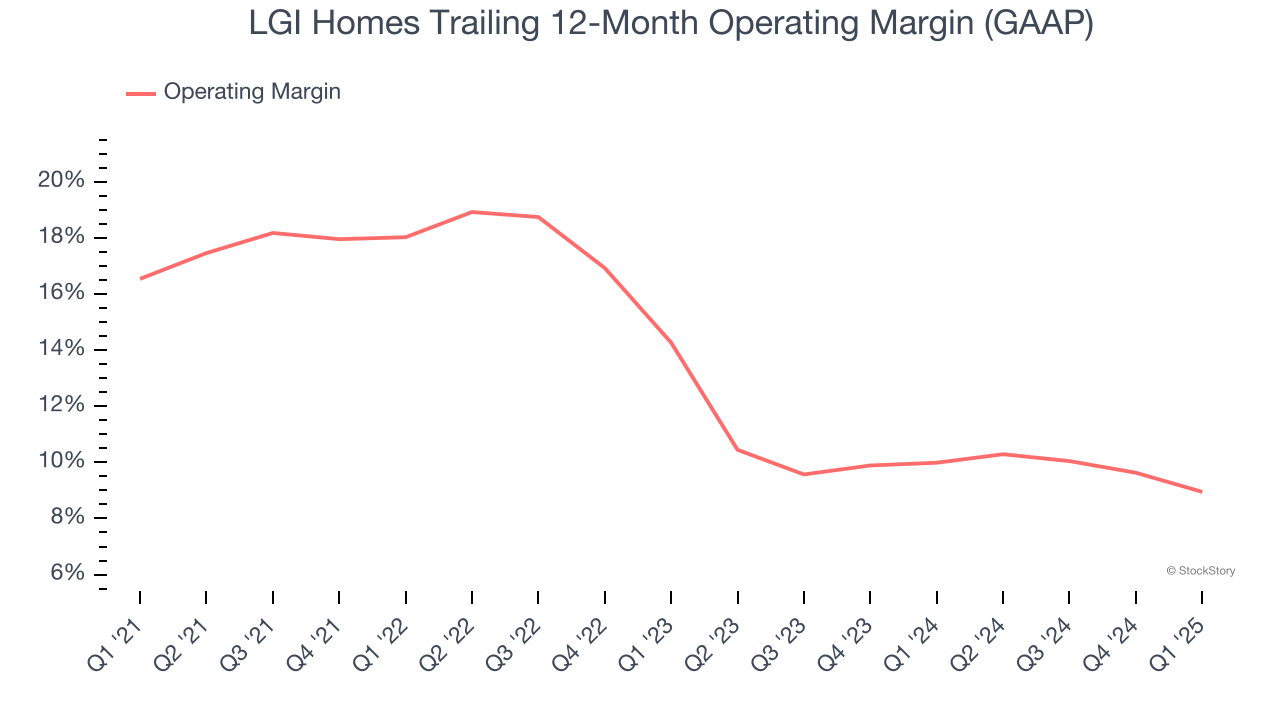
This quarter, LGI Homes’s breakeven margin was down 4.7 percentage points year on year. Since LGI Homes’s operating margin decreased more than its gross margin, we can assume it was less efficient because expenses such as marketing, R&D, and administrative overhead increased.
Revenue trends explain a company’s historical growth, but the long-term change in earnings per share (EPS) points to the profitability of that growth – for example, a company could inflate its sales through excessive spending on advertising and promotions.
LGI Homes’s flat EPS over the last five years was below its 1.5% annualized revenue growth. This tells us the company became less profitable on a per-share basis as it expanded due to non-fundamental factors such as interest expenses and taxes.
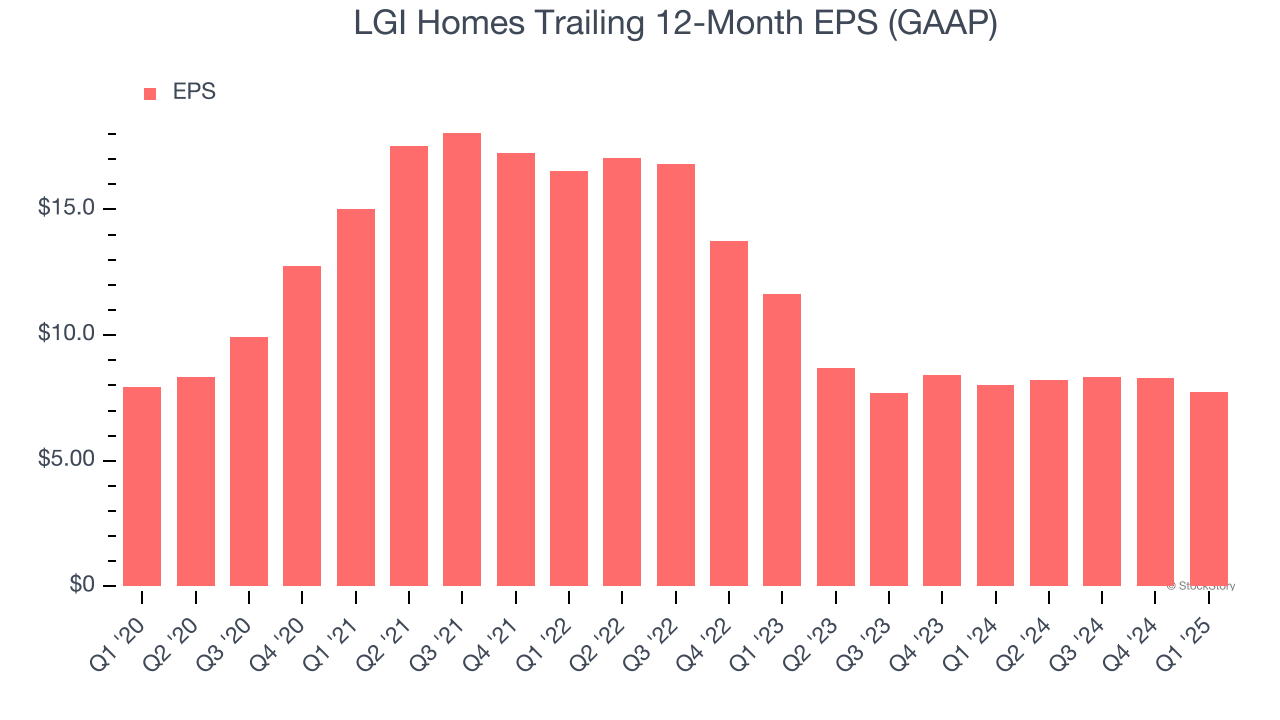
Diving into the nuances of LGI Homes’s earnings can give us a better understanding of its performance. As we mentioned earlier, LGI Homes’s operating margin declined by 7.6 percentage points over the last five years. This was the most relevant factor (aside from the revenue impact) behind its lower earnings; taxes and interest expenses can also affect EPS but don’t tell us as much about a company’s fundamentals.
Like with revenue, we analyze EPS over a more recent period because it can provide insight into an emerging theme or development for the business.
For LGI Homes, its two-year annual EPS declines of 18.4% show its recent history was to blame for its underperformance over the last five years. These results were bad no matter how you slice the data.
In Q1, LGI Homes reported EPS at $0.17, down from $0.72 in the same quarter last year. This print missed analysts’ estimates. Over the next 12 months, Wall Street expects LGI Homes’s full-year EPS of $7.76 to stay about the same.
We struggled to find many positives in these results. Its revenue missed significantly and its EPS fell short of Wall Street’s estimates. Overall, this was a softer quarter. The stock traded down 1.6% to $58.26 immediately following the results.
LGI Homes’s earnings report left more to be desired. Let’s look forward to see if this quarter has created an opportunity to buy the stock. When making that decision, it’s important to consider its valuation, business qualities, as well as what has happened in the latest quarter. We cover that in our actionable full research report which you can read here, it’s free.
| Feb-18 | |
| Feb-17 | |
| Feb-17 | |
| Feb-17 | |
| Feb-17 | |
| Feb-17 | |
| Feb-17 | |
| Feb-17 | |
| Feb-15 | |
| Feb-11 | |
| Feb-07 | |
| Feb-04 | |
| Jan-31 | |
| Jan-30 | |
| Jan-27 |
Join thousands of traders who make more informed decisions with our premium features. Real-time quotes, advanced visualizations, backtesting, and much more.
Learn more about FINVIZ*Elite