|
|
|

|
|||||
|
|
|

Freight delivery company XPO (NYSE:XPO) missed Wall Street’s revenue expectations in Q1 CY2025, with sales falling 3.2% year on year to $1.95 billion. Its non-GAAP profit of $0.73 per share was 12% above analysts’ consensus estimates.
Is now the time to buy XPO? Find out by accessing our full research report, it’s free.
Mario Harik, CEO of XPO, said, “We carried our momentum into 2025 and delivered first quarter financial results that outperformed the industry. Companywide, we reported adjusted EBITDA of $278 million and adjusted diluted EPS of $0.73, while operating more efficiently."
Owning a mobile game simulating freight operations for the Tour de France, XPO (NYSE:XPO) is a transportation company specializing in expedited shipping services.
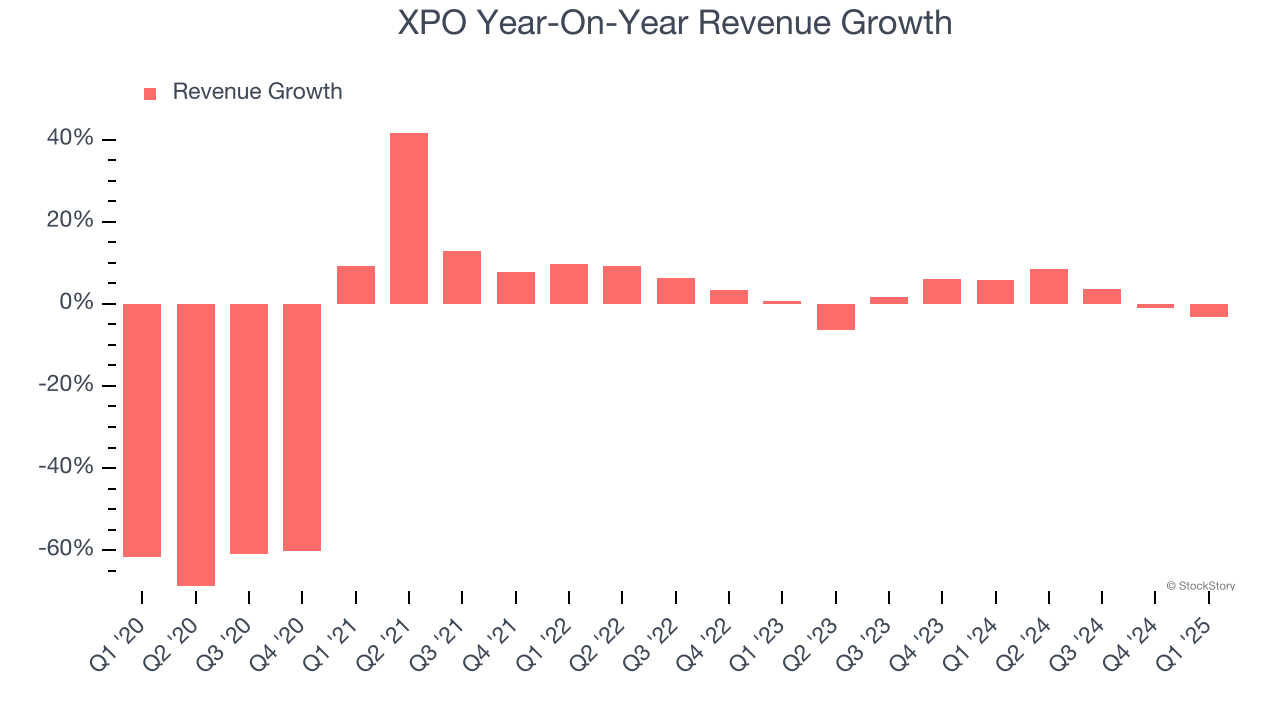
Examining a company’s long-term performance can provide clues about its quality. Any business can experience short-term success, but top-performing ones enjoy sustained growth for years. XPO’s demand was weak over the last five years as its sales fell at a 10.7% annual rate. This was below our standards and suggests it’s a low quality business.
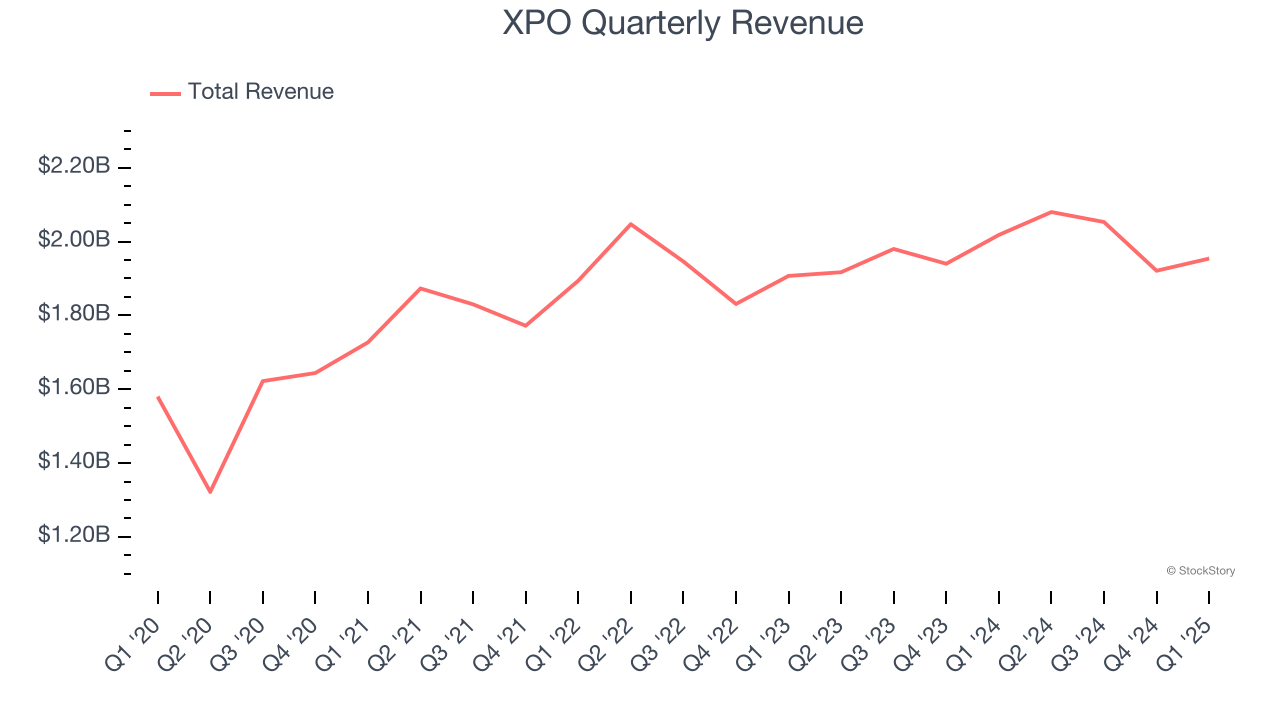
Long-term growth is the most important, but within industrials, a half-decade historical view may miss new industry trends or demand cycles. XPO’s annualized revenue growth of 1.8% over the last two years is above its five-year trend, but we were still disappointed by the results. We also note many other Ground Transportation businesses have faced declining sales because of cyclical headwinds. While XPO grew slower than we’d like, it did do better than its peers.
We can dig further into the company’s revenue dynamics by analyzing its most important segments, North American Less-Than-Truckload and European Transportation , which are 60% and 40% of revenue. Over the last two years, XPO’s North American Less-Than-Truckload revenue (freight services) averaged 2.3% year-on-year growth while its European Transportation revenue (truckload, less-than-truckload, and truck brokerage) averaged 1.4% growth.
This quarter, XPO missed Wall Street’s estimates and reported a rather uninspiring 3.2% year-on-year revenue decline, generating $1.95 billion of revenue.
Looking ahead, sell-side analysts expect revenue to grow 3.2% over the next 12 months, similar to its two-year rate. While this projection suggests its newer products and services will fuel better top-line performance, it is still below average for the sector.
Unless you’ve been living under a rock, it should be obvious by now that generative AI is going to have a huge impact on how large corporations do business. While Nvidia and AMD are trading close to all-time highs, we prefer a lesser-known (but still profitable) stock benefiting from the rise of AI. Click here to access our free report one of our favorites growth stories.
Operating margin is one of the best measures of profitability because it tells us how much money a company takes home after procuring and manufacturing its products, marketing and selling those products, and most importantly, keeping them relevant through research and development.
XPO was profitable over the last five years but held back by its large cost base. Its average operating margin of 5.4% was weak for an industrials business. This result isn’t too surprising given its low gross margin as a starting point.
On the plus side, XPO’s operating margin rose by 6.3 percentage points over the last five years.
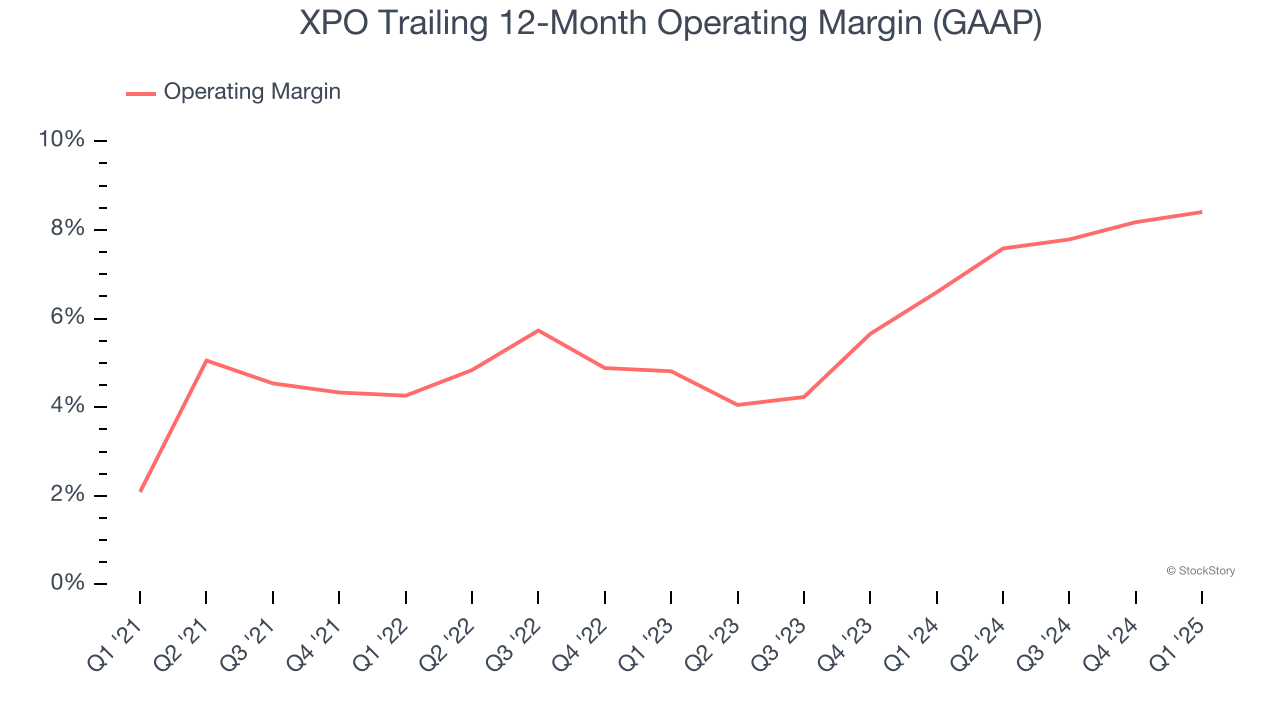
This quarter, XPO generated an operating profit margin of 7.7%, in line with the same quarter last year. This indicates the company’s cost structure has recently been stable.
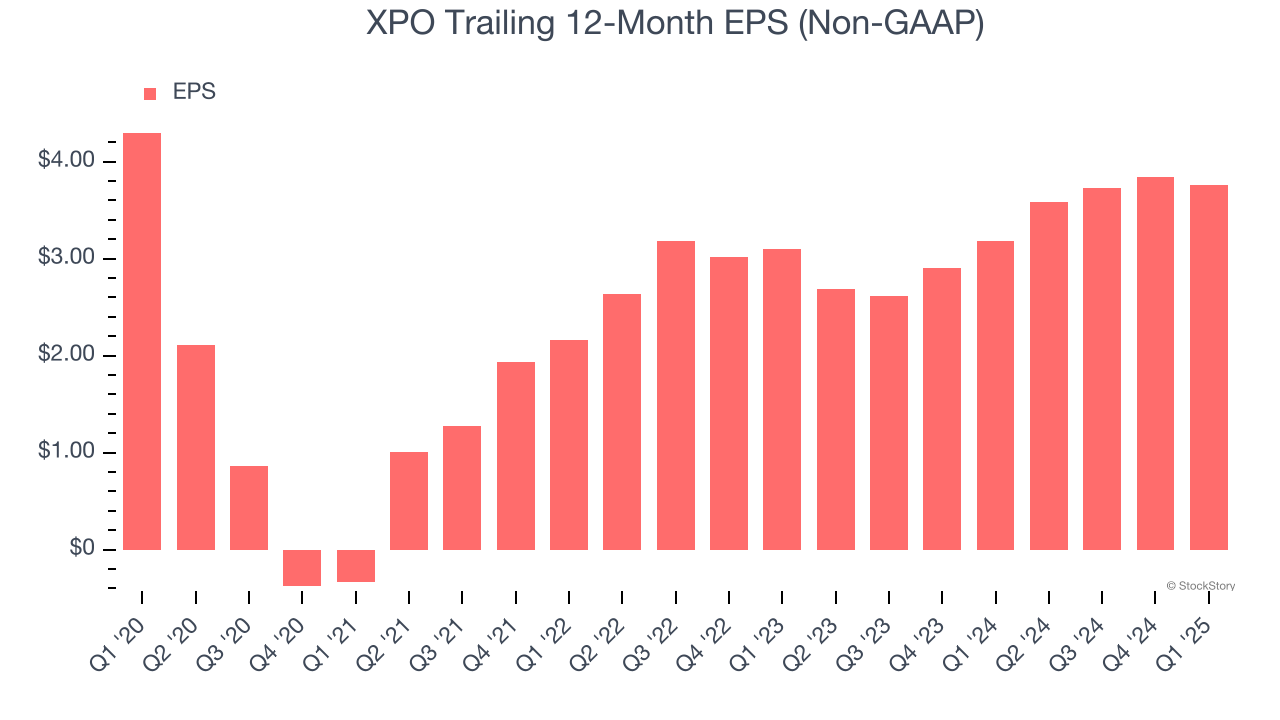
We track the long-term change in earnings per share (EPS) for the same reason as long-term revenue growth. Compared to revenue, however, EPS highlights whether a company’s growth is profitable.
Sadly for XPO, its EPS and revenue declined by 2.6% and 10.7% annually over the last five years. We tend to steer our readers away from companies with falling revenue and EPS, where diminishing earnings could imply changing secular trends and preferences. If the tide turns unexpectedly, XPO’s low margin of safety could leave its stock price susceptible to large downswings.
Like with revenue, we analyze EPS over a shorter period to see if we are missing a change in the business.
For XPO, its two-year annual EPS growth of 10.2% was higher than its five-year trend. This acceleration made it one of the faster-growing industrials companies in recent history.
In Q1, XPO reported EPS at $0.73, down from $0.81 in the same quarter last year. Despite falling year on year, this print easily cleared analysts’ estimates. Over the next 12 months, Wall Street expects XPO’s full-year EPS of $3.76 to grow 8.5%.
It was encouraging to see XPO beat analysts’ EPS and EBITDA expectations this quarter. On the other hand, its revenue slightly missed due to underperformance in its North American Less-Than-Truckload segment. Zooming out, we think this was a decent quarter featuring some areas of strength but also some blemishes. The stock traded up 6.7% to $104 immediately following the results.
Big picture, is XPO a buy here and now? We think that the latest quarter is only one piece of the longer-term business quality puzzle. Quality, when combined with valuation, can help determine if the stock is a buy. We cover that in our actionable full research report which you can read here, it’s free.
| Feb-24 | |
| Feb-24 | |
| Feb-14 | |
| Feb-13 | |
| Feb-12 | |
| Feb-12 | |
| Feb-12 | |
| Feb-12 | |
| Feb-11 | |
| Feb-10 | |
| Feb-08 | |
| Feb-07 | |
| Feb-06 | |
| Feb-05 | |
| Feb-05 |
Join thousands of traders who make more informed decisions with our premium features. Real-time quotes, advanced visualizations, backtesting, and much more.
Learn more about FINVIZ*Elite