|
|
|

|
|||||
|
|
|
Signet Jewelers Limited SIG posted impressive first-quarter fiscal 2026 results, wherein the top and bottom lines surpassed the Zacks Consensus Estimate. Also, both revenues and earnings increased year over year. Same-store sales increased 2.5% from the year-ago period. Driven by the fiscal first-quarter results, Signet has raised its fiscal 2026 outlook. In response to these factors, shares of the company gained 12.5% yesterday.
SIG reported adjusted earnings of $1.18 per share, surpassing the Zacks Consensus Estimate of $1.01. Also, the bottom line increased 6.3% from adjusted earnings of $1.11 per share in the year-ago period. (Find the latest EPS estimates and surprises on Zacks Earnings Calendar.)
This jewelry retailer generated total sales of $1,541.6 million, beating the consensus estimate of $1,516 million. Also, the top line increased 2% year over year. The metric also increased 2% at constant currency. Merchandise average unit retail (AUR) rose approximately 8% year over year.

Signet Jewelers Limited price-consensus-eps-surprise-chart | Signet Jewelers Limited Quote
The gross profit in the fiscal first quarter amounted to $598.8 million, up 4.6% from $572.4 million in the year-ago quarter. The gross margin increased 100 basis points (bps) year over year to 38.8% in the quarter under review, primarily due to higher merchandise margins and better leverage of fixed costs.
Selling, general and administrative (SG&A) expenses were $526 million, up 2.1% from the prior-year quarter. Meanwhile, SG&A expenses, as a percentage of sales, were 34.1%, which remained flat year over year.
SIG reported adjusted operating income of $70.3 million, up 21.6% from $57.8 million in the year-ago quarter. We note that the adjusted operating margin increased 80 bps to 4.6%.
Sales in the North American segment increased 2.1% year over year to $1.45 billion, which beat the Zacks Consensus Estimate of $1.43 billion. Same-store sales increased 2.3% year over year.
Sales in the International segment increased 3.8% year over year to $80.1 million, surpassing the consensus estimate of $75.9 million. Same-store sales jumped 4.5% year over year. Sales increased 1.5% on a constant-currency basis.
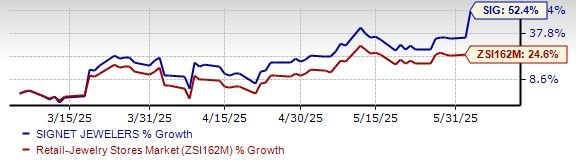
SIG Stock Past Three-Month Performance
As of May 3, 2025, the North American segment had 2,371 stores, a decrease from 2,379 in February 2025 due to five openings and 13 closures. The International segment had 262 stores, down from 263 after one closure and no openings. Overall, Signet had 2,633 stores, down from 2,642, following five openings and 14 closures.
SIG ended the fiscal first quarter with cash and cash equivalents of $264.1 million and inventories of $2.01 billion. Total shareholders’ equity was $1.78 billion at the end of the fiscal first quarter.
As of May 3, 2025, net cash used was $175.3 million in operating activities.
In the first quarter, Signet repurchased approximately 2.1 million common shares for $117.4 million. Following the quarter’s end, the company repurchased an additional 235 thousand shares for $15 million through June 2, 2025. Nearly $600 million remains available under the current share repurchase authorization.
For the second quarter of fiscal 2026, Signet expects total sales to be in the range of $1.47-$1.51 billion. Same-store sales are projected to be between a decline of 1.5% and an increase of 1% year over year.
The company expects the gross margin rate to be flat to up modestly, driven by continued merchandise margin expansion and modest deleverage in SG&A expenses.
Adjusted operating income is anticipated to be between $53 million and $73 million, while adjusted EBITDA is expected in the range of $99-$119 million.
Signet has updated its fiscal 2026 guidance. Total sales are now expected in the range of $6.57-$6.80 billion, up from the previous range of $6.53-$6.80 billion. Same-store sales are projected between a decline of 2% and an increase of 1.5% compared with the prior range of decline of 2.5% and an increase of 1.5%.
Adjusted operating income is now anticipated to be between $430 million and $510 million, up from $420-$510 million expected previously. Adjusted EBITDA is forecasted at $615-$695 million compared with the earlier range of $605-$695 million. Adjusted EPS is expected to be between $7.70 and $9.38, an increase from the prior guidance of $7.31-$9.10. The company continues to expect capital expenditures to be between $145 million and $160 million.
This Zacks Rank #3 (Hold) company’s shares have gained 52.4% in the past three months compared with the industry’s 24.6% growth.
Some better-ranked stocks are Urban Outfitters Inc. URBN, Canada Goose GOOS and Allbirds Inc. BIRD.
Urban Outfitters is a lifestyle specialty retailer that offers fashion apparel and accessories, footwear, home decor and gift products. It currently sports a Zacks Rank #1 (Strong Buy). You can see the complete list of today’s Zacks #1 Rank stocks here.
The Zacks Consensus Estimate for URBN’s fiscal 2025 earnings and sales implies growth of 20.9% and 8%, respectively, from the year-ago actuals. URBN delivered a trailing four-quarter average earnings surprise of 29%.
Canada Goose is a global outerwear brand. GOOS is a designer, manufacturer, distributor and retailer of premium outerwear for men, women and children. It carries a Zacks Rank #2 (Buy) at present.
The Zacks Consensus Estimate for Canada Goose’s current fiscal-year’s earnings and sales implies growth of 10% and 2.9%, respectively, from the year-ago actuals. Canada Goose delivered a trailing four-quarter average earnings surprise of 57.2%.
Allbirds is a lifestyle brand that uses naturally derived materials to make footwear and apparel products. It carries a Zacks Rank of 2 at present.
The Zacks Consensus Estimate for BIRD’s current financial-year’s earnings indicates growth of 16.1% from the year-ago actual. The company delivered a trailing four-quarter average earnings surprise of 21.3%.
Want the latest recommendations from Zacks Investment Research? Today, you can download 7 Best Stocks for the Next 30 Days. Click to get this free report
This article originally published on Zacks Investment Research (zacks.com).
| 8 hours | |
| 18 hours | |
| Apr-01 | |
| Apr-01 | |
| Mar-31 | |
| Mar-31 | |
| Mar-31 | |
| Mar-31 | |
| Mar-31 | |
| Mar-31 | |
| Mar-31 | |
| Mar-31 | |
| Mar-31 | |
| Mar-31 | |
| Mar-31 |
Join thousands of traders who make more informed decisions with our premium features. Real-time quotes, advanced visualizations, alerts, and much more.
Learn more about Finviz Elite