|
|
|

|
|||||
|
|
|
Newmont Corporation NEM and Kinross Gold Corporation KGC are two prominent players in the gold mining space with global operations and diversified portfolios. While gold prices have fallen from their April 2025 highs, they remain favorable. The yellow metal is gaining from safe-haven demand triggered by trade and geopolitical uncertainties, and is currently hovering above the $3,300 per ounce level.
The Trump administration's move to double steel and aluminum tariffs to 50% has led to increased tensions between the United States and its key trading partners. Escalating Russia-Ukraine tensions have also resulted in heightened geopolitical risks. Amid this backdrop, comparing these two major gold producers is particularly relevant for investors seeking exposure to the precious metals sector.
Gold prices have rallied roughly 28% this year, courtesy of aggressive trade policies, including sweeping new import tariffs announced by President Donald Trump, intensified global trade tensions and increased investor anxiety. Also, central banks worldwide have been accumulating gold reserves, led by risks arising from Trump’s policies. Prices of the yellow metal skyrocketed to a record high of $3,500 per ounce on April 22 amid President Trump's criticism of Federal Reserve Chair Jerome Powell and call for a reduction in interest rates. Increased purchases by central banks, hopes of interest rate cuts, and trade and geopolitical tensions are expected to support gold prices.
Let’s dive deep and closely compare the fundamentals of these two mining giants to determine which one is a better investment now.
Newmont continues to invest in growth projects in a calculated manner. The company is pursuing several projects, including Tanami Expansion 2 in Australia, the Ahafo North expansion in Ghana and Cadia Panel Caves in Australia. These projects should expand production capacity and extend mine life, driving revenues and profits.
The acquisition of Newcrest Mining Limited has also created an industry-leading portfolio with a multi-decade gold and copper production profile in the most favorable mining jurisdictions globally. The combination of Newmont and Newcrest is expected to deliver significant value for its shareholders and generate meaningful synergies. NEM has achieved $500 million in annual run-rate synergies, following the Newcrest buyout.
Newmont also remains committed to divesting non-core businesses as it shifts its strategic focus to Tier 1 assets. In March 2025, the company completed the divestment of three non-core assets — the Musselwhite and Eleonore operations in Canada and the Cripple Creek & Victor (CC&V) operation in Colorado. The sale of these three additional non-core assets resulted in total after-tax cash proceeds of $1.7 billion before closing adjustments. Furthermore, NEM completed its non-core divestiture program in April with the sale of its Akyem operation in Ghana and its Porcupine operation in Canada, generating total after-tax cash proceeds of roughly $850 million before closing adjustments. Total gross proceeds from disclosed divestitures are expected to reach $4.3 billion, including $3.8 billion from non-core divestitures and $527 million from the sale of other investments.
Newmont has a strong liquidity position and generates substantial cash flows, which allow it to fund its growth projects, meet short-term debt obligations and drive shareholder value. At the end of the first quarter of 2025, Newmont had liquidity of $8.8 billion, including cash and cash equivalents of around $4.7 billion. Its operating cash flow from continuing operations soared roughly 162% year over year to around $2 billion in the first quarter. NEM also generated a record free cash flow of $1.2 billion in the quarter.
NEM delivered $1 billion to its shareholders through dividends and share repurchases and reduced debt by $1 billion since the beginning of 2025. Its long-term debt-to-capitalization is around 20%. NEM offers a dividend yield of 1.8% at the current stock price. Its payout ratio is 24% (a ratio below 60% is a good indicator that the dividend will be sustainable). Backed by strong cash flows and sound financial health, the company's dividend is perceived as safe and reliable.
Kinross has a strong production profile and boasts a promising pipeline of exploration and development projects. Its key development projects and exploration programs, including Great Bear in Ontario and Round Mountain Phase X in Nevada, remain on track. These projects are expected to boost production and cash flow and deliver significant value. KGC also completed the commissioning of its Manh Choh project and commenced production during the third quarter of 2024, leading to a substantial increase in cash flow at the Fort Knox operation.
Tasiast and Paracatu, the company’s two biggest assets, remain the key contributors to cash flow generation and production. Tasiast remains the lowest-cost asset within its portfolio, with consistently strong performance. Tasiast achieved record annual production and cash flow in 2024 and is on track to meet its full-year 2025 guidance. Paracatu saw a strong start to the year, with first-quarter production rising on strong grades and improved mill recoveries.
KGC has a strong liquidity position and generates substantial cash flows, which allows it to finance its development projects, pay down debt and drive shareholder value. The company ended the first quarter with solid liquidity of roughly $2.3 billion. Kinross also generated record free cash flows of around $1.3 billion in 2024, driven by the strength in gold prices and strong operating margins. Free cash flow also more than doubled year over year to $370.8 million in the first quarter.
KGC repaid $800 million of debt during 2024 and the remaining $200 million of its term loan in the first quarter, reducing its net debt to around $540 million. Its long-term debt-to-capitalization is 14.4%. KGC also offers a dividend yield of 0.8% at the current stock price. It has a payout ratio of 14%, with a five-year annualized dividend growth rate of about -0.1%.
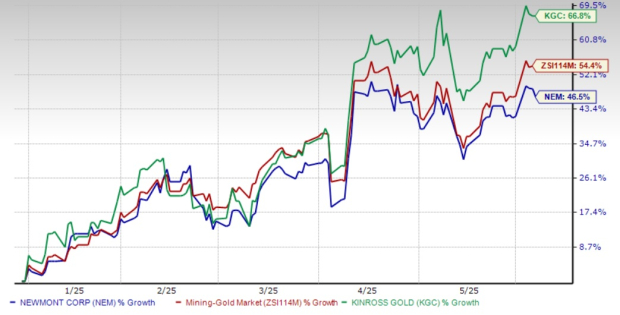
Year to date, NEM stock has risen 46.5%, while KGC stock has racked up a gain of 66.8% compared with the Zacks Mining – Gold industry’s increase of 54.4%.
NEM is currently trading at a forward 12-month earnings multiple of 12.59. This represents a roughly 10% discount when stacked up with the industry average of 14X.

Kinross is trading at a premium to Newmont. The KGC stock is currently trading at a forward 12-month earnings multiple of 13.37, lower than its industry.

The Zacks Consensus Estimate for NEM’s 2025 sales and EPS implies a year-over-year rise of 2% and 20.1%, respectively. The EPS estimates for 2025 have been trending higher over the past 60 days.
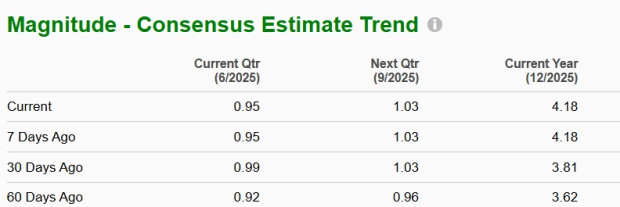
The consensus estimate for KGC’s 2025 sales and EPS implies year-over-year growth of 15.3% and 63.2%, respectively. The EPS estimates for 2025 have been trending northward over the past 60 days.

(Find the latest EPS estimates and surprises on Zacks Earnings Calendar.)
Both Newmont and Kinross are well-positioned to benefit from the favorable gold price environment, each demonstrating strong financial performance and commitment to shareholder returns. Both have a strong pipeline of development projects, solid financial health and are seeing favorable estimate revisions. Newmont appears to have an edge over Kinross due to its more attractive valuation and higher dividend yield. Investors seeking exposure to the gold space might consider Newmont as the more favorable option at this time.
NEM currently sports a Zacks Rank #1 (Strong Buy), whereas KGC has a Zacks Rank #2 (Buy). You can see the complete list of today’s Zacks #1 Rank stocks here.
Want the latest recommendations from Zacks Investment Research? Today, you can download 7 Best Stocks for the Next 30 Days. Click to get this free report
This article originally published on Zacks Investment Research (zacks.com).
| 6 hours | |
| 7 hours | |
| 10 hours |
Mining Stocks Face Big Expectations Ahead Of Earnings, As Gold And Silver Sink
KGC
Investor's Business Daily
|
| 11 hours | |
| 11 hours | |
| 13 hours | |
| 14 hours | |
| 14 hours | |
| 14 hours | |
| 14 hours | |
| 15 hours | |
| 15 hours | |
| 16 hours | |
| Feb-16 | |
| Feb-16 |
Join thousands of traders who make more informed decisions with our premium features. Real-time quotes, advanced visualizations, backtesting, and much more.
Learn more about FINVIZ*Elite