|
|
|

|
|||||
|
|
|
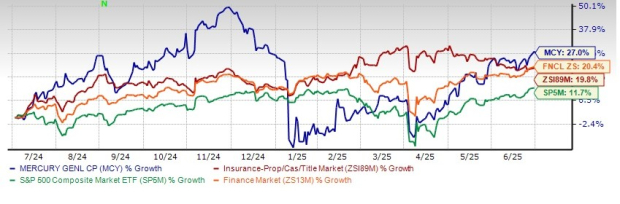
Shares of Mercury General Corporation MCY have gained 27% in the past year, outperforming its industry, the Finance sector and the Zacks S&P 500 composite’s growth of 19.8%, 20.4% and 11.7%, respectively.
Mercury General has outperformed its peers, American Financial Group, Inc. AFG and NMI Holdings Inc. NMIH, which have risen 4.5% and 25.2%, respectively, in the past year. Meanwhile, shares of Arch Capital Group Ltd. ACGL have lost 6.3% in the past year.
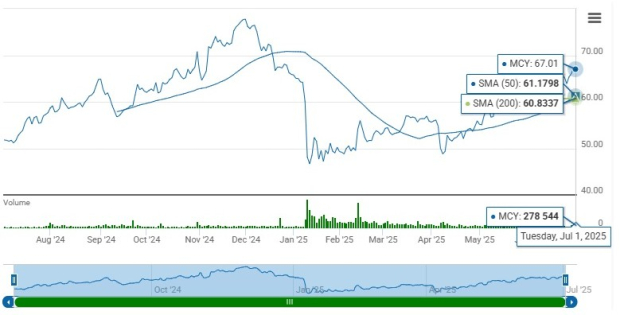
The insurer has a market capitalization of $3.71 billion. The average volume of shares traded in the last three months was 0.3 million.
Shares of Mercury General are trading above the 50-day and 200-day simple moving averages (SMAs) of $61.40 and $61.43, indicating solid upward momentum. SMA is a widely used technical analysis tool to predict future price trends by analyzing historical price data. Its share price as of July 1, 2025, was $67.01, a 17% discount from its 52-week high of $80.72.
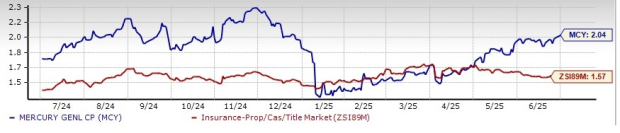
Its shares are trading at a premium to the Zacks Property and Casualty Insurance industry. Its price-to-book value of 2.04X is higher than the industry average of 1.57X.
The Zacks Consensus Estimate for 2025 revenues is pegged at $5.88 million, implying a year-over-year improvement of 9.1%. The estimate for 2026 earnings per share and revenues indicates an increase of 1,150% and 7.8%, respectively, from the corresponding 2025 estimates.
The insurer has a solid surprise history. It surpassed earnings estimates in each of the last four quarters, the average beat being 133.56%.
Return on equity (ROE) for the trailing 12 months was 9.52%, which compared favorably with the industry’s 6.1%. This reflects its efficiency in utilizing shareholders’ funds.
Return on invested capital in the trailing 12 months was 6.73%, better than the industry average of 5.96%, reflecting MCY’s efficiency in utilizing funds to generate income.
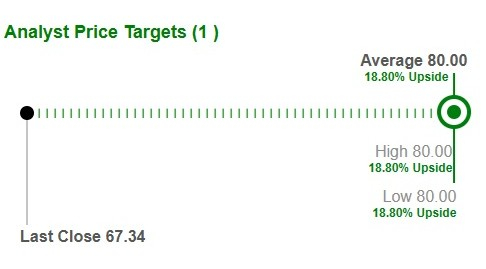
Based on short-term price targets offered by one analyst, the Zacks average price target is $80 per share. The average suggests a potential 18.8% upside from the last closing price.
Mercury General has been witnessing an improvement in net premiums written across its Property and Casualty segment. Rate increases in the California automobile and homeowners lines of insurance business and an increase in the number of policies written in the California private passenger automobile and homeowners lines of insurance business, should drive net premiums earned. In fact, the top line witnessed a five-year (2020-2024) CAGR of 7.6%, driven by higher net premiums earned, net investment income and other revenues.
Net investment income has been an important component of Mercury General’s top-line growth. Mercury General’s net investment income witnessed a CAGR of 15.7% in the last five years (2020-2024). Net investment income stands to benefit from a higher average yield combined with higher average invested assets and cash. Increasing overall market interest rates, as well as higher yields on investments based on floating interest rates, are expected to drive the average annual yield on investments.
Mercury General has generated positive cash flow from operations each year since the public offering of its common stock in November 1985. With combined cash and short-term investments, as well as undrawn credit in its unsecured credit facility, the company believes its cash flow from operations is adequate to satisfy its liquidity requirements without the forced sale of investments. Investment maturities are also available to meet the company’s liquidity needs.
However, Mercury General has been witnessing rising expenses over the past few years, primarily due to higher losses and loss adjustment expenses, policy acquisition costs and other operating expenses. The company must grow its revenues at a higher magnitude than the rise in expenses, or else margins may erode.
Solid performance across its Property and Casualty segment, rate increases, rise in the number of policies written, higher average invested assets and cash, as well as financial flexibility, make Mercury General a strong contender for being in one’s portfolio. Favorable estimates, growth potential and higher return on capital also add to the upside.
Given the escalating expenses and premium valuation, it is better to stay cautious about this Zacks Rank #3 (Hold) stock. You can see the complete list of today’s Zacks #1 Rank (Strong Buy) stocks here.
Want the latest recommendations from Zacks Investment Research? Today, you can download 7 Best Stocks for the Next 30 Days. Click to get this free report
This article originally published on Zacks Investment Research (zacks.com).
| Apr-02 | |
| Apr-01 | |
| Mar-26 | |
| Mar-24 | |
| Mar-20 | |
| Mar-19 | |
| Mar-17 | |
| Mar-17 | |
| Mar-12 | |
| Mar-10 | |
| Mar-10 | |
| Mar-10 | |
| Mar-08 | |
| Mar-06 | |
| Mar-06 |
Join thousands of traders who make more informed decisions with our premium features. Real-time quotes, advanced visualizations, alerts, and much more.
Learn more about Finviz Elite