 |
| Market Cap | 368.68M | EPS (ttm) | 0.79 |
| P/E | 17.06 | EPS this Y | - |
| Forward P/E | - | EPS next Y | - |
| PEG | - | EPS past 5Y | - |
| P/S | 104.95 | EPS next 5Y | - |
| P/B | 0.84 | EPS Q/Q | - |
| Dividend | 7.49% | Sales Q/Q | 34.40% |
| Insider Own | - | Inst Own | 36.04% |
| Insider Trans | - | Inst Trans | - |
| Short Float | 0.07% | Earnings | - |
| Analyst Recom | - | Target Price | - |
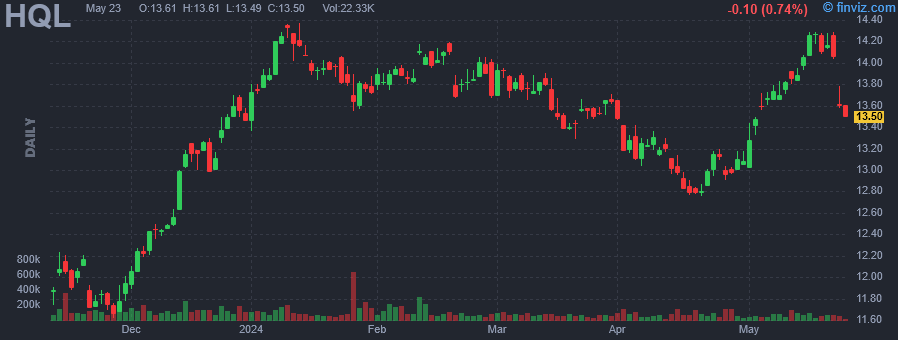
| Avg Volume | 97.85K | 52W Range | 11.34 - 14.37 |
|
|
|
|
Tekla Life Sciences Investors is a closed-ended equity mutual fund launched and managed by Tekla Capital Management LLC. The fund invests in public equity markets across the globe. It seeks to invest in stocks of companies operating in the life sciences sector, including the biotechnology, pharmaceutical, diagnostics, managed healthcare, medical equipment, hospitals, healthcare information technology and services, devices and supplies industries, and in agriculture and environmental management industries. The fund primarily invests in growth stocks of small cap companies. It employs fundamental analysis with a focus on factors such as market position for services or products, experience of business management, technological expertise, and the ability either to generate funds internally to finance growth or to secure outside sources of capital to create its portfolio. The fund benchmarks the performance of its portfolio against the NASDAQ Biotech Index and the S&P 500 Index. It was formerly known as H&Q Life Sciences Investors fund. Tekla Life Sciences Investors was formed on February 20, 1992 and is domiciled in the United States. |
| Insider Trading |
Relationship |
Date |
Transaction |
Cost |
#Shares |
Value ($) |
#Shares Total |
SEC Form 4 |
| Saba Capital Management, L.P. | 10% Owner | May 02 '24 | Buy | 13.46 | 26,274 | 353,648 | 3,068,730 | May 02 04:50 PM | | Saba Capital Management, L.P. | 10% Owner | May 01 '24 | Buy | 13.02 | 252 | 3,281 | 3,042,456 | May 02 04:50 PM | | Saba Capital Management, L.P. | 10% Owner | Apr 30 '24 | Buy | 13.13 | 16,573 | 217,603 | 3,042,204 | May 01 10:23 AM | | Saba Capital Management, L.P. | 10% Owner | Apr 26 '24 | Buy | 13.00 | 120,304 | 1,563,952 | 3,025,602 | Apr 29 04:54 PM | | Saba Capital Management, L.P. | 10% Owner | Apr 25 '24 | Buy | 12.99 | 97,574 | 1,267,486 | 2,905,298 | Apr 26 11:40 AM |
|
|
 |
 |
| Market Cap | 443.89M | EPS (ttm) | -0.66 |
| P/E | - | EPS this Y | - |
| Forward P/E | - | EPS next Y | - |
| PEG | - | EPS past 5Y | - |
| P/S | - | EPS next 5Y | - |
| P/B | - | EPS Q/Q | - |
| Dividend | 8.92% | Sales Q/Q | - |
| Insider Own | - | Inst Own | 40.44% |
| Insider Trans | - | Inst Trans | - |
| Short Float | 0.18% | Earnings | - |
| Analyst Recom | - | Target Price | - |
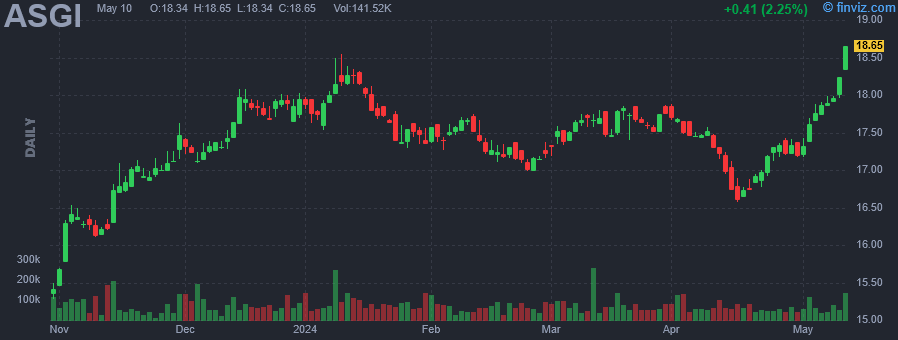
| Avg Volume | 72.38K | 52W Range | 14.96 - 18.55 |
|
|
|
|
Abrdn Global Infrastructure Income Fund seeks investment results that correspond generally to the price and yield performance, before fees and expenses, of the Northern Trust Real Assets Allocation IndexSM.Under normal circumstances, the fund will invest at least 80% of its total assets (exclusive of collateral held from securities lending) in the securities of the underlying index. The underlying index measures the performance of an optimized allocation to the underlying funds that is intended to provide exposures to certain real assets and minimize overall volatility of investment in the underlying funds. |
| Insider Trading |
Relationship |
Date |
Transaction |
Cost |
#Shares |
Value ($) |
#Shares Total |
SEC Form 4 |
| Saba Capital Management, L.P. | 10% Owner | May 02 '24 | Buy | 17.51 | 58,011 | 1,015,773 | 2,889,010 | May 02 04:47 PM | | Saba Capital Management, L.P. | 10% Owner | May 01 '24 | Buy | 17.20 | 18,556 | 319,163 | 2,830,999 | May 02 04:47 PM | | Saba Capital Management, L.P. | 10% Owner | Apr 29 '24 | Buy | 17.37 | 15,132 | 262,843 | 2,812,434 | May 01 10:21 AM | | Saba Capital Management, L.P. | 10% Owner | Apr 25 '24 | Buy | 17.27 | 34,547 | 596,627 | 2,797,302 | Apr 26 11:36 AM | | Saba Capital Management, L.P. | 10% Owner | Apr 23 '24 | Buy | 17.11 | 13,691 | 234,253 | 2,762,755 | Apr 23 07:56 PM |
|
|
|
 |
| Market Cap | 95.46M | EPS (ttm) | 1.43 |
| P/E | 10.62 | EPS this Y | 16.99% |
| Forward P/E | 6.97 | EPS next Y | 21.79% |
| PEG | - | EPS past 5Y | -5.60% |
| P/S | 1.29 | EPS next 5Y | - |
| P/B | 0.81 | EPS Q/Q | -16.64% |
| Dividend | 3.95% | Sales Q/Q | 25.01% |
| Insider Own | 17.84% | Inst Own | 35.16% |
| Insider Trans | 0.47% | Inst Trans | 0.27% |
| Short Float | 0.16% | Earnings | Apr 30/b |
| Analyst Recom | 3.00 | Target Price | 18.50 |
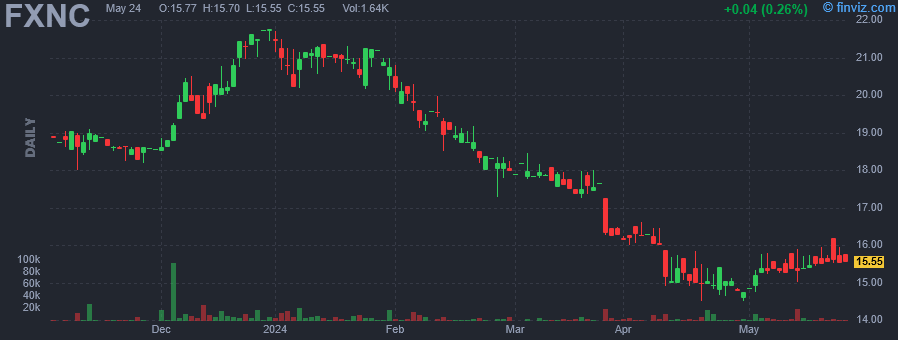
| Avg Volume | 4.16K | 52W Range | 13.13 - 21.75 |
|
|
|
|
First National Corp. operates as a bank holding company, which engages in the provision of consumer and business banking services through its subsidiary. It offers savings, checking, mortgage lending, home equity, treasury management, construction loan, commercial mortgage, and rental properties. The company was founded on September 7, 1983 and is headquartered in Strasburg, VA. |
| Insider Trading |
Relationship |
Date |
Transaction |
Cost |
#Shares |
Value ($) |
#Shares Total |
SEC Form 4 |
| WILKINS III JAMES R | Director | May 02 '24 | Buy | 15.01 | 4,257 | 63,905 | 283,034 | May 02 04:46 PM | | HARVARD SCOTT C | President & CEO | May 02 '24 | Buy | 14.90 | 1,000 | 14,900 | 69,729 | May 02 04:45 PM | | Smith Gerald F JR | Director | Sep 29 '23 | Buy | 17.30 | 686 | 11,868 | 18,558 | Oct 02 04:51 PM | | Smith Gerald F JR | Director | Sep 28 '23 | Buy | 17.45 | 1,600 | 27,920 | 18,089 | Oct 02 04:51 PM | | Smith Gerald F JR | Director | Sep 27 '23 | Buy | 17.00 | 1,675 | 28,475 | 17,489 | Sep 28 04:45 PM |
|
|
| |
 |
| Market Cap | 191.78M | EPS (ttm) | 3.76 |
| P/E | 8.05 | EPS this Y | -28.04% |
| Forward P/E | 9.03 | EPS next Y | 15.52% |
| PEG | - | EPS past 5Y | 13.51% |
| P/S | 1.55 | EPS next 5Y | - |
| P/B | 0.79 | EPS Q/Q | -28.77% |
| Dividend | 3.97% | Sales Q/Q | 36.68% |
| Insider Own | 25.85% | Inst Own | 43.54% |
| Insider Trans | 3.45% | Inst Trans | -0.39% |
| Short Float | 1.84% | Earnings | Apr 25/a |
| Analyst Recom | 3.00 | Target Price | 33.00 |
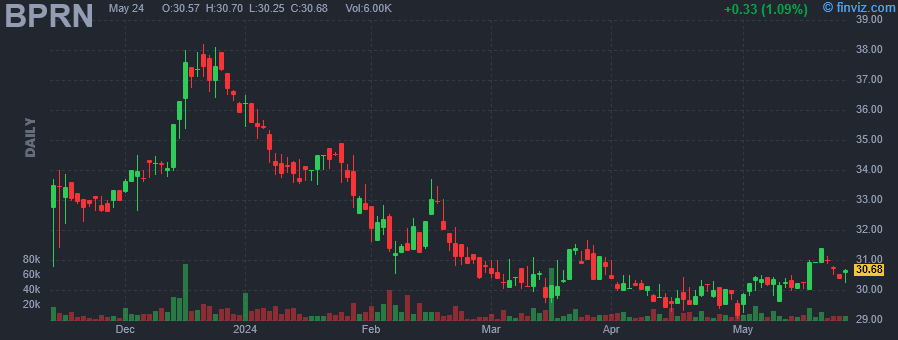
| Avg Volume | 11.45K | 52W Range | 23.49 - 38.19 |
|
|
|
|
Princeton Bancorp, Inc. operates as a bank holding company. It is a full-service financial institution that provides business and personal banking. It offers traditional retail banking services, one-to-four-family residential mortgage loans, multi-family and commercial mortgage loans, construction loans, commercial business loans, and consumer loans, including home equity loans and lines of credit. The company was founded in 2017 and is headquartered in Princeton, NJ. |
| Insider Trading |
Relationship |
Date |
Transaction |
Cost |
#Shares |
Value ($) |
#Shares Total |
SEC Form 4 |
| TUCHMAN MARTIN | Director | May 01 '24 | Buy | 29.35 | 105 | 3,081 | 90,924 | May 02 04:35 PM | | TUCHMAN MARTIN | Director | Apr 30 '24 | Buy | 29.43 | 2,000 | 58,850 | 90,819 | May 02 04:35 PM | | TUCHMAN MARTIN | Director | Mar 15 '24 | Buy | 29.75 | 10,000 | 297,500 | 600,141 | Mar 18 09:08 AM | | TUCHMAN MARTIN | Director | Mar 15 '24 | Buy | 29.74 | 5,000 | 148,720 | 88,819 | Mar 18 09:08 AM | | TUCHMAN MARTIN | Director | Mar 12 '24 | Buy | 29.99 | 3,168 | 95,000 | 590,141 | Mar 14 03:02 PM |
|
|
|
 |
| Market Cap | 69.40B | EPS (ttm) | 5.69 |
| P/E | 9.69 | EPS this Y | -16.24% |
| Forward P/E | 6.77 | EPS next Y | 11.29% |
| PEG | 2.62 | EPS past 5Y | - |
| P/S | 0.19 | EPS next 5Y | 3.69% |
| P/B | 0.93 | EPS Q/Q | -46.91% |
| Dividend | 4.55% | Sales Q/Q | 3.60% |
| Insider Own | 0.17% | Inst Own | 82.05% |
| Insider Trans | -0.80% | Inst Trans | 0.60% |
| Short Float | 1.43% | Earnings | May 01/b |
| Analyst Recom | 1.90 | Target Price | 72.87 |
| Avg Volume | 10.75M | 52W Range | 54.00 - 83.25 |
|
|
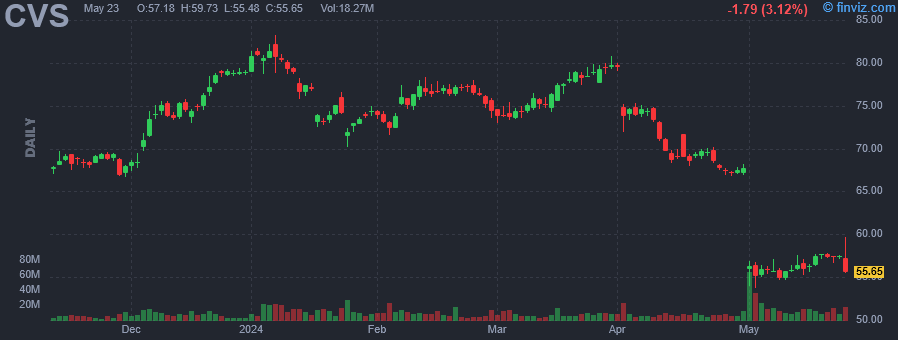
| May-02-24 | Downgrade |
UBS |
Buy → Neutral |
$85 → $60 |
|
|
|
CVS Health Corp. is a health solutions company, which engages in the provision of healthcare services. It operates through the following segments: Health Care Benefits, Health Services, Pharmacy and Consumer Wellness, and Corporate and Other. The Health Care Benefits segment operates as a health care benefits provider. The Health Services segment offers a full range of PBM solutions, delivers health care services in its medical clinics, virtually, and in the home. The Pharmacy & Consumer Wellness segment dispenses prescriptions in its retail pharmacies and through its infusion operations. The Corporate and Other Segment is involved in management and administrative expenses. The company was founded by Stanley P. Goldstein and Ralph Hoagland in 1963 and is headquartered in Woonsocket, RI. |
| Insider Trading |
Relationship |
Date |
Transaction |
Cost |
#Shares |
Value ($) |
#Shares Total |
SEC Form 4 |
| Mahoney Michael F | Director | May 02 '24 | Buy | 54.49 | 9,181 | 500,294 | 9,356 | May 02 04:30 PM | | LUDWIG EDWARD J | Director | May 02 '24 | Buy | 53.88 | 1,000 | 53,879 | 21,630 | May 02 04:31 PM | | Shah Prem S | EVP and Pres-Pharm, Consumer W | Feb 16 '24 | Sale | 76.95 | 29,473 | 2,267,947 | 39,765 | Feb 16 06:46 PM | | LUDWIG EDWARD J | Director | Nov 03 '23 | Buy | 70.47 | 2,000 | 140,930 | 20,630 | Nov 06 10:59 AM | | Clark James David | SVP, Cont & Chief Acct Officer | Aug 03 '23 | Sale | 74.92 | 25,759 | 1,930,004 | 4,698 | Aug 04 05:41 PM |
|
|
| |
 |
| Market Cap | 5.64B | EPS (ttm) | 1.16 |
| P/E | 58.34 | EPS this Y | 22.96% |
| Forward P/E | 23.17 | EPS next Y | 31.61% |
| PEG | 2.21 | EPS past 5Y | -16.84% |
| P/S | 3.14 | EPS next 5Y | 26.37% |
| P/B | 3.46 | EPS Q/Q | -13.82% |
| Dividend | 0.89% | Sales Q/Q | 1.72% |
| Insider Own | 0.65% | Inst Own | 99.69% |
| Insider Trans | 8.79% | Inst Trans | 1.69% |
| Short Float | 1.29% | Earnings | Apr 22/a |
| Analyst Recom | 2.55 | Target Price | 76.29 |
| Avg Volume | 994.70K | 52W Range | 58.81 - 79.08 |
|
|
|
May-02-24 04:50PM
|
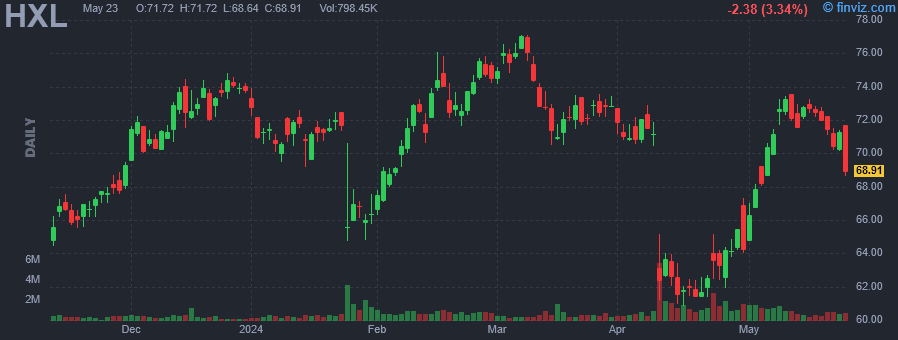
Hexcel Insider Bought Shares Worth $993,763, According to a Recent SEC Filing
(MT Newswires) |
|
Apr-30-24 09:03PM
|
Director Cynthia Egnotovich Acquires 4,000 Shares of Hexcel Corp (HXL)
(GuruFocus.com) |
|
04:29PM
|
Hexcel Insider Bought Shares Worth $257,560, According to a Recent SEC Filing
(MT Newswires) |
|
09:42AM
|
Deutsche Bank Adjusts Price Target on Hexcel to $70 From $71, Maintains Hold Rating
(MT Newswires) |
|
Apr-29-24 07:00PM
|
Hexcel Corp (HXL) Chairman and CEO Nick Stanage Acquires 15,000 Shares
(GuruFocus.com) |
|
07:00PM
|
Director Jeffrey Campbell Acquires 10,000 Shares of Hexcel Corp (HXL)
(GuruFocus.com) |
|
04:21PM
|
Hexcel Insider Bought Shares Worth $641,300, According to a Recent SEC Filing
(MT Newswires) |
|
Apr-24-24 01:44PM
|
Analyst Report: Hexcel Corporation
(Morningstar Research) |
|
11:22AM
|
Hexcel Corporation (NYSE:HXL) Q1 2024 Earnings Call Transcript
(Insider Monkey) |
|
03:08AM
|
Hexcel Corp (HXL) Q1 2024 Earnings Call Transcript Highlights: Navigating Through Aerospace and ...
(GuruFocus.com) |
|
Hexcel Corp. engages in the development, manufacture, and marketing of lightweight structural materials. It operates through the Composite Materials and Engineered Products segments. The Composite Materials segment includes carbon fiber, specialty reinforcements, resins, prepregs and other fiber-reinforced matrix materials, and honeycomb core product lines and pultruded profiles. The Engineered Products segment refers to the lightweight high strength composite structures, engineered core and honeycomb products with added functionality, and additive manufacturing. The company was founded by Roger C. Steele and Roscoe T. Hughes in 1946 and is headquartered in Stamford, CT. |
| Insider Trading |
Relationship |
Date |
Transaction |
Cost |
#Shares |
Value ($) |
#Shares Total |
SEC Form 4 |
| Gentile Tom | CEO and President | May 01 '24 | Buy | 66.25 | 15,000 | 993,763 | 15,000 | May 02 04:26 PM | | HACHEY GUY C | Director | Apr 29 '24 | Buy | 64.53 | 3,000 | 193,590 | 3,000 | Apr 30 04:04 PM | | HACHEY GUY C | Director | Apr 29 '24 | Buy | 64.31 | 2,000 | 128,620 | 5,000 | Apr 30 04:04 PM | | Stanage Nick L | Chairman, CEO and President | Apr 26 '24 | Buy | 64.29 | 15,000 | 964,350 | 392,446 | Apr 29 04:01 PM | | EGNOTOVICH CYNTHIA M | Director | Apr 26 '24 | Buy | 64.39 | 4,000 | 257,560 | 4,000 | Apr 30 04:01 PM |
|
|
|
 |
| Market Cap | 41.91B | EPS (ttm) | 3.21 |
| P/E | 30.08 | EPS this Y | -16.88% |
| Forward P/E | 37.58 | EPS next Y | -10.77% |
| PEG | - | EPS past 5Y | 23.06% |
| P/S | 6.12 | EPS next 5Y | -8.67% |
| P/B | 6.94 | EPS Q/Q | -25.77% |
| Dividend | 6.50% | Sales Q/Q | -7.45% |
| Insider Own | 0.42% | Inst Own | 91.82% |
| Insider Trans | -0.26% | Inst Trans | 0.38% |
| Short Float | 1.19% | Earnings | Apr 17/a |
| Analyst Recom | 2.65 | Target Price | 111.38 |
| Avg Volume | 2.89M | 52W Range | 84.72 - 122.97 |
|
|
|
|
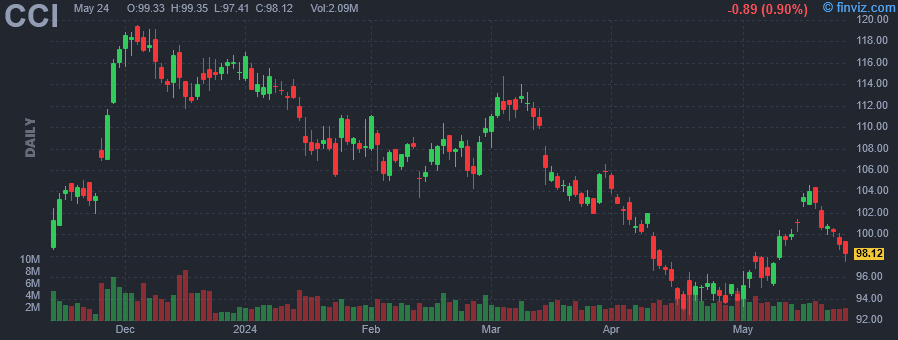
Crown Castle, Inc. engages in the business of owning, operating, and leasing shared communications infrastructure. It operates through the following segments: Towers, Fiber, and Other. The Towers segment focuses on providing coverage and capacity for wireless carrier network deployments. The Fiber segment includes communications infrastructure offerings of small cells and fiber solutions. The Other segment is involved in corporate assets such as cash and cash equivalents. The company was founded by Ted B. Miller Jr. and Edward C. Hutcheson Jr. in 1994 and is headquartered in Houston, TX. |
| Insider Trading |
Relationship |
Date |
Transaction |
Cost |
#Shares |
Value ($) |
#Shares Total |
SEC Form 4 |
| Chan Edmond | EVP and CIO | Apr 10 '24 | Option Exercise | 0.00 | 2,260 | 0 | 2,260 | Apr 11 04:24 PM | | Collins Robert Sean | Vice President and Controller | Mar 05 '24 | Sale | 113.49 | 3,250 | 368,842 | 8,275 | Mar 06 04:36 PM | | Collins Robert Sean | Vice President and Controller | Feb 19 '24 | Option Exercise | 0.00 | 2,181 | 0 | 12,216 | Feb 21 04:45 PM | | Adams Edward B JR | EVP and General Counsel | Feb 19 '24 | Option Exercise | 0.00 | 3,345 | 0 | 22,532 | Feb 21 04:42 PM | | SCHLANGER DANIEL K | EVP & Chief Financial Officer | Feb 19 '24 | Option Exercise | 0.00 | 8,206 | 0 | 111,467 | Feb 21 04:47 PM |
|
|
| |
 |
| Market Cap | 140.66M | EPS (ttm) | 6.06 |
| P/E | 6.89 | EPS this Y | - |
| Forward P/E | - | EPS next Y | - |
| PEG | - | EPS past 5Y | 6.09% |
| P/S | 0.89 | EPS next 5Y | - |
| P/B | 0.65 | EPS Q/Q | -45.73% |
| Dividend | 4.22% | Sales Q/Q | 9.39% |
| Insider Own | 6.68% | Inst Own | 37.34% |
| Insider Trans | 0.24% | Inst Trans | 3.87% |
| Short Float | 0.80% | Earnings | - |
| Analyst Recom | - | Target Price | - |
| Avg Volume | 9.41K | 52W Range | 33.51 - 72.00 |
|
|
|
|
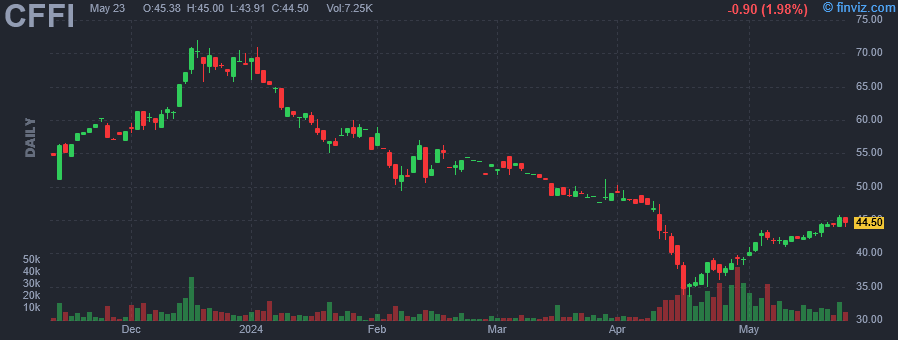
C&F Financial Corp. is a bank holding company, which engages in the provision of banking services to individuals and businesses. It operates through the following segments: Community Banking, Mortgage Banking and Consumer Finance. The Community Banking segment provides checking and savings deposit accounts, business, real estate, development, mortgage, home equity, and installment loans. The Mortgage Banking segment offers ancillary mortgage loan origination services for loan settlement and residential appraisals. The Consumer Finance segment consists of automobile financing through lending programs that are designed to serve customers in the non-prime market who have limited access to traditional automobile financing. The company was founded on March 8, 1994 and is headquartered in Toano, VA. |
| Insider Trading |
Relationship |
Date |
Transaction |
Cost |
#Shares |
Value ($) |
#Shares Total |
SEC Form 4 |
| Sisson George R III | Director | Apr 30 '24 | Buy | 39.47 | 1,000 | 39,465 | 5,635 | May 02 04:19 PM | | Long Jason E | EVP, CHIEF FINANCIAL OFFICER | Apr 24 '24 | Buy | 38.47 | 500 | 19,235 | 10,200 | Apr 25 01:05 PM | | PEAY D ANTHONY | Director | Feb 29 '24 | Sale | 51.78 | 455 | 23,560 | 1,800 | Mar 04 03:46 PM | | Seaman John A III | EVP, CHIEF CREDIT OFFICER | Dec 13 '23 | Sale | 63.22 | 500 | 31,610 | 6,941 | Dec 14 03:38 PM | | Crone S Dustin | Pres and CEO of C&F Finance | Jun 08 '23 | Sale | 56.87 | 1,000 | 56,870 | 9,631 | Jun 12 12:58 PM |
|
|
|
 |
| Market Cap | 11.53M | EPS (ttm) | - |
| P/E | - | EPS this Y | - |
| Forward P/E | - | EPS next Y | - |
| PEG | - | EPS past 5Y | - |
| P/S | - | EPS next 5Y | - |
| P/B | - | EPS Q/Q | - |
| Dividend | - | Sales Q/Q | - |
| Insider Own | - | Inst Own | 64.87% |
| Insider Trans | - | Inst Trans | 0.11% |
| Short Float | 0.67% | Earnings | - |
| Analyst Recom | - | Target Price | - |
| Avg Volume | 3.83K | 52W Range | 7.80 - 12.66 |
|
|
|
|
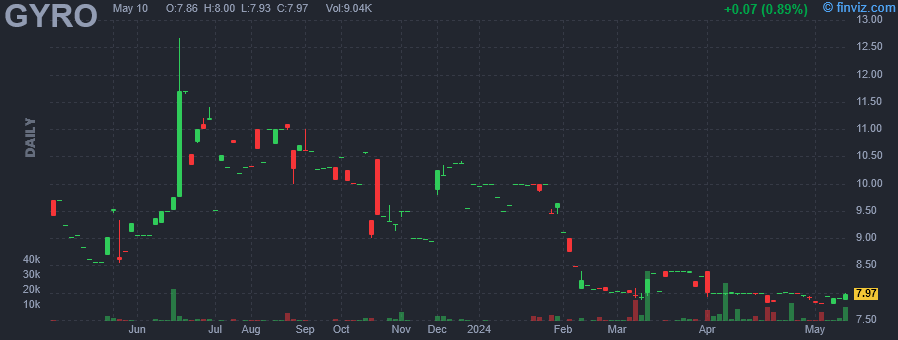
Gyrodyne LLC engages in the management of a portfolio of medical office and industrial properties. Its properties include Flowerfield, Port Jefferson Professional Park, Courtland Medical Center, and Grove. The company was founded by Peter James Papadakos in 1946 and is headquartered in St. James, NY. |
| Insider Trading |
Relationship |
Date |
Transaction |
Cost |
#Shares |
Value ($) |
#Shares Total |
SEC Form 4 |
| TOWERVIEW LLC | 10% Owner | May 02 '24 | Buy | 7.80 | 1,846 | 14,399 | 347,000 | May 02 04:18 PM | | TOWERVIEW LLC | 10% Owner | May 01 '24 | Buy | 7.83 | 424 | 3,320 | 345,154 | May 02 04:18 PM | | TOWERVIEW LLC | 10% Owner | Apr 16 '24 | Buy | 7.84 | 2,434 | 19,083 | 344,730 | Apr 18 08:54 AM | | LAMB PAUL L | Director | Apr 01 '24 | Sale | 7.99 | 4,368 | 34,916 | 111,328 | Apr 04 01:03 PM |
|
|
|
 |
| Market Cap | 2.90B | EPS (ttm) | 4.23 |
| P/E | 27.86 | EPS this Y | 34.01% |
| Forward P/E | 19.91 | EPS next Y | 18.86% |
| PEG | 1.53 | EPS past 5Y | - |
| P/S | 2.49 | EPS next 5Y | 18.20% |
| P/B | 1.77 | EPS Q/Q | 1525.52% |
| Dividend | 2.03% | Sales Q/Q | 13.11% |
| Insider Own | 3.25% | Inst Own | 93.02% |
| Insider Trans | -1.56% | Inst Trans | -6.12% |
| Short Float | 1.68% | Earnings | Apr 25/b |
| Analyst Recom | 1.00 | Target Price | 136.25 |
| Avg Volume | 115.97K | 52W Range | 64.53 - 121.29 |
|
|
|
|
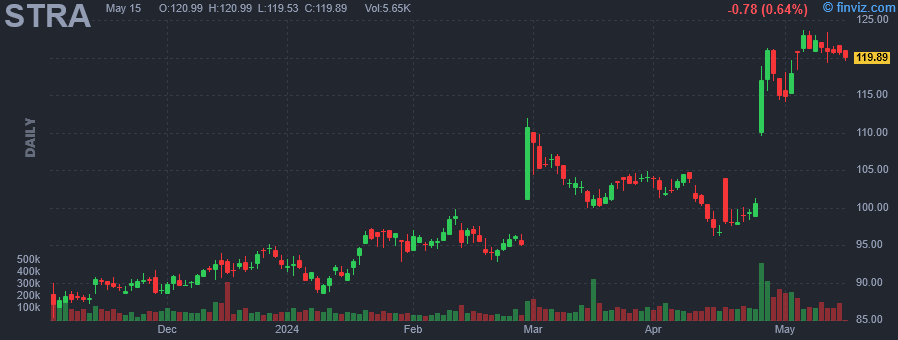
Strategic Education, Inc. engages in the provision of educational services. It provides access to education through campus-based and online post-secondary education offerings, as well as through programs to develop job-ready skills. The firm operates through three segments: U.S. Higher Education, Education Technology Services and Australia/New Zealand. The U.S. Higher Education segment primarily consists of Strayer University and Capella University and focuses on providing flexible and affordable certificate and degree programs to working adults. The Education Technology Services segment focuses on developing and maintaining relationships with employers to build employee education benefits programs. The Australia/New Zealand segment through Torrens University and associated assets, provides certificate and degree programs in Australia and New Zealand. The company was founded in 1892 and is headquartered in Herndon, VA. |
| Insider Trading |
Relationship |
Date |
Transaction |
Cost |
#Shares |
Value ($) |
#Shares Total |
SEC Form 4 |
| GILLIGAN J KEVIN | Vice Chairman | May 04 '29 | Sale | 148.88 | 739 | 110,022 | 6,293 | May 05 04:36 PM | | DINH VIET D | Director | Apr 30 '24 | Buy | 114.83 | 4,300 | 493,769 | 15,020 | May 02 04:14 PM | | GRUSKY ROBERT R | Director | Apr 29 '24 | Sale | 120.99 | 462 | 55,897 | 11,945 | May 01 04:39 PM | | MCDONNELL RAYMOND KARL | CHIEF EXECUTIVE OFFICER | Feb 27 '24 | Sale | 95.99 | 12,820 | 1,230,592 | 161,359 | Feb 29 04:46 PM | | JACKSON DANIEL WAYNE | CHIEF FINANCIAL OFFICER | Feb 27 '24 | Sale | 95.95 | 3,713 | 356,262 | 71,770 | Feb 29 04:48 PM |
|
|
|
