 |
| Market Cap | 6.50B | EPS (ttm) | -0.47 |
| P/E | - | EPS this Y | 6.26% |
| Forward P/E | 18.49 | EPS next Y | 25.44% |
| PEG | - | EPS past 5Y | 22.39% |
| P/S | 1.39 | EPS next 5Y | 17.00% |
| P/B | 13.22 | EPS Q/Q | 84.37% |
| Dividend | - | Sales Q/Q | 27.65% |
| Insider Own | 15.02% | Inst Own | 79.81% |
| Insider Trans | -1.12% | Inst Trans | 4.69% |
| Short Float | 15.11% | Earnings | May 07/a |
| Analyst Recom | 2.68 | Target Price | 18.41 |
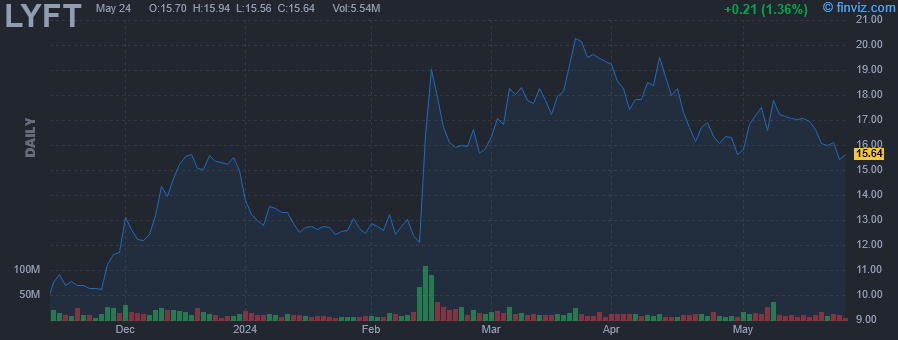
| Avg Volume | 14.36M | 52W Range | 7.85 - 20.82 |
|
|
|
|
Lyft, Inc. engages in the provision and management of an online social rideshare community platform. It offers access to a network of shared bikes and scooters for shorter rides and first mile and last-mile legs of multimodal trips, information about nearby public transit routes, and Lyft Rentals to offer riders a view of transportation options when planning any trip. The company was founded by Marcus Cohn, John Zimmer, Rajat Suri, Matt van Horn, and Logan Green in 2007 and is headquartered in San Francisco, CA. |
| Insider Trading |
Relationship |
Date |
Transaction |
Cost |
#Shares |
Value ($) |
#Shares Total |
SEC Form 4 |
| Zimmer John Patrick | Director | May 20 '24 | Sale | 16.54 | 7,923 | 131,060 | 924,621 | May 22 09:38 PM | | Green Logan | Director | May 20 '24 | Sale | 16.54 | 6,664 | 110,204 | 339,677 | May 22 09:35 PM | | Sverchek Kristin | PRESIDENT | May 03 '24 | Sale | 17.50 | 3,500 | 61,253 | 60,778 | May 03 08:21 PM | | Sverchek Kristin | PRESIDENT | May 01 '24 | Sale | 15.54 | 6,500 | 100,996 | 64,278 | May 03 08:21 PM | | Sverchek Kristin | PRESIDENT | Apr 01 '24 | Sale | 19.28 | 10,200 | 196,661 | 70,778 | Apr 03 04:21 PM |
|
|
 |
 |
| Market Cap | 8.59B | EPS (ttm) | 2.07 |
| P/E | 114.33 | EPS this Y | 133.63% |
| Forward P/E | 45.25 | EPS next Y | 31.21% |
| PEG | 4.57 | EPS past 5Y | -33.29% |
| P/S | 12.78 | EPS next 5Y | 25.00% |
| P/B | 25.31 | EPS Q/Q | 206.41% |
| Dividend | - | Sales Q/Q | 37.71% |
| Insider Own | 43.88% | Inst Own | 54.24% |
| Insider Trans | -0.95% | Inst Trans | 0.13% |
| Short Float | 5.96% | Earnings | Apr 25/a |
| Analyst Recom | 1.50 | Target Price | 262.54 |
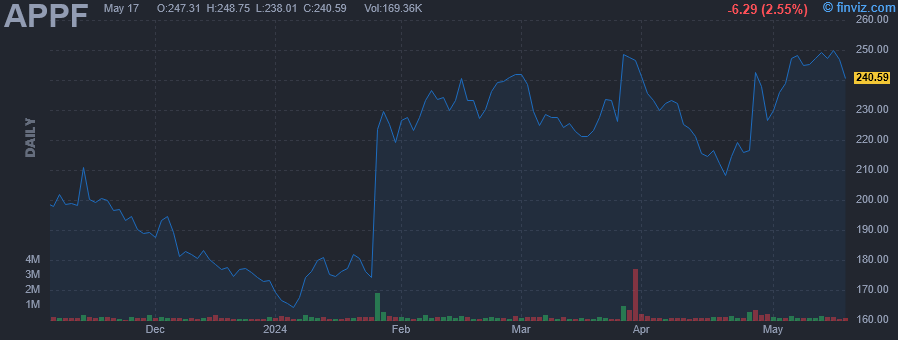
| Avg Volume | 308.91K | 52W Range | 138.49 - 256.73 |
|
|
|
|
AppFolio, Inc., provides industry-specific cloud-based business software solutions, services, and data analytics for the real estate industry. The firm offers AppFolio Property Manager, a property management solution designed to address the operational and business requirements of property management companies and their business ecosystems and AppFolio Investment Management, a cloud-based software solution for real estate investment managers of various sizes that provides tools and services designed to streamline their real estate investment management businesses. It also provides Value+ services that are designed to enhance, automate, and streamline processes and workflows for property management businesses, such as artificial intelligence leasing assistant, tenant screening, electronic payment, utility management, maintenance contact center, tenant debt collection, and mailing services. The company was founded by Brian Donahoo, Klaus Schauser and Jonathan Walker in 2006 and is headquartered in Santa Barbara, CA. |
| Insider Trading |
Relationship |
Date |
Transaction |
Cost |
#Shares |
Value ($) |
#Shares Total |
SEC Form 4 |
| BLISS TIMOTHY K | Director | May 21 '24 | Sale | 239.13 | 16,055 | 3,839,200 | 0 | May 22 09:08 PM | | BLISS TIMOTHY K | Director | May 21 '24 | Sale | 239.13 | 4,354 | 1,041,164 | 0 | May 22 09:08 PM | | BLISS TIMOTHY K | Director | May 20 '24 | Sale | 243.41 | 23,600 | 5,744,497 | 16,055 | May 22 09:08 PM | | BLISS TIMOTHY K | Director | May 20 '24 | Sale | 243.41 | 6,400 | 1,557,831 | 4,354 | May 22 09:08 PM | | Trigg William Shane | Chief Executive Officer | May 15 '24 | Sale | 249.76 | 8,210 | 2,050,495 | 89,072 | May 17 04:06 PM |
|
|
|
 |
| Market Cap | 2.56B | EPS (ttm) | -3.97 |
| P/E | - | EPS this Y | 22.23% |
| Forward P/E | - | EPS next Y | -1.63% |
| PEG | - | EPS past 5Y | -106.26% |
| P/S | - | EPS next 5Y | - |
| P/B | 5.74 | EPS Q/Q | -3.25% |
| Dividend | - | Sales Q/Q | - |
| Insider Own | 34.31% | Inst Own | 82.59% |
| Insider Trans | -10.75% | Inst Trans | -3.15% |
| Short Float | 18.08% | Earnings | May 02/a |
| Analyst Recom | 1.00 | Target Price | 46.10 |
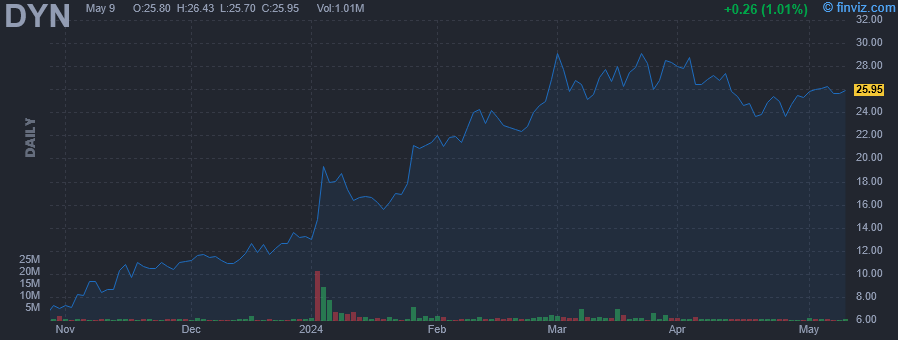
| Avg Volume | 1.31M | 52W Range | 6.40 - 35.98 |
|
|
|
|
Dyne Therapeutics, Inc. engages in developing innovative life-transforming therapies for genetically driven muscle diseases. It develops a broad portfolio of therapeutics for muscle diseases, including lead programs in myotonic dystrophy type 1, Duchenne muscular dystrophy, and facioscapulohumeral muscular dystroph. The company was founded by Jason P. Rhodes and Romesh R. Subramanian on December 1, 2017 and is headquartered in Waltham, MA. |
| Insider Trading |
Relationship |
Date |
Transaction |
Cost |
#Shares |
Value ($) |
#Shares Total |
SEC Form 4 |
| Beskrovnaya Oxana | Chief Scientific Officer | May 20 '24 | Option Exercise | 1.03 | 30,426 | 31,339 | 180,073 | May 22 09:01 PM | | Beskrovnaya Oxana | Chief Scientific Officer | May 20 '24 | Sale | 32.96 | 30,426 | 1,002,751 | 149,647 | May 22 09:01 PM | | McNeill Jonathan | Chief Business Officer | May 16 '24 | Sale | 28.27 | 2,774 | 78,420 | 136,634 | May 17 09:03 PM | | HIGH SUSANNA GATTI | Chief Operating Officer | May 16 '24 | Sale | 28.27 | 2,738 | 77,402 | 154,062 | May 17 09:05 PM | | Beskrovnaya Oxana | Chief Scientific Officer | May 16 '24 | Sale | 28.27 | 2,705 | 76,469 | 149,647 | May 17 09:07 PM |
|
|
| |
 |
| Market Cap | 2.39B | EPS (ttm) | 7.27 |
| P/E | 19.25 | EPS this Y | 30.19% |
| Forward P/E | 16.12 | EPS next Y | 7.42% |
| PEG | 2.41 | EPS past 5Y | - |
| P/S | 1.62 | EPS next 5Y | 8.00% |
| P/B | 2.93 | EPS Q/Q | 53.94% |
| Dividend | - | Sales Q/Q | 33.85% |
| Insider Own | 6.93% | Inst Own | 91.03% |
| Insider Trans | -9.10% | Inst Trans | -2.23% |
| Short Float | 1.90% | Earnings | Apr 25/b |
| Analyst Recom | 1.00 | Target Price | 166.00 |
| Avg Volume | 93.29K | 52W Range | 103.04 - 145.24 |
|
|
|
|
OSI Systems, Inc. engages in the design and manufacture of specialized electronic systems, and components for critical applications. It operates through the following segments: Security, Healthcare, and Optoelectronics and Manufacturing. The Security segment includes security inspection systems and related services, and turnkey security screening solutions. The Healthcare segment provides patient monitoring, diagnostic cardiology, and related services. The Optoelectronics and Manufacturing segment refers to electronic components and electronic manufacturing services. The company was founded by Deepak Chopra in May 1987 and is headquartered in Hawthorne, CA. |
| Insider Trading |
Relationship |
Date |
Transaction |
Cost |
#Shares |
Value ($) |
#Shares Total |
SEC Form 4 |
| ALIABADI MANOOCHER M | PRES., OPTOELECTRONICS DIV | May 21 '24 | Sale | 143.58 | 2,567 | 368,570 | 81,473 | May 22 09:00 PM | | CHOPRA DEEPAK | PRESIDENT AND CEO | May 15 '24 | Sale | 139.75 | 40,000 | 5,589,823 | 428,615 | May 17 09:00 PM | | HAWKINS JAMES B | Director | May 08 '24 | Sale | 134.09 | 10,000 | 1,340,875 | 7,834 | May 09 06:16 PM | | CHIZEVER GERALD M | Director | May 08 '24 | Sale | 134.11 | 3,000 | 402,330 | 10,515 | May 09 06:26 PM | | Ballhaus William Francis JR | Director | May 08 '24 | Sale | 133.98 | 675 | 90,436 | 25,907 | May 09 06:29 PM |
|
|
|
 |
| Market Cap | 5.06B | EPS (ttm) | 1.09 |
| P/E | 28.67 | EPS this Y | 12.48% |
| Forward P/E | 17.01 | EPS next Y | 13.86% |
| PEG | 1.94 | EPS past 5Y | 27.64% |
| P/S | 3.04 | EPS next 5Y | 14.75% |
| P/B | 6.30 | EPS Q/Q | -3.34% |
| Dividend | - | Sales Q/Q | 8.95% |
| Insider Own | 5.11% | Inst Own | 97.21% |
| Insider Trans | -1.51% | Inst Trans | -0.30% |
| Short Float | 3.70% | Earnings | May 02/b |
| Analyst Recom | 1.55 | Target Price | 36.61 |
| Avg Volume | 1.09M | 52W Range | 25.17 - 33.40 |
|
|
|
|
ExlService Holdings, Inc. is an operations management and analytics company, which engages in providing business process management. It operates through the following segments: Insurance, Healthcare, Travel, Transportation, and Logistics, Finance and Accounting, Analytic, and All Other. The Insurance segment serves property and casualty insurance, life insurance, disability insurance, annuity, and retirement services companies. The Healthcare segment offers services related to care management or population health, payment integrity, revenue optimization, and customer engagement. The Travel, Transportation, and Logistics segment includes business processes in corporate and leisure travel such as reservations, customer service, fulfillment, and finance and accounting. The Finance and Accounting segment is comprised of procure-to-pay, order-to-cash, hire-to-retire, record-to-report, regulatory reporting, financial planning and analysis, audit and assurance, treasury, and tax processes. The Analytics segment consists of driving improved business outcomes for customers by generating data-driven insights. The All-Other segment is involved in banking, financial, utilities, and consulting services. The company was founded by Vikram Talwar and Rohit Kapoor in April 1999 and is headquartered in New York, NY. |
| Insider Trading |
Relationship |
Date |
Transaction |
Cost |
#Shares |
Value ($) |
#Shares Total |
SEC Form 4 |
| Kapoor Rohit | Chairman & CEO | May 20 '24 | Sale | 31.07 | 36,847 | 1,144,836 | 1,549,588 | May 22 08:43 PM | | Kapoor Rohit | Chairman & CEO | May 13 '24 | Sale | 30.47 | 30,000 | 914,100 | 1,586,435 | May 14 05:15 PM | | Kapoor Rohit | Chairman & CEO | May 10 '24 | Sale | 30.61 | 15,000 | 459,150 | 1,616,435 | May 14 05:15 PM | | Nicolelli Maurizio | Executive Vice President & CFO | May 08 '24 | Sale | 30.66 | 12,000 | 367,920 | 138,985 | May 10 05:02 PM | | AYYAPPAN AJAY | EVP & Gen Counsel/Corp. Sec'y. | Mar 12 '24 | Sale | 31.59 | 9,259 | 292,492 | 50,693 | Mar 14 05:04 PM |
|
|
| |
 |
| Market Cap | 37.02B | EPS (ttm) | 8.40 |
| P/E | 90.57 | EPS this Y | 11.75% |
| Forward P/E | 46.19 | EPS next Y | 25.09% |
| PEG | 3.62 | EPS past 5Y | 30.00% |
| P/S | 20.25 | EPS next 5Y | 25.00% |
| P/B | 17.51 | EPS Q/Q | -16.19% |
| Dividend | 0.66% | Sales Q/Q | 1.51% |
| Insider Own | 4.49% | Inst Own | 95.44% |
| Insider Trans | -11.91% | Inst Trans | 4.64% |
| Short Float | 1.87% | Earnings | May 01/a |
| Analyst Recom | 1.75 | Target Price | 781.56 |
| Avg Volume | 520.46K | 52W Range | 392.10 - 778.15 |
|
|
|
|
Monolithic Power Systems, Inc. designs, develops, and markets integrated power semiconductor solutions and power delivery architectures for computing and storage, automotive, industrial, communications, and consumer applications markets. It offers direct current (DC) to DC integrated circuits (ICs) that are used to convert and control voltages of various electronic systems, such as portable electronic devices, wireless LAN access points, computers and notebooks, monitors, infotainment applications, and medical equipment. The Firm also provides lighting control ICs for backlighting that are used in systems, which provide the light source for LCD panels in notebook computers, monitors, car navigation systems, and televisions, as well as for general illumination products. The company was founded by Michael R. Hsing, and James C. Moyer on August 22, 1997, and is headquartered in Kirkland, WA. |
| Insider Trading |
Relationship |
Date |
Transaction |
Cost |
#Shares |
Value ($) |
#Shares Total |
SEC Form 4 |
| Xiao Deming | EVP, Global Operations | May 22 '24 | Sale | 769.40 | 1,300 | 1,000,220 | 206,418 | May 22 08:20 PM | | Zhou Jeff | Director | May 20 '24 | Sale | 750.00 | 200 | 150,000 | 6,069 | May 22 06:01 PM | | CHANG KUO WEI HERBERT | Director | May 20 '24 | Sale | 750.00 | 200 | 150,000 | 741 | May 22 06:09 PM | | CHANG KUO WEI HERBERT | Director | May 15 '24 | Sale | 735.00 | 200 | 147,000 | 941 | May 15 06:52 PM | | Hsing Michael | CEO | May 08 '24 | Sale | 690.00 | 2,824 | 1,948,560 | 888,408 | May 09 12:49 PM |
|
|
|
 |
| Market Cap | 47.14B | EPS (ttm) | 0.13 |
| P/E | 167.09 | EPS this Y | 31.57% |
| Forward P/E | 53.47 | EPS next Y | 20.36% |
| PEG | - | EPS past 5Y | - |
| P/S | 20.20 | EPS next 5Y | - |
| P/B | 12.49 | EPS Q/Q | 478.95% |
| Dividend | - | Sales Q/Q | 20.78% |
| Insider Own | 14.47% | Inst Own | 40.03% |
| Insider Trans | -8.17% | Inst Trans | 1.94% |
| Short Float | 4.13% | Earnings | May 06/a |
| Analyst Recom | 3.20 | Target Price | 21.22 |
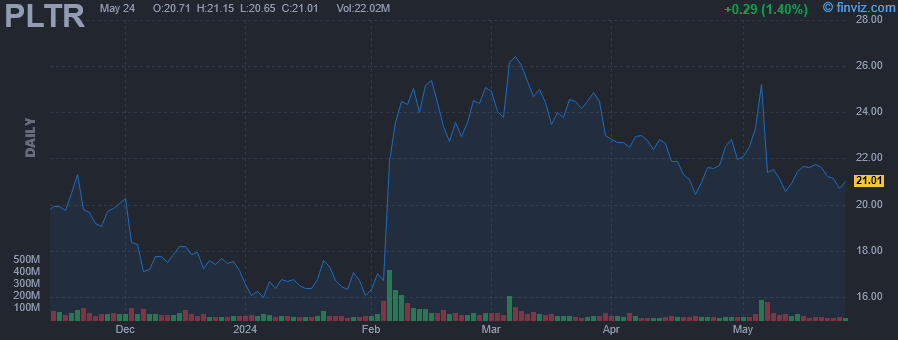
| Avg Volume | 51.66M | 52W Range | 11.39 - 27.50 |
|
|
|
|
Palantir Technologies, Inc. engages in the business of building and deploying software platforms that serve as the central operating systems for its customers. It operates under the Commercial and Government segments. The Commercial segment focuses on customers working in non-government industries. The Government segment is involved in providing services to customers that are the United States government and non-United States government agencies. The company was founded by Alexander Ceadmon Karp, Peter Andreas Thiel, Stephen Cohen, and Nathan Dale Gettings in 2003 and is headquartered in Denver, CO. |
| Insider Trading |
Relationship |
Date |
Transaction |
Cost |
#Shares |
Value ($) |
#Shares Total |
SEC Form 4 |
| Karp Alexander C. | See Remarks | May 22 '24 | Sale | 21.30 | 43,417 | 924,574 | 6,432,258 | May 22 08:11 PM | | Cohen Stephen Andrew | See Remarks | May 22 '24 | Sale | 21.30 | 37,501 | 798,591 | 592 | May 22 08:12 PM | | Sankar Shyam | See Remarks | May 22 '24 | Sale | 21.30 | 18,162 | 386,763 | 752,786 | May 22 08:13 PM | | Taylor Ryan D. | See Remarks | May 22 '24 | Sale | 21.30 | 9,657 | 205,648 | 265,447 | May 22 08:15 PM | | Glazer David A. | See Remarks | May 22 '24 | Sale | 21.30 | 8,336 | 177,517 | 100,617 | May 22 08:14 PM |
|
|
| |
 |
| Market Cap | 220.53M | EPS (ttm) | -0.45 |
| P/E | - | EPS this Y | 35.09% |
| Forward P/E | - | EPS next Y | 16.22% |
| PEG | - | EPS past 5Y | 16.29% |
| P/S | 2.61 | EPS next 5Y | 5.70% |
| P/B | 1.70 | EPS Q/Q | 59.82% |
| Dividend | - | Sales Q/Q | -0.52% |
| Insider Own | 35.84% | Inst Own | 35.02% |
| Insider Trans | -6.23% | Inst Trans | 3.31% |
| Short Float | 0.86% | Earnings | May 08/b |
| Analyst Recom | 1.67 | Target Price | 8.00 |
| Avg Volume | 118.63K | 52W Range | 3.44 - 6.30 |
|
|
|
|
1stdibs.com, Inc. operates as an online marketplace for home decorations, fashion, and interior design. Its business units include 1stdibs and Design Manager. It offers vintage, antique, and contemporary furniture, home decor, jewelry, watches, art, and fashion. The company was founded by Michael Bruno and Laurence Forcione in 2000 and is headquartered in New York, NY. |
| Insider Trading |
Relationship |
Date |
Transaction |
Cost |
#Shares |
Value ($) |
#Shares Total |
SEC Form 4 |
| Insight Holdings Group, LLC | 10% Owner | May 20 '24 | Sale | 5.55 | 18,232 | 101,135 | 48,984 | May 22 08:07 PM | | Insight Holdings Group, LLC | 10% Owner | May 17 '24 | Sale | 5.63 | 12,343 | 69,500 | 49,209 | May 17 07:16 PM | | Insight Holdings Group, LLC | 10% Owner | May 16 '24 | Sale | 5.84 | 7,111 | 41,520 | 49,361 | May 17 07:16 PM | | Insight Holdings Group, LLC | 10% Owner | May 15 '24 | Sale | 6.02 | 2,530 | 15,222 | 49,448 | May 17 07:16 PM | | Insight Holdings Group, LLC | 10% Owner | May 10 '24 | Sale | 6.00 | 11,243 | 67,471 | 49,479 | May 10 06:23 PM |
|
|
|
 |
| Market Cap | 11.17B | EPS (ttm) | 4.94 |
| P/E | 33.83 | EPS this Y | 31.25% |
| Forward P/E | 25.36 | EPS next Y | 10.65% |
| PEG | 1.95 | EPS past 5Y | 15.61% |
| P/S | 2.34 | EPS next 5Y | 17.34% |
| P/B | 9.26 | EPS Q/Q | 31.42% |
| Dividend | 1.44% | Sales Q/Q | 12.51% |
| Insider Own | 0.53% | Inst Own | 93.90% |
| Insider Trans | -11.08% | Inst Trans | -1.63% |
| Short Float | 2.64% | Earnings | May 02/a |
| Analyst Recom | 2.21 | Target Price | 171.88 |
| Avg Volume | 746.05K | 52W Range | 91.06 - 170.76 |
|
|
|
|
Texas Roadhouse, Inc. is a full-service, casual dining restaurant chain, which offers assorted seasoned and aged steaks hand-cut daily on the premises and cooked to order over open gas-fired grills. It operates through the following segments: Texas Roadhouse, Bubba's 33, and Other. The Texas Roadhouse segment offers steaks, ribs, seafood, chicken, pork chops, pulled pork and vegetable plates, and an assortment of hamburgers, salads, and sandwiches. The Bubba's 33 segment refers to the family-friendly restaurant concept featuring scratch-made food for all with a little rock 'n' roll, ice-cold beer, and signature drinks. The Other segment includes the results of the domestic company Jaggers restaurants and the results of retail initiatives. The company was founded by Wayne Kent Taylor on February 17, 1993 and is headquartered in Louisville, KY. |
| Insider Trading |
Relationship |
Date |
Transaction |
Cost |
#Shares |
Value ($) |
#Shares Total |
SEC Form 4 |
| Mujica Hernan E. | CHIEF TECHNOLOGY OFFICER | May 20 '24 | Sale | 168.60 | 3,000 | 505,800 | 17,842 | May 22 08:00 PM | | Doster Travis C. | CHIEF COMMUNICATIONS OFFICER | May 10 '24 | Option Exercise | 0.00 | 834 | 0 | 28,285 | May 10 08:00 PM | | MOORE GREGORY N | Director | May 09 '24 | Sale | 166.69 | 6,300 | 1,050,147 | 41,050 | May 10 08:00 PM | | Warfield Curtis | Director | May 08 '24 | Sale | 165.82 | 1,025 | 169,966 | 12,372 | May 10 08:00 PM | | EPPS DONNA E | Director | Mar 07 '24 | Sale | 149.97 | 670 | 100,480 | 4,142 | Mar 08 08:00 PM |
|
|
|
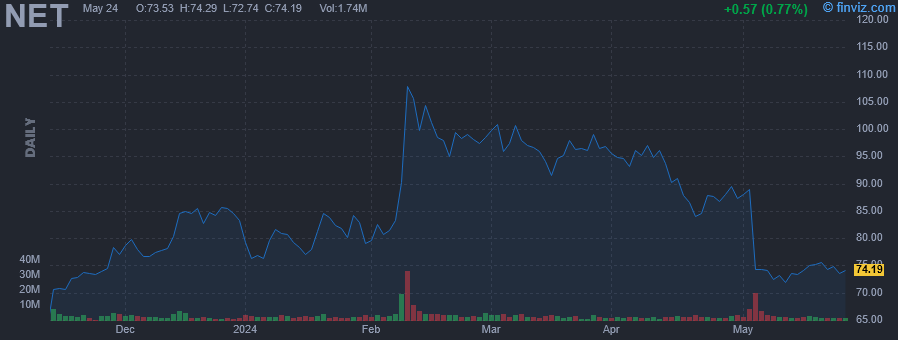 |
| Market Cap | 25.48B | EPS (ttm) | -0.54 |
| P/E | - | EPS this Y | 24.67% |
| Forward P/E | 99.60 | EPS next Y | 23.23% |
| PEG | - | EPS past 5Y | -13.56% |
| P/S | 18.39 | EPS next 5Y | - |
| P/B | 31.95 | EPS Q/Q | 8.93% |
| Dividend | - | Sales Q/Q | 30.47% |
| Insider Own | 13.10% | Inst Own | 74.92% |
| Insider Trans | -5.75% | Inst Trans | -0.16% |
| Short Float | 3.37% | Earnings | May 02/a |
| Analyst Recom | 2.47 | Target Price | 90.78 |
| Avg Volume | 3.23M | 52W Range | 53.88 - 116.00 |
|
|
|
|
Cloudflare, Inc. engages in the provision of cloud-based services to secure websites. It offers various products for performance and reliability, video streaming and delivery, advanced security, insights, Cloudflare for developers, domain registration and Cloudflare marketplace. It operates through United States and Rest of the World geographical segments. The company was founded by Matthew Prince, Michelle Zatlyn and Lee Holloway in July 2009 and is headquartered in San Francisco, CA. |
| Insider Trading |
Relationship |
Date |
Transaction |
Cost |
#Shares |
Value ($) |
#Shares Total |
SEC Form 4 |
| Zatlyn Michelle | President and COO | May 22 '24 | Sale | 74.08 | 12,820 | 949,744 | 0 | May 22 07:50 PM | | Zatlyn Michelle | President and COO | May 21 '24 | Sale | 74.46 | 12,820 | 954,538 | 0 | May 22 07:50 PM | | Zatlyn Michelle | President and COO | May 20 '24 | Sale | 74.94 | 60,863 | 4,560,938 | 0 | May 22 07:50 PM | | SEIFERT THOMAS J | CHIEF FINANCIAL OFFICER | May 20 '24 | Sale | 75.13 | 28,634 | 2,151,359 | 309,937 | May 21 04:59 PM | | Ledbetter Carl | Director | May 15 '24 | Sale | 74.56 | 7,990 | 595,766 | 1,158,658 | May 16 04:19 PM |
|
|
|
