 |
| Market Cap | 18.86B | EPS (ttm) | 7.14 |
| P/E | 25.02 | EPS this Y | 8.47% |
| Forward P/E | 19.89 | EPS next Y | 6.10% |
| PEG | 2.88 | EPS past 5Y | 13.65% |
| P/S | 5.00 | EPS next 5Y | 8.70% |
| P/B | 4.73 | EPS Q/Q | 32.95% |
| Dividend | 1.31% | Sales Q/Q | -3.58% |
| Insider Own | 0.42% | Inst Own | 86.38% |
| Insider Trans | -5.54% | Inst Trans | -3.04% |
| Short Float | 1.96% | Earnings | May 03/b |
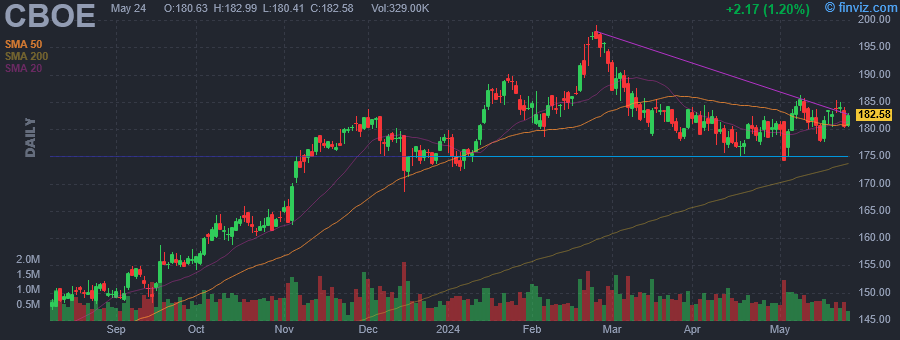
| Analyst Recom | 2.39 | Target Price | 193.00 |
| Avg Volume | 809.48K | 52W Range | 130.91 - 199.00 |
|
|
|
|
Cboe Global Markets, Inc. engages in the provision of trading and investment solutions to investors. It operates through the following business segments: Options, North American Equities, Futures, Europe and Asia Pacific, Global FX, and Digital. The Options segment includes the options exchange business, which lists trading options on market indexes and on non-exclusive multiply listed options. The North American Equities segment covers listed cash equities and ETP transaction services that occur on BZX, BYX, EDGX, and EDGA. The Futures segment refers to the business of futures exchange, CFE, which includes offering for trading futures on the VIX Index and bitcoin and other futures products. The Europe and Asia Pacific segment relates to the pan-European listed cash equities transaction services, ETPs, exchange-traded commodities, and international depository receipts that occur on the RIE, operated by Cboe Europe Equities. The Global FX segment represents the institutional FX trading services that occur on the Cboe FX platform. The Digital segment focuses on Cboe Digital, which operates a digital asset spot market and a regulated futures exchange. The company was founded in 1973 and is headquartered in Chicago, IL. |
| Insider Trading |
Relationship |
Date |
Transaction |
Cost |
#Shares |
Value ($) |
#Shares Total |
SEC Form 4 |
| Sexton John P | EVP, GC AND CORP SEC | Mar 11 '24 | Sale | 185.00 | 6,968 | 1,289,080 | 16,569 | Mar 13 04:32 PM | | Wilkinson Allen | SVP, CHIEF ACCOUNTING OFFICER | Mar 11 '24 | Sale | 184.94 | 275 | 50,858 | 83 | Mar 13 04:33 PM | | Howson Dave | EVP, GLOBAL PRESIDENT | Feb 20 '24 | Sale | 186.96 | 5,322 | 995,001 | 17,573 | Feb 22 04:48 PM | | Howson Dave | EVP, GLOBAL PRESIDENT | Feb 19 '24 | Option Exercise | 186.69 | 9,734 | 1,817,240 | 24,519 | Feb 22 04:48 PM | | Isaacson Christopher A | EVP, COO | Feb 19 '24 | Option Exercise | 186.69 | 8,620 | 1,609,268 | 64,203 | Feb 22 04:38 PM |
|
|
 |
 |
| Market Cap | 26.26B | EPS (ttm) | 3.17 |
| P/E | 27.11 | EPS this Y | 16.67% |
| Forward P/E | 15.09 | EPS next Y | 27.03% |
| PEG | 2.46 | EPS past 5Y | 0.36% |
| P/S | 0.82 | EPS next 5Y | 11.00% |
| P/B | 3.17 | EPS Q/Q | 508.66% |
| Dividend | - | Sales Q/Q | 9.22% |
| Insider Own | 0.86% | Inst Own | 100.42% |
| Insider Trans | -2.46% | Inst Trans | -1.99% |
| Short Float | 1.73% | Earnings | May 03/b |
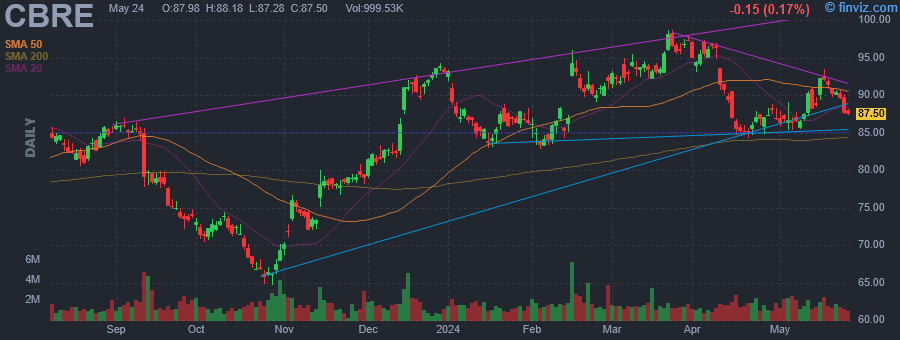
| Analyst Recom | 2.27 | Target Price | 105.88 |
| Avg Volume | 1.70M | 52W Range | 64.63 - 98.65 |
|
|
|
|
CBRE Group, Inc. engages in the provision of commercial real estate and investment services. It operates through the following segments: Advisory Services, Global Workplace Solutions, Real Estate Investments, and Corporate. The Advisory Services segment provides a comprehensive range of services globally, including property leasing, capital markets (property sales and mortgage origination, sales and servicing), property management, project management services and valuation services. The Global Workplace Solutions segment includes a suite of integrated, contractually based outsourcing services globally for occupiers of real estate, including facilities management, project management and transaction services (leasing and sales). The Real Estate Investments segment consists of investment management services provided globally, development services in the United States and United Kingdom and a service designed to help property occupiers and owners meet the growing demand for flexible office space solutions on a global basis. The company was founded by Colbert Coldwell in 1906 and is headquartered in Dallas, TX. |
| Insider Trading |
Relationship |
Date |
Transaction |
Cost |
#Shares |
Value ($) |
#Shares Total |
SEC Form 4 |
| Giamartino Emma E. | Chief Financial Officer | Mar 12 '24 | Sale | 93.36 | 704 | 65,725 | 71,646 | Mar 12 06:06 PM | | Giamartino Emma E. | Chief Financial Officer | Mar 11 '24 | Sale | 93.53 | 2,667 | 249,443 | 72,350 | Mar 12 06:06 PM | | Durburg John E | CEO, Advisory Services | Feb 22 '24 | Sale | 92.20 | 25,000 | 2,305,058 | 207,856 | Feb 23 05:35 PM | | Durburg John E | CEO, Advisory Services | Feb 16 '24 | Sale | 93.40 | 25,000 | 2,335,110 | 232,856 | Feb 20 07:52 PM | | Dhandapani Chandra | CEO, GWS | Feb 16 '24 | Sale | 94.03 | 11,925 | 1,121,277 | 127,064 | Feb 20 07:52 PM |
|
|
|
 |
| Market Cap | 194.13M | EPS (ttm) | -0.25 |
| P/E | - | EPS this Y | -114.67% |
| Forward P/E | - | EPS next Y | 7.76% |
| PEG | - | EPS past 5Y | - |
| P/S | 1.08 | EPS next 5Y | 9.00% |
| P/B | 0.29 | EPS Q/Q | 68.53% |
| Dividend | 8.27% | Sales Q/Q | -0.65% |
| Insider Own | 4.07% | Inst Own | 70.27% |
| Insider Trans | 2.44% | Inst Trans | -9.11% |
| Short Float | 1.06% | Earnings | May 03/b |
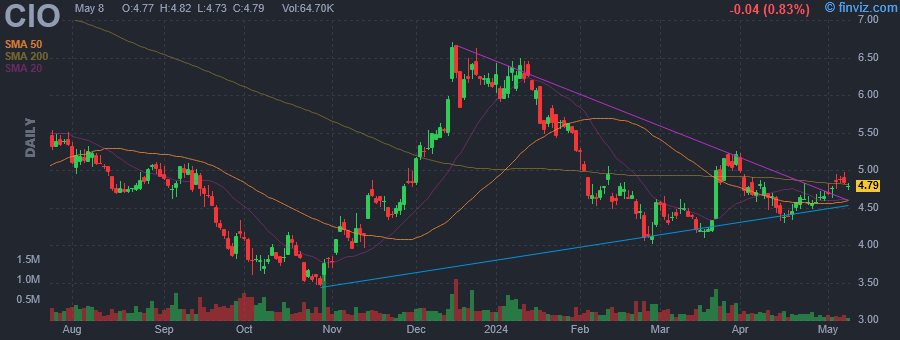
| Analyst Recom | 2.33 | Target Price | 6.00 |
| Avg Volume | 250.42K | 52W Range | 3.45 - 6.70 |
|
|
|
|
City Office REIT, Inc. is a real estate investment trust. It focuses on acquiring, owning and operating office properties located primarily in metropolitan areas in the Southern and Western United States. The company was founded on November 26, 2013 and is headquartered in Vancouver, Canada. |
| Insider Trading |
Relationship |
Date |
Transaction |
Cost |
#Shares |
Value ($) |
#Shares Total |
SEC Form 4 |
| Mazan Michael | Director | Mar 19 '24 | Buy | 4.22 | 39,000 | 164,771 | 39,000 | Mar 21 02:21 PM |
|
|
| |
 |
| Market Cap | 55.21M | EPS (ttm) | -6.99 |
| P/E | - | EPS this Y | 74.23% |
| Forward P/E | - | EPS next Y | -13.64% |
| PEG | - | EPS past 5Y | - |
| P/S | 0.07 | EPS next 5Y | 10.00% |
| P/B | 0.17 | EPS Q/Q | -197413.33% |
| Dividend | - | Sales Q/Q | -11.93% |
| Insider Own | 29.68% | Inst Own | 42.85% |
| Insider Trans | 0.00% | Inst Trans | -19.56% |
| Short Float | 2.94% | Earnings | May 03/b |
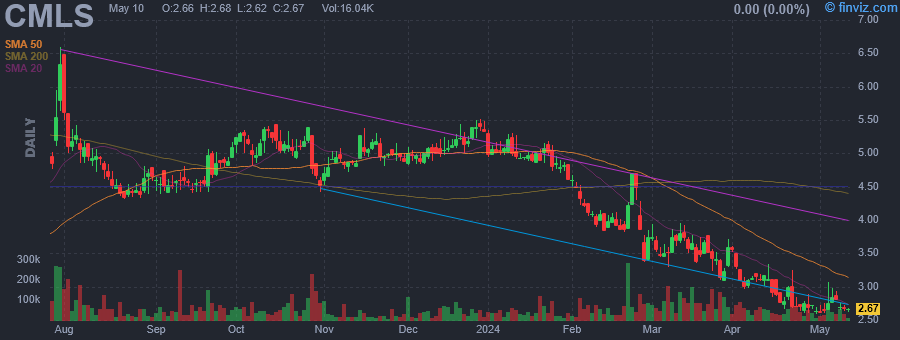
| Analyst Recom | 3.00 | Target Price | 11.00 |
| Avg Volume | 74.83K | 52W Range | 2.57 - 6.59 |
|
|
|
|
Cumulus Media, Inc. engages in the business of radio broadcasting. It operates through the following segments: Radio Station Group, Westwood One and Corporate and Other. The Radio Station Group segment includes the sale of broadcasting time to local, regional, and national advertisers. The Westwood One segment covers the revenues generated through network advertising. The Corporate and Other segment consists of the overall executive, administrative and support functions for each of the company's reportable segments, including finance and administration, legal, human resources and information technology functions. The company was founded in 2002 and is headquartered in Atlanta, GA. |
|
|
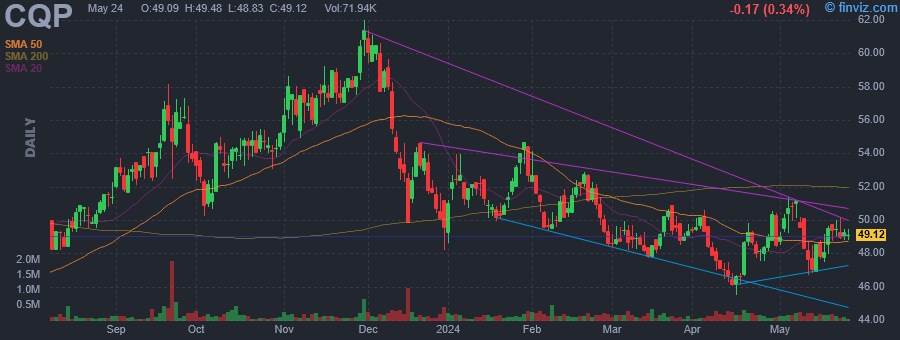 |
| Market Cap | 24.39B | EPS (ttm) | 7.00 |
| P/E | 7.19 | EPS this Y | -44.84% |
| Forward P/E | 12.18 | EPS next Y | 7.93% |
| PEG | - | EPS past 5Y | 97.79% |
| P/S | 2.52 | EPS next 5Y | -7.70% |
| P/B | 23.50 | EPS Q/Q | -69.77% |
| Dividend | 6.60% | Sales Q/Q | -43.11% |
| Insider Own | 91.82% | Inst Own | 46.31% |
| Insider Trans | 0.00% | Inst Trans | -0.29% |
| Short Float | 1.99% | Earnings | May 03/b |
| Analyst Recom | 4.00 | Target Price | 49.82 |
| Avg Volume | 195.48K | 52W Range | 42.80 - 62.02 |
|
|
|
|
Cheniere Energy Partners LP engages in the operations of liquefied natural gas. The company was founded in 2006 and is headquartered in Houston, TX. |
| Insider Trading |
Relationship |
Date |
Transaction |
Cost |
#Shares |
Value ($) |
#Shares Total |
SEC Form 4 |
| Grindal Corey | EVP & Chief Operating Officer | May 25 '23 | Sale | 45.93 | 7,649 | 351,304 | 0 | May 26 05:18 PM |
|
|
| |
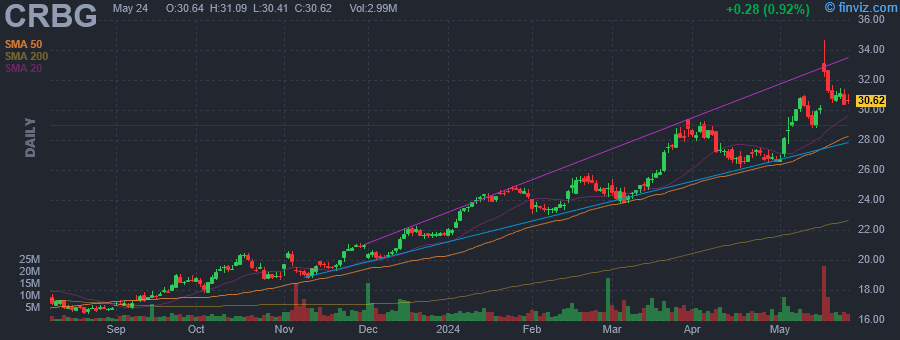 |
| Market Cap | 18.00B | EPS (ttm) | 1.69 |
| P/E | 17.14 | EPS this Y | 19.08% |
| Forward P/E | 4.92 | EPS next Y | 20.27% |
| PEG | 0.96 | EPS past 5Y | - |
| P/S | 0.97 | EPS next 5Y | 17.80% |
| P/B | 1.53 | EPS Q/Q | -137.01% |
| Dividend | 3.45% | Sales Q/Q | -26.16% |
| Insider Own | 62.36% | Inst Own | 38.85% |
| Insider Trans | -19.02% | Inst Trans | - |
| Short Float | 10.27% | Earnings | May 03/b |
| Analyst Recom | 1.46 | Target Price | 32.17 |
| Avg Volume | 4.67M | 52W Range | 13.53 - 29.40 |
|
|
|
|
Corebridge Financial, Inc. engages in the provision of retirement solutions and insurance products. It operates under the following business segments: Individual Retirement, Group Retirement, Life Insurance, Institutional Markets, and Corporate and Other. The Individual Retirement segment consists of fixed annuities, fixed index annuities, variable annuities, and retail mutual funds. The Group Retirement segment is composed of record-keeping, plan administrative and compliance services, financial planning and advisory solutions offered to employer defined contribution plans and their participants, along with proprietary and non-proprietary annuities, advisory and brokerage products offered outside of plan. The Life insurance segment offers term life and universal life insurance. The Institutional Markets segment refers to SVW products, structured settlement, PRT annuities, and corporate-and bank-owned life insurance. The Corporate and Other segment consists of corporate expenses not attributable to other segments, interest expense on financial debt, results of consolidated investment entities, Institutional asset management business, and results of insurance lines ceded to Fortitude. The company was founded in 1957 and is headquartered in Houston, TX. |
| Insider Trading |
Relationship |
Date |
Transaction |
Cost |
#Shares |
Value ($) |
#Shares Total |
SEC Form 4 |
| AMERICAN INTERNATIONAL GROUP, | 10% Owner | Dec 18 '23 | Sale | 21.75 | 6,210,256 | 135,073,068 | 324,203,636 | Dec 19 04:16 PM | | AMERICAN INTERNATIONAL GROUP, | 10% Owner | Dec 05 '23 | Sale | 20.50 | 35,000,000 | 717,500,000 | 330,413,892 | Dec 05 04:19 PM | | AMERICAN INTERNATIONAL GROUP, | 10% Owner | Nov 08 '23 | Sale | 20.50 | 50,000,000 | 1,025,000,000 | 365,413,892 | Nov 13 06:01 AM | | AMERICAN INTERNATIONAL GROUP, | 10% Owner | Jun 23 '23 | Sale | 16.41 | 10,981,108 | 180,199,982 | 415,413,892 | Jun 23 04:26 PM | | AMERICAN INTERNATIONAL GROUP, | 10% Owner | Jun 12 '23 | Sale | 16.25 | 74,750,000 | 1,214,687,500 | 426,395,000 | Jun 12 05:05 PM |
|
|
|
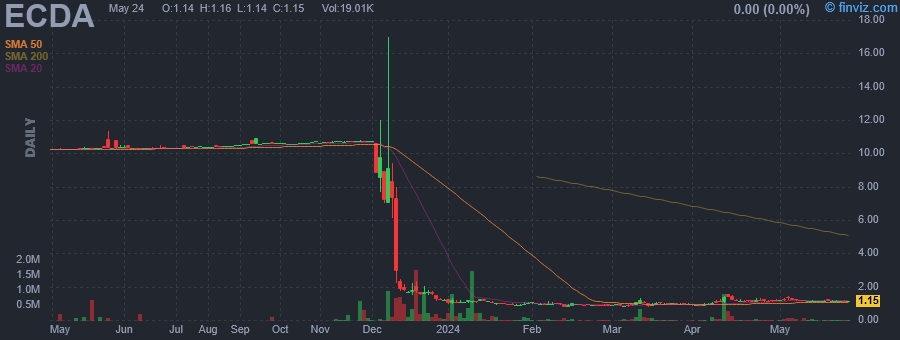 |
| Market Cap | 11.26M | EPS (ttm) | -0.02 |
| P/E | - | EPS this Y | 0.00% |
| Forward P/E | 7.92 | EPS next Y | 300.00% |
| PEG | - | EPS past 5Y | - |
| P/S | - | EPS next 5Y | - |
| P/B | 0.38 | EPS Q/Q | -685.96% |
| Dividend | - | Sales Q/Q | - |
| Insider Own | 72.50% | Inst Own | 10.24% |
| Insider Trans | 0.00% | Inst Trans | - |
| Short Float | 3.09% | Earnings | May 03/b |
| Analyst Recom | 1.00 | Target Price | 8.00 |
| Avg Volume | 65.29K | 52W Range | 0.77 - 17.00 |
|
|
|
|
E.C.D. Automotive Design, Inc. engages in restoration and modification of luxury vehicles. It restores various vehicles, including Land Rovers Defenders, Land Rover Series IIA, the Range Rover Classic, and the Jaguar E-Type. The company was founded by Emily Humble, Thomas Humble, Elliot J. Humble, and Scott Wallace on March 5, 2013 and is headquartered in Kissimmee, FL. |
|
| |
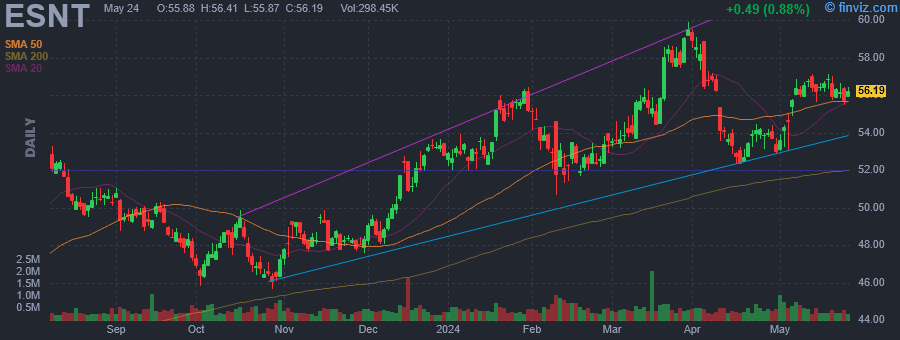 |
| Market Cap | 5.82B | EPS (ttm) | 6.50 |
| P/E | 8.37 | EPS this Y | 1.36% |
| Forward P/E | 7.73 | EPS next Y | 6.90% |
| PEG | 0.84 | EPS past 5Y | 6.38% |
| P/S | 5.33 | EPS next 5Y | 10.00% |
| P/B | 1.14 | EPS Q/Q | 19.67% |
| Dividend | 2.06% | Sales Q/Q | 27.13% |
| Insider Own | 3.15% | Inst Own | 94.02% |
| Insider Trans | -0.77% | Inst Trans | -2.04% |
| Short Float | 0.78% | Earnings | May 03/b |
| Analyst Recom | 1.82 | Target Price | 61.60 |
| Avg Volume | 555.15K | 52W Range | 40.33 - 59.90 |
|
|
|
|
Essent Group Ltd. is a holding company, which engages in the provision of banking services. It offers mortgage insurance, reinsurance, and risk management products. The company was founded by Mark A. Casale on July 1, 2008 and is headquartered in Hamilton, Bermuda. |
| Insider Trading |
Relationship |
Date |
Transaction |
Cost |
#Shares |
Value ($) |
#Shares Total |
SEC Form 4 |
| WEINSTOCK DAVID B | SVP and CFO | Mar 01 '24 | Option Exercise | 0.00 | 4,120 | 0 | 30,456 | Mar 05 09:21 PM | | Bhasin Vijay | SVP and Chief Risk Officer | Jan 19 '24 | Sale | 55.05 | 12,925 | 711,521 | 201,519 | Jan 22 04:53 PM | | Gibbons Mary Lourdes | SVP and Chief Legal Officer | Jan 19 '24 | Sale | 55.00 | 5,000 | 275,000 | 247,969 | Jan 22 04:55 PM | | WEINSTOCK DAVID B | SVP and CFO | Jan 08 '24 | Option Exercise | 0.00 | 1,003 | 0 | 26,651 | Jan 11 06:10 PM | | Gibbons Mary Lourdes | SVP and Chief Legal Officer | Dec 14 '23 | Sale | 52.15 | 8,355 | 435,713 | 252,969 | Dec 15 04:16 PM |
|
|
|
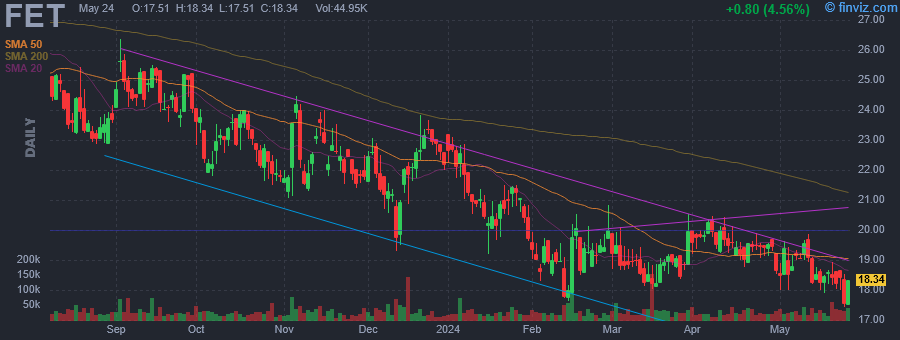 |
| Market Cap | 222.27M | EPS (ttm) | -2.37 |
| P/E | - | EPS this Y | 218.91% |
| Forward P/E | 8.48 | EPS next Y | 78.66% |
| PEG | - | EPS past 5Y | 51.49% |
| P/S | 0.30 | EPS next 5Y | - |
| P/B | 0.45 | EPS Q/Q | -146.51% |
| Dividend | - | Sales Q/Q | 7.11% |
| Insider Own | 10.19% | Inst Own | 63.15% |
| Insider Trans | -0.34% | Inst Trans | -3.99% |
| Short Float | 1.16% | Earnings | May 03/b |
| Analyst Recom | 3.00 | Target Price | 30.00 |
| Avg Volume | 32.41K | 52W Range | 17.65 - 28.73 |
|
|
|
|
Forum Energy Technologies, Inc. designs, manufactures, and distributes products to the oil and natural gas industry. The firm operates through three segments: Drilling & Downhole, Completions, and Production. The Drilling & Downhole segment designs, manufactures, and supplies products, and provides related services to the drilling, downhole, and subsea markets, as well as other markets, such as alternative energy, defense, and communications. This segment offers drilling technologies consisting of capital equipment and a line of products consumed in the drilling, downhole technologies, such as cementing and casing tools, and protection products for artificial lift equipment and cables, and subsea remotely operated vehicles and trenchers, specialty components and tools, and complementary subsea technical services. The Completions segment provides products and related services to the coiled tubing, stimulation, and intervention markets. This segment offers pressure pumping, hydraulic fracturing and flowback services, including hydraulic fracturing pumps, cooling systems, flow iron, wireline cable, and pressure control equipment, as well as related recertification and refurbishment services, and coiled tubing products, such as coiled tubing strings and line pipes. The Production segment designs, manufactures, and supplies products, and provides related equipment and services to the production and infrastructure markets. The company was founded in 2005 and is headquartered in Houston, TX. |
| Insider Trading |
Relationship |
Date |
Transaction |
Cost |
#Shares |
Value ($) |
#Shares Total |
SEC Form 4 |
| IVASCU JOHN C | EVP, General Counsel & CCO | Mar 07 '24 | Sale | 19.25 | 2,000 | 38,500 | 51,543 | Mar 08 02:56 PM | | GAUT C CHRISTOPHER | Director | Feb 19 '24 | Option Exercise | 0.00 | 11,158 | 0 | 265,596 | Feb 21 05:09 PM | | Williams David Lyle Jr. | EVP, CFO | Feb 19 '24 | Option Exercise | 0.00 | 7,983 | 0 | 80,964 | Feb 21 03:45 PM | | Danford Michael Dewayne | SVP & CHO | Feb 19 '24 | Option Exercise | 0.00 | 3,326 | 0 | 38,212 | Feb 21 03:44 PM | | IVASCU JOHN C | EVP, General Counsel & CCO | Feb 19 '24 | Option Exercise | 0.00 | 5,322 | 0 | 60,959 | Feb 21 03:44 PM |
|
|
|
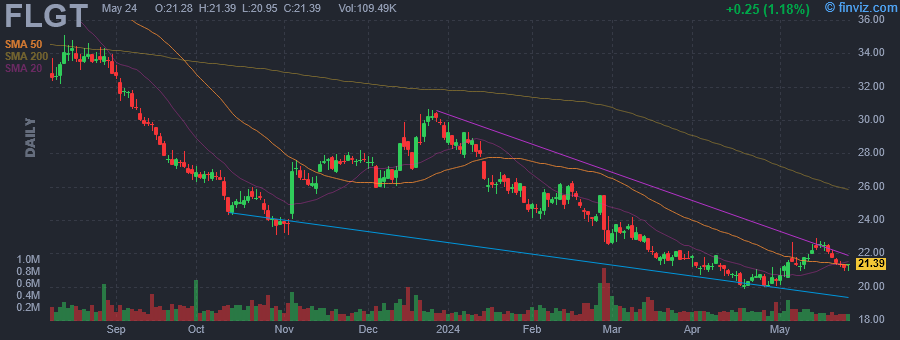 |
| Market Cap | 632.38M | EPS (ttm) | -5.64 |
| P/E | - | EPS this Y | -158.27% |
| Forward P/E | - | EPS next Y | 28.66% |
| PEG | - | EPS past 5Y | -78.39% |
| P/S | 2.19 | EPS next 5Y | - |
| P/B | 0.55 | EPS Q/Q | -435.05% |
| Dividend | - | Sales Q/Q | 4.14% |
| Insider Own | 32.72% | Inst Own | 48.58% |
| Insider Trans | -0.30% | Inst Trans | 1.29% |
| Short Float | 3.12% | Earnings | May 03/b |
| Analyst Recom | 2.67 | Target Price | 26.67 |
| Avg Volume | 217.77K | 52W Range | 19.88 - 44.09 |
|
|
|
|
Fulgent Genetics, Inc. is a technology company, which engages in the provision of gene testing and sequencing solutions. It offers genes and panels, known mutation, hereditary cancer, carrier screening, and tumor profiling solutions. The company was founded by Ming Hsieh on May 13, 2016 and is headquartered in El Monte, CA. |
| Insider Trading |
Relationship |
Date |
Transaction |
Cost |
#Shares |
Value ($) |
#Shares Total |
SEC Form 4 |
| Xie Jian | President and COO | Dec 11 '23 | Sale | 26.52 | 22,000 | 583,453 | 363,124 | Dec 13 08:49 PM | | Xie Jian | President and COO | Dec 04 '23 | Sale | 27.57 | 1,779 | 49,053 | 385,124 | Dec 06 06:00 PM | | Gao Hanlin | Chief Scientific Officer | Dec 04 '23 | Sale | 27.57 | 1,437 | 39,623 | 905,882 | Dec 06 05:47 PM | | Kim Paul | CFO and Treasurer | Dec 04 '23 | Sale | 27.57 | 1,437 | 39,623 | 200,460 | Dec 06 05:54 PM | | Xie Jian | President and COO | Nov 16 '23 | Sale | 27.25 | 1,617 | 44,065 | 386,903 | Nov 20 04:30 PM |
|
|
|
