 |
| Market Cap | 40.48B | EPS (ttm) | 4.91 |
| P/E | 15.40 | EPS this Y | 1.35% |
| Forward P/E | 10.01 | EPS next Y | 11.63% |
| PEG | 1.32 | EPS past 5Y | 17.00% |
| P/S | 0.26 | EPS next 5Y | 11.71% |
| P/B | 1.57 | EPS Q/Q | 122.00% |
| Dividend | - | Sales Q/Q | 10.96% |
| Insider Own | 1.03% | Inst Own | 95.00% |
| Insider Trans | -0.40% | Inst Trans | -1.30% |
| Short Float | 1.43% | Earnings | Apr 26/b |
| Analyst Recom | 2.05 | Target Price | 89.56 |
| Avg Volume | 3.04M | 52W Range | 60.83 - 81.42 |
|
|
|
|
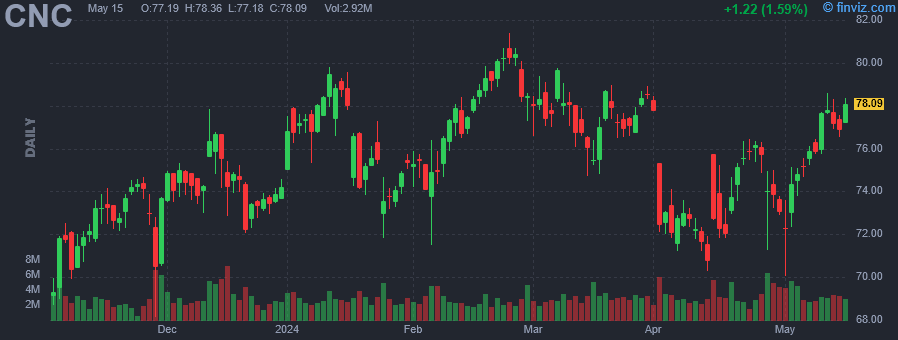
Centene Corp. is a healthcare enterprise, which engages in the provision of programs and services to government sponsored healthcare programs. It operates through the following segments: Medicaid, Medicare, Commercial, and Other. The Medicaid segment includes the Temporary Assistance for Needy Families program, Medicaid Expansion programs, the Aged, Blind or Disabled program, the Children's Health Insurance Program, Long-Term Services and Supports, Foster Care, Medicare-Medicaid Plans, which cover beneficiaries who are dually eligible for Medicaid and Medicare, and other state-based programs. The Medicare segment consists of Medicare Advantage, Medicare Supplement, Dual Eligible Special Needs Plans, and Medicare Prescription Drug Plans. The Commercial segment is involved in the Health Insurance Marketplace product along with individual, small group, and large group commercial health insurance products. The Other segment refers to pharmacy operations, Envolve Benefit Options' vision and dental services, clinical healthcare, behavioral health, international operations, and corporate management companies. The company was founded in 1984 and is headquartered in St. Louis, MO. |
| Insider Trading |
Relationship |
Date |
Transaction |
Cost |
#Shares |
Value ($) |
#Shares Total |
SEC Form 4 |
| Robinson Lori Jean | Director | Feb 13 '24 | Option Exercise | 54.65 | 10,000 | 546,500 | 21,455 | Feb 15 06:31 PM | | Robinson Lori Jean | Director | Feb 13 '24 | Sale | 77.41 | 10,000 | 774,100 | 11,455 | Feb 15 06:31 PM | | FASOLA KENNETH J | President | Feb 07 '24 | Sale | 75.07 | 12,000 | 900,817 | 235,365 | Feb 08 07:38 PM | | Robinson Lori Jean | Director | Apr 27 '23 | Sale | 66.59 | 1,400 | 93,226 | 8,508 | Apr 28 06:04 PM |
|
|
 |
 |
| Market Cap | 2.61B | EPS (ttm) | 6.27 |
| P/E | 11.41 | EPS this Y | 2.73% |
| Forward P/E | 10.67 | EPS next Y | 5.41% |
| PEG | - | EPS past 5Y | 0.77% |
| P/S | 0.89 | EPS next 5Y | -1.20% |
| P/B | 3.09 | EPS Q/Q | 37.71% |
| Dividend | 4.41% | Sales Q/Q | -5.95% |
| Insider Own | 2.93% | Inst Own | 113.74% |
| Insider Trans | -10.18% | Inst Trans | -3.14% |
| Short Float | 11.36% | Earnings | Apr 26/b |
| Analyst Recom | 3.44 | Target Price | 75.44 |
| Avg Volume | 830.50K | 52W Range | 60.65 - 88.03 |
|
|
|
|
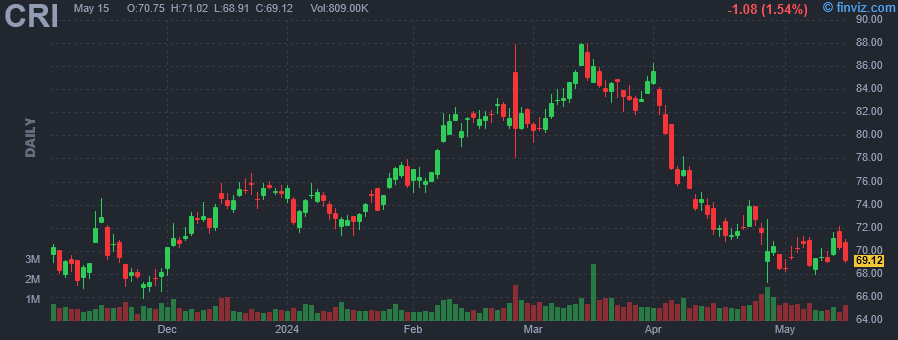
Carter's, Inc. engages in the business of brand marketing of young children's apparel. It operates through the following segments: the United States (US) Retail, US Wholesale, and International. The US Retail segment includes selling products through retail stores and ecommerce websites. The US Wholesale segment focuses on wholesale partners. The International segment is involved in selling in retail stores and ecommerce websites in Canada and Mexico, and to international wholesale customers and licensees. The company was founded by William Carter in 1865 and is headquartered in Atlanta, GA. |
| Insider Trading |
Relationship |
Date |
Transaction |
Cost |
#Shares |
Value ($) |
#Shares Total |
SEC Form 4 |
| Jenkins Jeff | EVP Global Marketing | Mar 13 '24 | Sale | 86.00 | 1,060 | 91,160 | 35,173 | Mar 13 04:27 PM | | Hipp Mark | Director | Mar 06 '24 | Sale | 81.74 | 1,875 | 153,261 | 10,216 | Mar 22 08:46 AM | | CASEY MICHAEL DENNIS | Chairman and CEO | Dec 14 '23 | Option Exercise | 68.49 | 30,000 | 2,054,700 | 479,870 | Dec 15 04:16 PM | | CASEY MICHAEL DENNIS | Chairman and CEO | Dec 14 '23 | Sale | 75.00 | 89,139 | 6,685,425 | 390,731 | Dec 15 04:16 PM | | D'Emilio Julie | EVP, Sales | Dec 08 '23 | Option Exercise | 68.49 | 3,400 | 232,866 | 46,183 | Dec 08 04:31 PM |
|
|
|
 |
| Market Cap | 378.93M | EPS (ttm) | 2.03 |
| P/E | 12.70 | EPS this Y | -93.03% |
| Forward P/E | 53.81 | EPS next Y | 242.86% |
| PEG | 0.85 | EPS past 5Y | - |
| P/S | 0.54 | EPS next 5Y | 15.00% |
| P/B | 1.18 | EPS Q/Q | 234.94% |
| Dividend | 3.87% | Sales Q/Q | 5.31% |
| Insider Own | 8.65% | Inst Own | 77.35% |
| Insider Trans | 0.00% | Inst Trans | 1.68% |
| Short Float | 0.19% | Earnings | Apr 26/b |
| Analyst Recom | 1.00 | Target Price | 31.50 |
| Avg Volume | 64.82K | 52W Range | 17.87 - 28.00 |
|
|
|
|
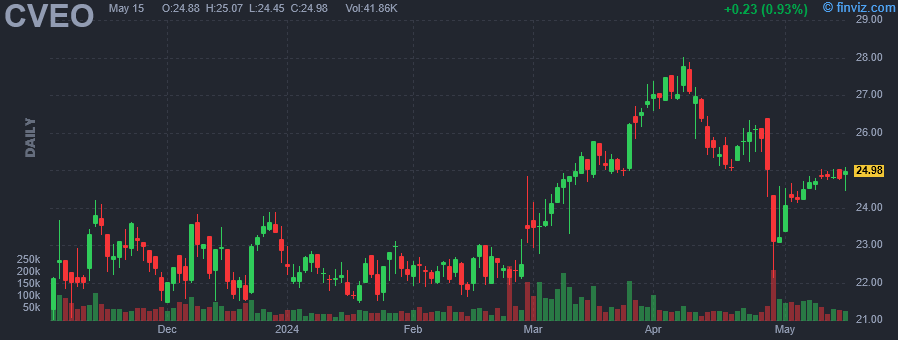
Civeo Corp. engages in the provision of workforce accommodations, logistics and facility management services to the natural resource industry. It operates through the following business segments: Canada, Australia, and U.S. The Canada segment provides accommodation services through lodges, open camps and mobile assets, which supports workforces from oil sands and in a variety of oil and natural gas drilling, mining and related natural resource applications, as well as disaster relief efforts. The Australia segment provides accommodations services on a day rate basis to mining and related service companies, such as construction contractors. The U.S. segment provides open camp facilities and highly mobile smaller camps that follow drilling rigs and completion crews as well as accommodation, office and storage modules that are placed on offshore drilling rigs and products platforms. The company was founded in 1977 and is headquartered in Houston, TX. |
|
| |
 |
| Market Cap | 306.97B | EPS (ttm) | 11.35 |
| P/E | 14.56 | EPS this Y | -0.80% |
| Forward P/E | 11.48 | EPS next Y | 10.50% |
| PEG | 7.67 | EPS past 5Y | 7.97% |
| P/S | 1.56 | EPS next 5Y | 1.90% |
| P/B | 1.92 | EPS Q/Q | -63.46% |
| Dividend | 3.96% | Sales Q/Q | -10.10% |
| Insider Own | 0.03% | Inst Own | 73.32% |
| Insider Trans | -0.50% | Inst Trans | -0.69% |
| Short Float | 2.81% | Earnings | Apr 26/b |
| Analyst Recom | 1.81 | Target Price | 181.29 |
| Avg Volume | 8.26M | 52W Range | 139.62 - 171.70 |
|
|
|
|
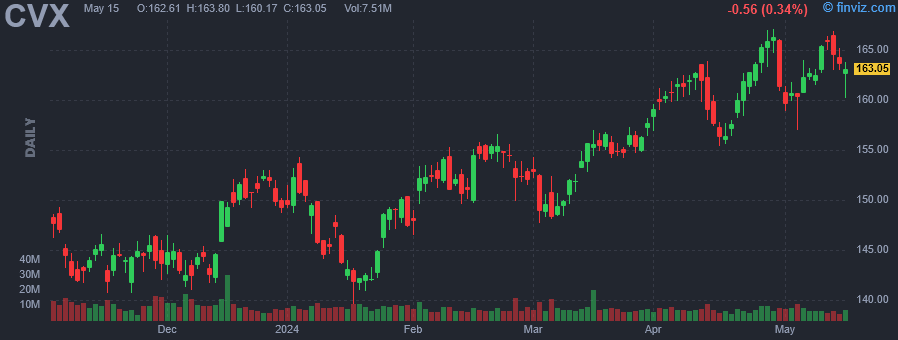
Chevron Corp. engages in the provision of administrative, financial management, and technology support for energy and chemical operations. It operates through the Upstream and Downstream segments. The Upstream segment consists of the exploration, development, and production of crude oil and natural gas, the liquefaction, transportation, and regasification associated with liquefied natural gas, the transporting of crude oil by major international oil export pipelines, the processing, transporting, storage, and marketing of natural gas, and a gas-to-liquids plant. The Downstream segment consists of the refining of crude oil into petroleum products, the marketing of crude oil and refined products, the transporting of crude oil and refined products by pipeline, marine vessel, motor equipment, and rail car, and the manufacturing and marketing of commodity petrochemicals and plastics for industrial uses and fuel & lubricant additives. The company was founded in 1906 and is headquartered in San Ramon, CA. |
| Insider Trading |
Relationship |
Date |
Transaction |
Cost |
#Shares |
Value ($) |
#Shares Total |
SEC Form 4 |
| Knowles Alana K | VP and Controller | Apr 02 '24 | Option Exercise | 110.37 | 2,800 | 309,036 | 3,076 | Apr 04 08:05 PM | | Knowles Alana K | VP and Controller | Apr 02 '24 | Sale | 160.09 | 2,800 | 448,252 | 276 | Apr 04 08:05 PM | | Breber Pierre R | VP & Chief Financial Officer | Jan 31 '24 | Option Exercise | 0.00 | 10,423 | 0 | 16,563 | Feb 02 06:39 PM | | NELSON MARK A | Vice Chairman | Jan 31 '24 | Option Exercise | 0.00 | 10,529 | 0 | 19,370 | Feb 02 06:39 PM | | Pate R. Hewitt | VP and General Counsel | Jan 31 '24 | Option Exercise | 0.00 | 7,859 | 0 | 13,990 | Feb 02 06:43 PM |
|
|
|
 |
| Market Cap | 413.50M | EPS (ttm) | -0.99 |
| P/E | - | EPS this Y | 57.86% |
| Forward P/E | - | EPS next Y | 84.81% |
| PEG | - | EPS past 5Y | - |
| P/S | 0.67 | EPS next 5Y | -5.87% |
| P/B | 5.28 | EPS Q/Q | -531.50% |
| Dividend | 0.62% | Sales Q/Q | -44.59% |
| Insider Own | 26.54% | Inst Own | 74.63% |
| Insider Trans | -21.93% | Inst Trans | 1.19% |
| Short Float | 7.89% | Earnings | Apr 26/b |
| Analyst Recom | 3.00 | Target Price | 1.75 |
| Avg Volume | 3.31M | 52W Range | 1.18 - 5.32 |
|
|
|
|
GrafTech International Ltd. engages in the manufacture of graphite electrode products essential to the production of electric arc furnace steel and other ferrous and non-ferrous metals. The firm also produces a needle coke product which is a raw material in producing graphite electrodes. Its customers include steel producers and other ferrous and non-ferrous metal producers in Europe, the Middle East and Africa, the Americas and Asia-Pacific, which sell its products into the automotive, construction, appliance, machinery, equipment, and transportation industries. The company was founded in 1886 and is headquartered in Brooklyn Heights, OH. |
| Insider Trading |
Relationship |
Date |
Transaction |
Cost |
#Shares |
Value ($) |
#Shares Total |
SEC Form 4 |
| Colonial House Capital Ltd | 10% Owner | Apr 16 '24 | Buy | 1.78 | 2,303,599 | 4,100,867 | 29,535,575 | Apr 18 04:08 PM | | BCP GP Ltd | Former 10% Owner | Jan 02 '24 | Sale | 2.20 | 3,922,786 | 8,630,129 | 23,352,826 | Jan 04 08:32 PM | | BCP GP Ltd | Former 10% Owner | Jan 02 '24 | Sale | 2.20 | 3,922,786 | 8,630,129 | 23,352,826 | Jan 04 08:27 PM | | BCP GP Ltd | Former 10% Owner | Jan 02 '24 | Sale | 2.20 | 3,922,786 | 8,630,129 | 23,352,826 | Jan 04 08:23 PM | | BCP GP Ltd | 10% Owner | Dec 29 '23 | Sale | 2.22 | 129,022 | 285,964 | 27,275,612 | Dec 29 09:31 PM |
|
|
| |
 |
| Market Cap | 2.82B | EPS (ttm) | 1.84 |
| P/E | 12.02 | EPS this Y | -7.52% |
| Forward P/E | 12.53 | EPS next Y | 3.50% |
| PEG | 15.02 | EPS past 5Y | -0.97% |
| P/S | 2.49 | EPS next 5Y | 0.80% |
| P/B | 1.13 | EPS Q/Q | -40.38% |
| Dividend | 4.77% | Sales Q/Q | 21.65% |
| Insider Own | 0.55% | Inst Own | 99.49% |
| Insider Trans | -0.62% | Inst Trans | -1.01% |
| Short Float | 2.01% | Earnings | Apr 26/b |
| Analyst Recom | 3.62 | Target Price | 23.00 |
| Avg Volume | 667.89K | 52W Range | 15.08 - 23.22 |
|
|
|
|
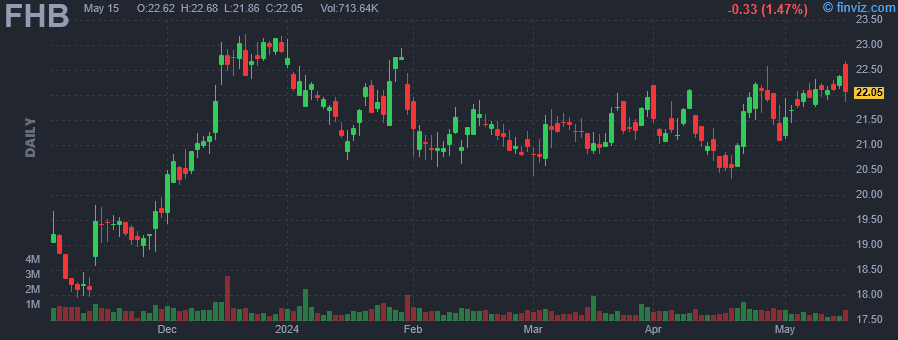
First Hawaiian, Inc. is a bank holding company engaged in the provision of banking services to consumer and commercial customers, including deposit products, lending services, and wealth management and trust services through its subsidiary, First Hawaiian Bank. It operates through the following business segments: Retail Banking, Commercial Banking, and Treasury and Other. The Retail Banking segment offers residential and commercial mortgage loans, home equity lines of credit, automobile loans and leases, personal lines of credit, installment loans, and small business loans and leases, deposits, such as checking, savings and time deposit accounts to consumers, small businesses and certain commercial customers. The Commercial Banking segment provides corporate banking, residential and commercial real estate loans, commercial lease financing, auto dealer financing, deposit products and credit cards that they provide primarily to middle market and large companies in Hawaii, Guam, Saipan, and California. The Treasury and Other segment relates to the treasury business, which consists of corporate asset and liability management activities, including interest rate risk management, as well as organizational units such as technology, operations, credit and risk management, human resources, finance, administration, marketing, and corporate and regulatory administration. The company was founded in 1858 and is headquartered in Honolulu, HI. |
| Insider Trading |
Relationship |
Date |
Transaction |
Cost |
#Shares |
Value ($) |
#Shares Total |
SEC Form 4 |
| Dods Christopher L | VICE CH & CHIEF OPERATING OFCR | Dec 01 '23 | Sale | 20.35 | 4,350 | 88,513 | 52,583 | Dec 04 09:46 PM |
|
|
|
 |
| Market Cap | 24.73B | EPS (ttm) | 10.05 |
| P/E | 11.46 | EPS this Y | 7.81% |
| Forward P/E | 17.97 | EPS next Y | 9.69% |
| PEG | 4.98 | EPS past 5Y | 25.36% |
| P/S | 0.60 | EPS next 5Y | 2.30% |
| P/B | 1.39 | EPS Q/Q | -50.83% |
| Dividend | 3.29% | Sales Q/Q | -1.44% |
| Insider Own | 0.00% | Inst Own | 34.14% |
| Insider Trans | - | Inst Trans | 5.87% |
| Short Float | 0.87% | Earnings | Apr 26/b |
| Analyst Recom | 1.87 | Target Price | 149.23 |
| Avg Volume | 759.17K | 52W Range | 91.38 - 142.91 |
|
|
|
|
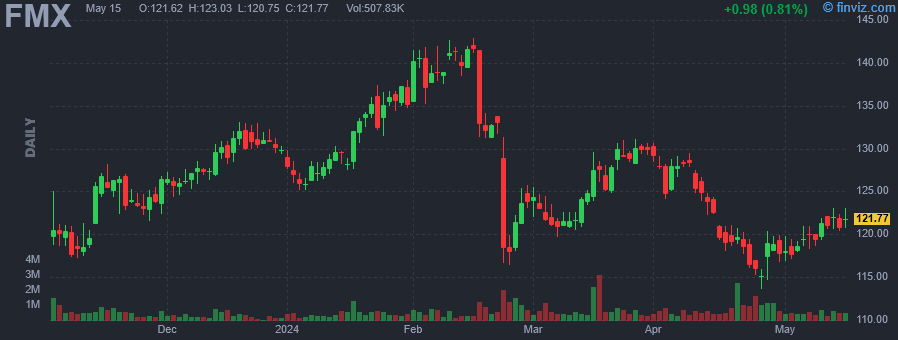
Fomento Economico Mexicano SAB de CV operates as a holding company, which engages in the production, distribution, and marketing of beverages. The firm also produces, markets, sells, and distributes Coca-Cola trademark beverages, including sparkling beverages. It operates through the following segments: Coca-Cola FEMSA; FEMSA-Comercio Proximity Division; FEMSA-Comercio Health Division; FEMSA-Comercio Fuel Division; Heineken Investment; and Other Business. The Coca-Cola FEMSA segment produces, markets, sells, and distributes Coca-Cola trademark beverages through standard bottler agreements in the territories where it operates. The FEMSA-Comercio Proximity Division segment operates a chain of small-format stores in Mexico. The FEMSA-Comercio Health Division segment involves drugstores and related operations. The FEMSA-Comercio Fuel Division segment deals with retail service stations for fuels, motor oils, and other car care products. The Heineken Investment segment invests in Heineken and distributes beer in a large number of countries. The Other Business segment involves other companies and corporate activities. The company was founded by Isaac Garza, Jose Calderon, Jose A. Muguerza, Francisco G. Sada, and Joseph M. Schnaider in 1890 and is headquartered in Monterrey, Mexico. |
|
| |
 |
| Market Cap | 8.02B | EPS (ttm) | 1.83 |
| P/E | 18.94 | EPS this Y | 15.92% |
| Forward P/E | 14.07 | EPS next Y | 15.42% |
| PEG | 1.10 | EPS past 5Y | 2.52% |
| P/S | 3.49 | EPS next 5Y | 17.30% |
| P/B | 3.47 | EPS Q/Q | 37.36% |
| Dividend | 1.39% | Sales Q/Q | 19.34% |
| Insider Own | 0.24% | Inst Own | 87.89% |
| Insider Trans | -7.65% | Inst Trans | -2.28% |
| Short Float | 1.71% | Earnings | Apr 26/b |
| Analyst Recom | 2.09 | Target Price | 39.07 |
| Avg Volume | 1.43M | 52W Range | 25.85 - 37.58 |
|
|
|
|
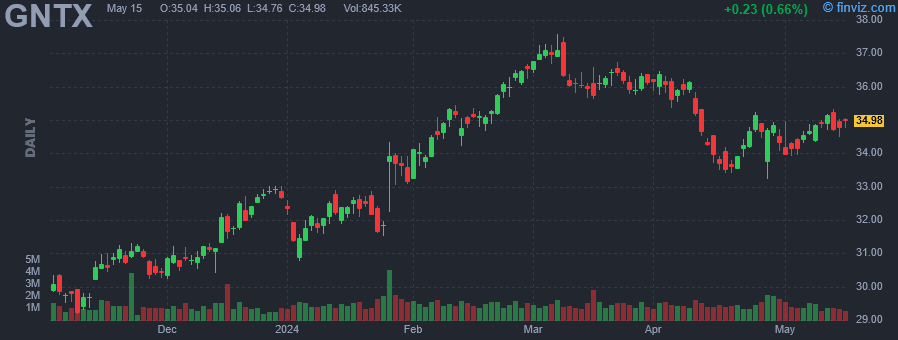
Gentex Corp. engages in the business of designing, developing, manufacturing, marketing, and supplying digital vision, connected car, dimmable glass, and fire protection technologies including automatic-dimming rearview and non-dimming mirrors and electronics for the automotive industry, dimmable aircraft windows for the aviation industry, and commercial smoke alarms and signaling devices for the fire protection industry. It operates under the Automotive Products and Other segments. The Automotive Products segment focuses on operating virtually all the foregoing facilities. The Other segment includes dimmable aircraft windows, fire protection products, nanofiber, and medical. The company was founded by Fred Bauer in 1974 and is headquartered in Zeeland, MI. |
| Insider Trading |
Relationship |
Date |
Transaction |
Cost |
#Shares |
Value ($) |
#Shares Total |
SEC Form 4 |
| Nash Kevin C | Chief Financial Officer | Feb 20 '24 | Option Exercise | 22.94 | 13,500 | 309,690 | 57,821 | Feb 21 03:07 PM | | Ryan Scott P | General Counsel | Feb 20 '24 | Option Exercise | 22.94 | 12,500 | 286,750 | 41,449 | Feb 21 03:13 PM | | Nash Kevin C | Chief Financial Officer | Feb 20 '24 | Sale | 33.04 | 13,500 | 446,087 | 44,321 | Feb 21 03:07 PM | | Ryan Scott P | General Counsel | Feb 20 '24 | Sale | 35.00 | 12,500 | 437,450 | 28,949 | Feb 21 03:13 PM | | GOODE GARY F | Director | Feb 09 '24 | Option Exercise | 24.21 | 7,000 | 169,470 | 36,180 | Feb 09 03:47 PM |
|
|
|
 |
| Market Cap | 83.08B | EPS (ttm) | 18.98 |
| P/E | 16.55 | EPS this Y | 8.37% |
| Forward P/E | 13.62 | EPS next Y | 11.98% |
| PEG | 1.75 | EPS past 5Y | 12.21% |
| P/S | 1.28 | EPS next 5Y | 9.44% |
| P/B | - | EPS Q/Q | -18.66% |
| Dividend | 0.83% | Sales Q/Q | 11.65% |
| Insider Own | 27.61% | Inst Own | 65.47% |
| Insider Trans | -0.03% | Inst Trans | -2.49% |
| Short Float | 1.38% | Earnings | Apr 26/b |
| Analyst Recom | 1.73 | Target Price | 343.45 |
| Avg Volume | 1.09M | 52W Range | 215.96 - 335.83 |
|
|
|
|
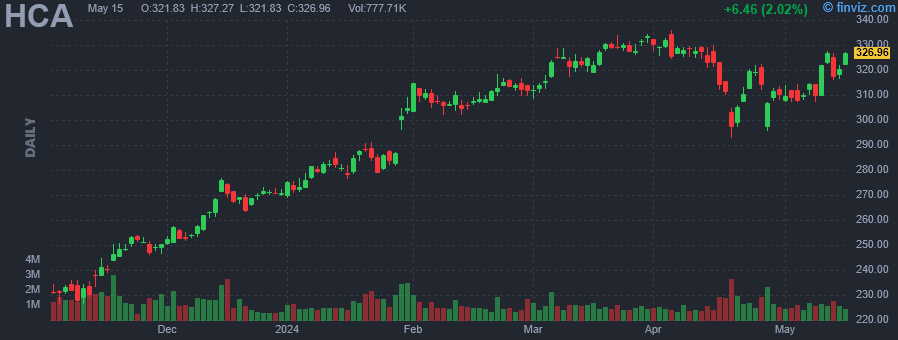
HCA Healthcare, Inc. is a health care services company engaged in operating hospitals, freestanding surgery centers and emergency care facilities, urgent care facilities, walk-in clinics, diagnostic and imaging centers, radiation and oncology therapy centers, comprehensive rehabilitation and physical therapy centers, physician practices, home health, hospice, outpatient physical therapy home and community-based services providers, and various other facilities. The firm operates general and acute care hospitals that offer medical and surgical services, including inpatient care, intensive care, cardiac care, diagnostic, and emergency services, and outpatient services, such as outpatient surgery, laboratory, radiology, respiratory therapy, cardiology, and physical therapy. The company was founded by Dr. Thomas F. Frist, Jr in 1968 and is headquartered in Nashville, TN. |
| Insider Trading |
Relationship |
Date |
Transaction |
Cost |
#Shares |
Value ($) |
#Shares Total |
SEC Form 4 |
| Wasserman Chad J | SVP and CIO | Mar 20 '24 | Sale | 330.25 | 876 | 289,299 | 1,576 | Mar 20 05:16 PM | | Wasserman Chad J | SVP and CIO | Mar 18 '24 | Option Exercise | 101.16 | 2,100 | 212,436 | 4,020 | Mar 20 05:16 PM | | Wasserman Chad J | SVP and CIO | Mar 18 '24 | Sale | 321.97 | 344 | 110,758 | 2,452 | Mar 20 05:16 PM | | Whalen Kathleen M | SVP & Chief Ethics Officer | Feb 09 '24 | Sale | 306.21 | 4,262 | 1,305,074 | 10,250 | Feb 13 07:03 PM | | Torres Kathryn A. | SVP-Payer Contracting & Align. | Feb 06 '24 | Option Exercise | 173.12 | 2,092 | 362,167 | 21,717 | Feb 08 07:13 PM |
|
|
|
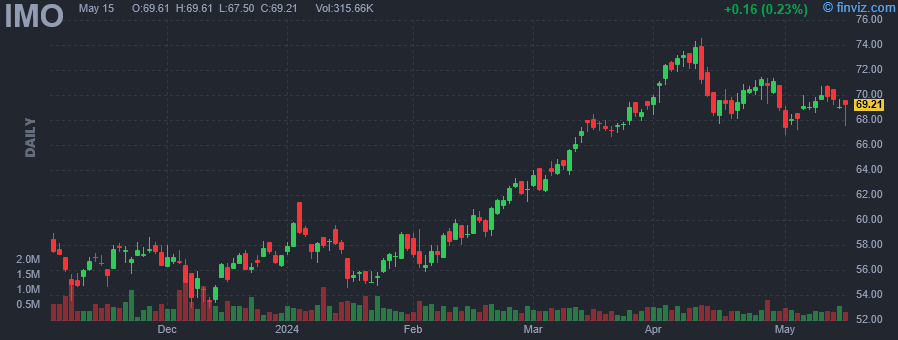 |
| Market Cap | 38.19B | EPS (ttm) | 6.29 |
| P/E | 11.33 | EPS this Y | 7.32% |
| Forward P/E | 10.22 | EPS next Y | 2.98% |
| PEG | - | EPS past 5Y | 23.26% |
| P/S | 1.07 | EPS next 5Y | -7.30% |
| P/B | 2.27 | EPS Q/Q | -15.51% |
| Dividend | 2.40% | Sales Q/Q | -10.77% |
| Insider Own | 69.62% | Inst Own | 25.23% |
| Insider Trans | 0.00% | Inst Trans | - |
| Short Float | 10.64% | Earnings | Apr 26/b |
| Analyst Recom | 2.53 | Target Price | 73.02 |
| Avg Volume | 377.92K | 52W Range | 44.46 - 74.58 |
|
|
|
|
Imperial Oil Ltd. engages in the exploration, production, and sale of crude oil and natural gas. It operates through the following business segments: Upstream, Downstream, Chemical, and Corporate and Other. The Upstream segment includes the exploration and production of crude oil, natural gas, synthetic oil, and bitumen. The Downstream segment focuses on refining crude oil into petroleum products. The Chemical segment manufactures and markets hydrocarbon-based chemicals and chemical products. The Corporate and Other segment covers assets and liabilities that do not specifically relate to business segments. The company was founded on September 8, 1880 and is headquartered in Calgary, Canada. |
|
|
