 |
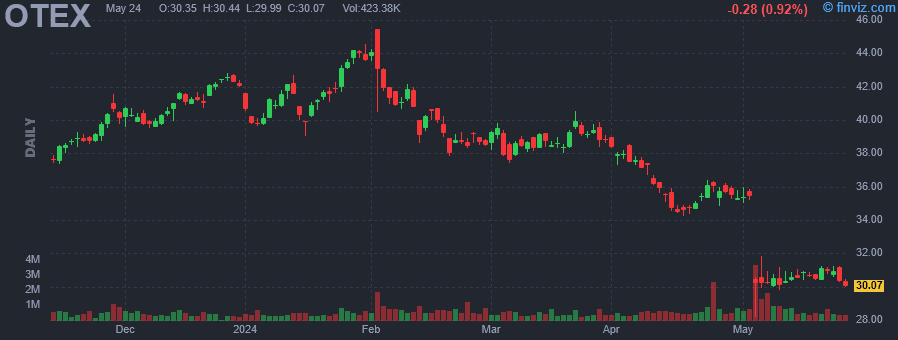
| Market Cap | 8.27B | EPS (ttm) | 0.62 |
| P/E | 49.38 | EPS this Y | 29.59% |
| Forward P/E | 8.55 | EPS next Y | -16.52% |
| PEG | 3.60 | EPS past 5Y | -9.39% |
| P/S | 1.40 | EPS next 5Y | 13.70% |
| P/B | 2.01 | EPS Q/Q | 69.25% |
| Dividend | 3.29% | Sales Q/Q | 16.27% |
| Insider Own | 2.19% | Inst Own | 69.64% |
| Insider Trans | 0.00% | Inst Trans | -0.51% |
| Short Float | 1.92% | Earnings | May 02/a |
| Analyst Recom | 2.08 | Target Price | 42.14 |
| Avg Volume | 631.86K | 52W Range | 32.04 - 45.47 |
|
|
| Today | Downgrade |
BMO Capital Markets |
Outperform → Market Perform |
$50 → $38 |
|
|
|
Open Text Corp. engages in the design, development, marketing and sales of enterprise information management software and solutions. It includes customer experience management (CEM), digital process automation, business network, and enterprise content management, discovery, security, and artificial intelligence (AI) and analytics solutions. It also offers consulting, managed, and learning services. The company was founded on June 26, 1991 and is headquartered in Waterloo, Canada. |
|
 |
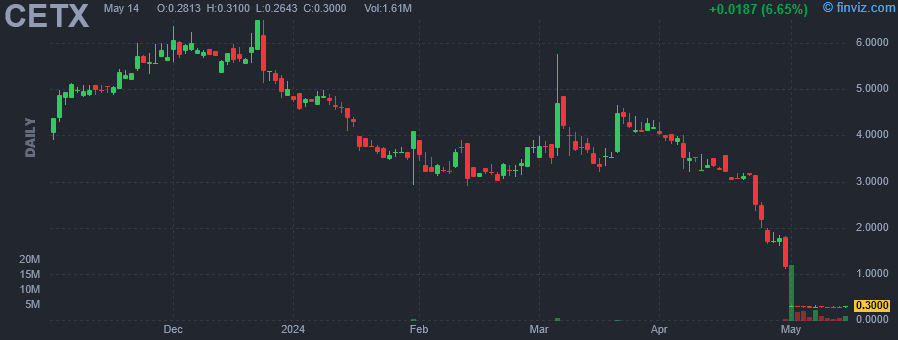 |
| Market Cap | 0.30M | EPS (ttm) | -4.29 |
| P/E | - | EPS this Y | - |
| Forward P/E | - | EPS next Y | - |
| PEG | - | EPS past 5Y | 50.20% |
| P/S | 0.00 | EPS next 5Y | - |
| P/B | 0.04 | EPS Q/Q | 77.03% |
| Dividend | - | Sales Q/Q | 41.00% |
| Insider Own | 6.40% | Inst Own | 1.96% |
| Insider Trans | 0.00% | Inst Trans | -89.46% |
| Short Float | 1.41% | Earnings | Feb 12/a |
| Analyst Recom | 1.00 | Target Price | 11.00 |
| Avg Volume | 409.33K | 52W Range | 0.28 - 11.45 |
|
|
|
|
Cemtrex, Inc. engages in the provision of solutions in the technology industry. It operates through the following segments: Security, Industrial Services, and Cemtrex Corporate. The Security segment provides end-to-end security solutions to meet corporate, industrial, and governmental security challenges. The Industrial Services segment offers single-source expertise and services for rigging, millwrighting, in plant maintenance, equipment erection, relocation, and disassembly to diversified customers. The Cemtrex Corporate segment refers to the holding company of the other two segments. The company was founded on April 27, 1998 and is headquartered in Hauppauge, NY. |
| Insider Trading |
Relationship |
Date |
Transaction |
Cost |
#Shares |
Value ($) |
#Shares Total |
SEC Form 4 |
| GOVIL SAAGAR | CEO | Aug 30 '23 | Buy | 0.95 | 15,100 | 14,380 | 132,298 | Sep 05 04:30 PM | | GOVIL SAAGAR | CFO | Aug 25 '23 | Buy | 0.91 | 7,100 | 6,461 | 116,486 | Aug 29 04:15 PM | | GOVIL SAAGAR | CFO | Aug 24 '23 | Buy | 0.93 | 3,000 | 2,789 | 109,386 | Aug 29 04:15 PM | | GOVIL SAAGAR | CFO | Jun 15 '23 | Buy | 0.97 | 27,798 | 26,836 | 106,386 | Jun 21 08:23 AM | | GOVIL SAAGAR | CEO | Jun 14 '23 | Buy | 0.93 | 8,028 | 7,485 | 78,588 | Jun 14 04:56 PM |
|
|
|
 |
| Market Cap | 583.11M | EPS (ttm) | 1.90 |
| P/E | 11.42 | EPS this Y | -42.83% |
| Forward P/E | 5.37 | EPS next Y | 231.06% |
| PEG | 1.14 | EPS past 5Y | -1.82% |
| P/S | 0.38 | EPS next 5Y | 10.00% |
| P/B | 0.79 | EPS Q/Q | -116.06% |
| Dividend | 2.87% | Sales Q/Q | -5.41% |
| Insider Own | 4.83% | Inst Own | 86.63% |
| Insider Trans | -1.48% | Inst Trans | -1.99% |
| Short Float | 1.22% | Earnings | May 03/b |
| Analyst Recom | 1.33 | Target Price | 38.33 |
| Avg Volume | 145.13K | 52W Range | 23.92 - 40.85 |
|
|
|
|
Advansix, Inc. engages in the business of building and construction, fertilizers, agrochemicals, plastics, solvents, packaging, paints, coatings, adhesives and electronics. The firm's products include nylon resin, caprolactam, ammonium sulfate fertilizer, and chemical intermediates. It offers products to the carpet, engineering plastic, food packaging, building and construction, composites, plant nutrition, paints, and coating markets. The company was founded on May 4, 2016 and is headquartered in Parsippany, NJ. |
| Insider Trading |
Relationship |
Date |
Transaction |
Cost |
#Shares |
Value ($) |
#Shares Total |
SEC Form 4 |
| Kane Erin N | Chief Executive Officer | Apr 04 '24 | Sale | 28.08 | 3,002 | 84,296 | 552,755 | Apr 04 04:18 PM | | Kane Erin N | Chief Executive Officer | Apr 02 '24 | Sale | 27.86 | 613 | 17,078 | 555,757 | Apr 04 04:18 PM | | Kintiroglou Achilles B. | SVP, General Counsel | Apr 01 '24 | Sale | 27.69 | 4,000 | 110,766 | 38,996 | Apr 01 06:00 PM | | Kane Erin N | Chief Executive Officer | Apr 01 '24 | Sale | 27.96 | 1,385 | 38,725 | 556,370 | Apr 01 05:57 PM | | Kane Erin N | Chief Executive Officer | Mar 28 '24 | Sale | 28.30 | 5,000 | 141,500 | 557,755 | Apr 01 05:57 PM |
|
|
| |
 |
| Market Cap | 637.42M | EPS (ttm) | 0.90 |
| P/E | 17.42 | EPS this Y | -46.65% |
| Forward P/E | 16.14 | EPS next Y | 43.54% |
| PEG | 3.48 | EPS past 5Y | 6.00% |
| P/S | 0.73 | EPS next 5Y | 5.00% |
| P/B | 1.12 | EPS Q/Q | -116.10% |
| Dividend | - | Sales Q/Q | -7.59% |
| Insider Own | 1.12% | Inst Own | 105.96% |
| Insider Trans | -1.95% | Inst Trans | -2.17% |
| Short Float | 11.30% | Earnings | May 02/a |
| Analyst Recom | 1.50 | Target Price | 27.88 |
| Avg Volume | 354.72K | 52W Range | 16.00 - 23.90 |
|
|
|
|
Varex Imaging Corp. engages in the design, manufacture, and sale of imaging components. It operates through the Medical and Industrial segments. The Medical segment delivers and services x-ray imaging components, including X-ray tubes, digital detectors, high voltage connectors, image-processing software and workstations, and three-dimensional reconstruction software. The Industrial segment offers x-ray imaging products for use in security, and nondestructive testing and inspection applications. The company was founded in 2016 and is headquartered in Salt Lake City, UT. |
| Insider Trading |
Relationship |
Date |
Transaction |
Cost |
#Shares |
Value ($) |
#Shares Total |
SEC Form 4 |
| Honeysett Kimberley E. | SVP and CLO | Mar 15 '24 | Sale | 17.37 | 2,860 | 49,678 | 2,853 | Mar 19 04:51 PM | | Honeysett Kimberley E. | SVP and General Counsel | Nov 22 '23 | Sale | 19.72 | 6,174 | 121,751 | 0 | Nov 27 04:43 PM | | Kunkel Jay K. | Director | May 08 '23 | Sale | 21.90 | 9,120 | 199,728 | 11,598 | May 10 06:20 PM |
|
|
|
 |
| Market Cap | 268.75M | EPS (ttm) | 1.10 |
| P/E | 12.35 | EPS this Y | -19.34% |
| Forward P/E | 6.40 | EPS next Y | 45.43% |
| PEG | 0.62 | EPS past 5Y | -11.92% |
| P/S | 0.38 | EPS next 5Y | 20.00% |
| P/B | 0.65 | EPS Q/Q | 184.75% |
| Dividend | - | Sales Q/Q | -9.48% |
| Insider Own | 5.68% | Inst Own | 78.13% |
| Insider Trans | 0.45% | Inst Trans | -6.69% |
| Short Float | 2.01% | Earnings | May 02/a |
| Analyst Recom | 1.67 | Target Price | 28.00 |
| Avg Volume | 191.57K | 52W Range | 14.89 - 27.16 |
|
|
|
|
DMC Global, Inc. is a holding company, which engages in the provision of technical products and services in the energy, industrial, and infrastructure markets. It operates through the following business Segment: Arcadia Products, NobelClad and DynaEnergetics. The Arcadia business segment designs, engineers, fabricates, and finishes aluminum framing systems, windows, curtain walls, storefronts, entrance systems, and interior partitions to the commercial construction market. The NobelClad segment produces explosion-welded clad metal plates for the construction of corrosion resistant industrial processing equipment and specialized transition joints. The DynaEnergetics segment designs, manufactures, and distributes products utilized by the global oil and gas industry principally for the perforation of oil and gas wells. The company was founded in 1965 and is headquartered in Broomfield, CO. |
| Insider Trading |
Relationship |
Date |
Transaction |
Cost |
#Shares |
Value ($) |
#Shares Total |
SEC Form 4 |
| Grieves Ian | Pres & Mng Dir, DynaEnergetics | Mar 14 '24 | Option Exercise | 0.00 | 3,541 | 0 | 67,178 | Mar 18 05:44 PM | | Grieves Ian | Pres & Mng Dir, DynaEnergetics | Mar 02 '24 | Option Exercise | 0.00 | 4,614 | 0 | 64,660 | Mar 05 05:26 PM | | Nobili Antoine | President of NobelClad | Mar 02 '24 | Option Exercise | 0.00 | 1,231 | 0 | 14,622 | Mar 05 05:31 PM | | SHEPSTON MICHELLE H | Chief Legal Officer | Mar 01 '24 | Option Exercise | 0.00 | 318 | 0 | 46,387 | Mar 05 05:29 PM | | Grieves Ian | Pres & Mng Dir, DynaEnergetics | Feb 23 '24 | Option Exercise | 0.00 | 2,150 | 0 | 61,597 | Feb 26 04:51 PM |
|
|
| |
 |
| Market Cap | 3.25M | EPS (ttm) | -3.85 |
| P/E | - | EPS this Y | 48.15% |
| Forward P/E | - | EPS next Y | 14.29% |
| PEG | - | EPS past 5Y | - |
| P/S | 3.38 | EPS next 5Y | - |
| P/B | - | EPS Q/Q | 38.81% |
| Dividend | - | Sales Q/Q | -5.67% |
| Insider Own | 73.81% | Inst Own | 0.46% |
| Insider Trans | 0.00% | Inst Trans | - |
| Short Float | 2.83% | Earnings | Apr 02/b |
| Analyst Recom | 1.00 | Target Price | 1.50 |
| Avg Volume | 761.41K | 52W Range | 0.17 - 7.14 |
|
|
|
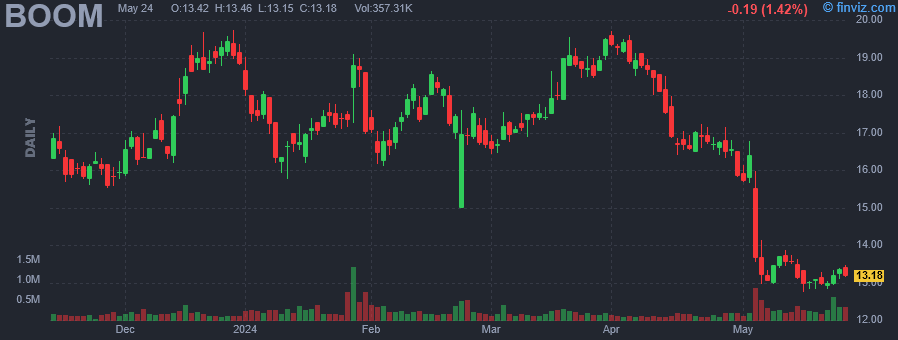
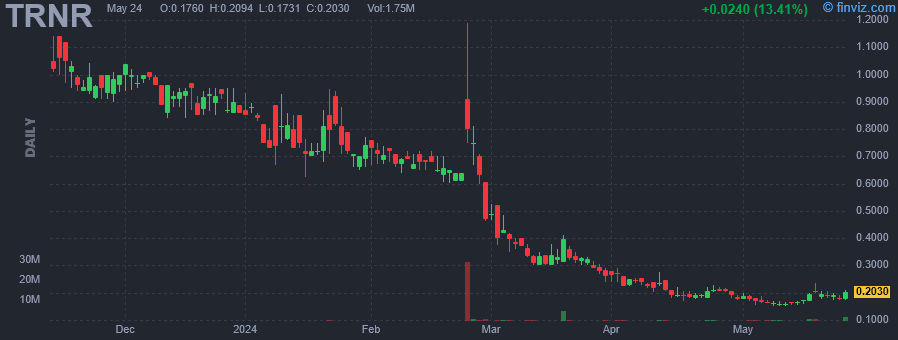
Apr-26-24 07:00AM
|
Interactive Strength Inc. (Nasdaq: TRNR) Strengthens Balance Sheet by Partially Converting Senior Loan to Equity and Extending the Maturity
(GlobeNewswire) |
|
Apr-10-24 07:00AM
|
Interactive Strength Inc. (Nasdaq: TRNR) to Exhibit CLMBR at FIBO Global Fitness, the World's Largest Trade Show for Fitness, Wellness and Health on April 11-14
(GlobeNewswire) |
|
Apr-01-24 09:17PM
|
Interactive Strength Inc. (Nasdaq: TRNR) Reports Fourth Quarter 2023 Results
(GlobeNewswire) |
|
Mar-06-24 07:00AM
|
Interactive Strength Inc. (Nasdaq: TRNR) to Exhibit Both CLMBR and FORME Lift at IHRSA in Los Angeles March 6-8
(GlobeNewswire) -7.44% |
|
Mar-05-24 07:00AM
|
Interactive Strength Inc. (Nasdaq: TRNR) Receives Letter From Nasdaq Confirming That the Company Complies With the Stockholders' Equity Requirement
(GlobeNewswire) +7.23% |
|
Feb-26-24 07:00AM
|
Interactive Strength Inc. (Nasdaq: TRNR) Enters Into Exclusive Worldwide Distribution Agreement With WOODWAY to Sell and Distribute CLMBR
(GlobeNewswire) +25.00% |
|
Feb-07-24 07:00AM
|
Interactive Strength Inc. (Nasdaq: TRNR) Completes Acquisition of CLMBR, Creating a High-growth, B2B Focused, Connected Fitness Platform
(GlobeNewswire) -6.63% |
|
Jan-26-24 07:00AM
|
Interactive Strength, Inc. is Expanding its Presence in the Fast-growing Golf Performance Market as a New Exhibitor at the 2024 PGA Show
(NewMediaWire) |
|
Jan-23-24 07:00AM
|
Interactive Strength, Inc. d/b/a FORME (Nasdaq: TRNR) Amends Terms of CLMBR Acquisition and Expects to Close in January 2024, Creating a High-growth, B2B Focused, Connected Fitness Platform
(NewMediaWire) |
|
Nov-14-23 07:51PM
|
Interactive Strength Inc. d/b/a FORME Reports Third Quarter 2023 Results
(GlobeNewswire) |
|
Interactive Strength, Inc. engages in the development and sale of an at-home fitness technology platform. It offers Forme, a digital fitness service that combines fitness hardware products with personal training and coaching services. It operates under the following geographical segments: the United States, the United Kingdom, and Taiwan. The company was founded by Trent A. Ward and Ben Bartlett on May 8, 2017 and is headquartered in Austin, TX. |
| Insider Trading |
Relationship |
Date |
Transaction |
Cost |
#Shares |
Value ($) |
#Shares Total |
SEC Form 4 |
| Wickens Bradley James | 10% Owner | Jun 01 '23 | Buy | 5.22 | 5,000 | 26,080 | 1,704,891 | Jun 02 10:54 AM | | Wickens Bradley James | 10% Owner | May 22 '23 | Buy | 5.71 | 20,000 | 114,216 | 1,699,891 | May 23 06:26 AM | | Wickens Bradley James | 10% Owner | May 17 '23 | Buy | 3.98 | 3,940 | 15,675 | 1,679,891 | May 19 06:15 AM | | Wickens Bradley James | 10% Owner | May 15 '23 | Buy | 3.81 | 4,800 | 18,288 | 1,675,951 | May 16 07:54 AM | | Wickens Bradley James | 10% Owner | May 12 '23 | Buy | 3.55 | 20,200 | 71,643 | 1,671,151 | May 16 07:54 AM |
|
|
|
 |
| Market Cap | 0.29M | EPS (ttm) | -2.55 |
| P/E | - | EPS this Y | - |
| Forward P/E | - | EPS next Y | - |
| PEG | - | EPS past 5Y | -402.26% |
| P/S | 0.03 | EPS next 5Y | - |
| P/B | 0.03 | EPS Q/Q | -1129.42% |
| Dividend | - | Sales Q/Q | 161.93% |
| Insider Own | 65.24% | Inst Own | 0.00% |
| Insider Trans | 0.00% | Inst Trans | - |
| Short Float | 1.03% | Earnings | - |
| Analyst Recom | - | Target Price | - |
| Avg Volume | 275.20K | 52W Range | 0.24 - 8.68 |
|
|
|
|
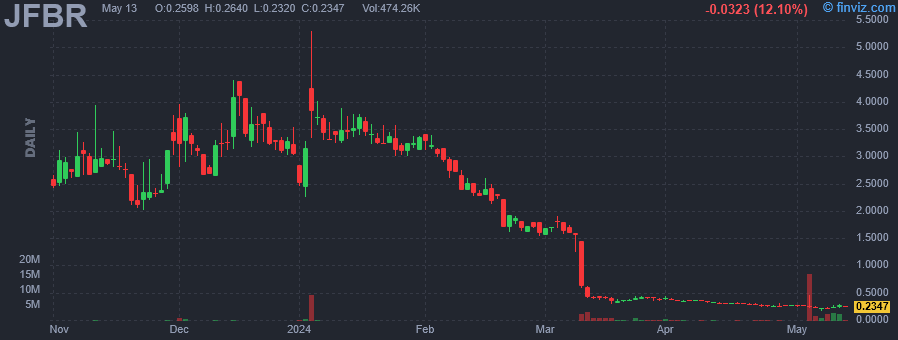
Jeffs' Brands Ltd. operates as an e-commerce consumer products goods company. It operates as a holding company of three other e-commerce companies that operate online stores for the sale of various consumer products on the Amazon online marketplace, utilizing the Fulfillment by Amazon, or FBA model-Smart Repair Pro, purex Corp., or Purex, and Top Rank Ltd, or Top Rank. The company was founded by Viki Hakmon on March 7, 2021 and is headquartered in Bnei Braq, Israel. |
|
| |
 |
| Market Cap | 21.54M | EPS (ttm) | - |
| P/E | - | EPS this Y | - |
| Forward P/E | - | EPS next Y | - |
| PEG | - | EPS past 5Y | - |
| P/S | - | EPS next 5Y | - |
| P/B | - | EPS Q/Q | - |
| Dividend | - | Sales Q/Q | - |
| Insider Own | 0.00% | Inst Own | - |
| Insider Trans | - | Inst Trans | - |
| Short Float | - | Earnings | - |
| Analyst Recom | - | Target Price | - |
| Avg Volume | 3.70M | 52W Range | 1.12 - 11.39 |
|
|
|
|
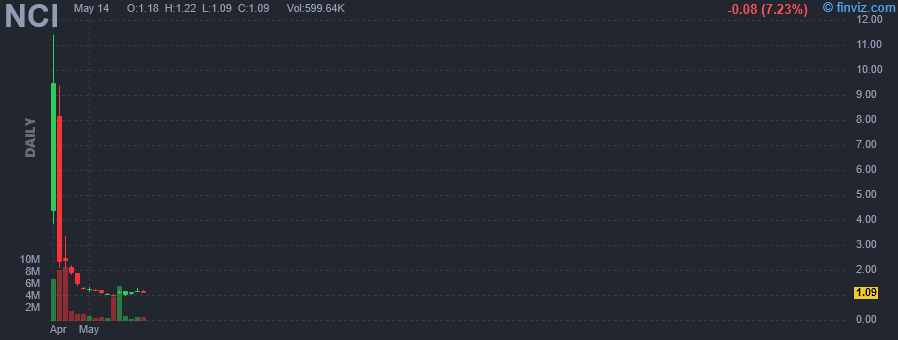
Neo-Concept International Group Holdings Ltd. engages in providing one-stop apparel solution services. Its services include product design and development, raw material sourcing, production and quality control, and logistics management. It operates through the following geographical segments: The United States and Canada, The United Kingdom, and Others. The company was founded in 1990 and is headquartered in Hong Kong. |
|
|
 |
| Market Cap | 56.81M | EPS (ttm) | -6.22 |
| P/E | - | EPS this Y | 55.84% |
| Forward P/E | - | EPS next Y | 9.33% |
| PEG | - | EPS past 5Y | -126.41% |
| P/S | - | EPS next 5Y | - |
| P/B | - | EPS Q/Q | -515.14% |
| Dividend | - | Sales Q/Q | - |
| Insider Own | 26.05% | Inst Own | 11.40% |
| Insider Trans | 0.00% | Inst Trans | -3.09% |
| Short Float | 17.85% | Earnings | Apr 04/a |
| Analyst Recom | 1.80 | Target Price | 33.40 |
| Avg Volume | 442.35K | 52W Range | 5.23 - 22.49 |
|
|
|
|
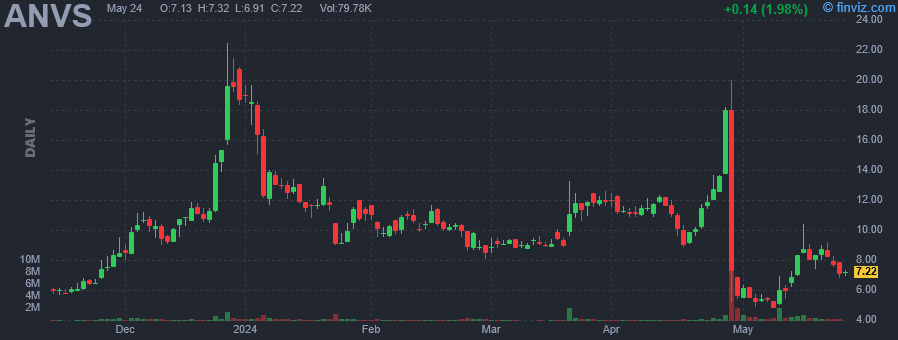
Annovis Bio, Inc. is a clinical stage drug platform company, which engages in the development of drugs which aim to treat neurodegenerative diseases such as Alzheimer's (AD) and Parkinson's (PD). Its lead product candidate, Buntanetap, is designed to address AD, PD, and potentially other chronic neurodegenerative diseases. Its product pipeline also includes ANVS405 and ANVS301, which focus on the treatment of traumatic brain injury, stroke, and advanced AD. The company was founded by Maria Luisa Maccecchini in May 2008 and is headquartered in Malvern, PA. |
|
|
 |
| Market Cap | 217.72M | EPS (ttm) | -1.45 |
| P/E | - | EPS this Y | 26.82% |
| Forward P/E | - | EPS next Y | 56.20% |
| PEG | - | EPS past 5Y | -438.13% |
| P/S | 0.52 | EPS next 5Y | - |
| P/B | 0.60 | EPS Q/Q | -58.17% |
| Dividend | - | Sales Q/Q | -62.21% |
| Insider Own | 7.83% | Inst Own | 66.56% |
| Insider Trans | -5.28% | Inst Trans | 2.03% |
| Short Float | 26.05% | Earnings | May 02/a |
| Analyst Recom | 2.33 | Target Price | 4.06 |
| Avg Volume | 4.86M | 52W Range | 1.46 - 7.78 |
|
|
|
|
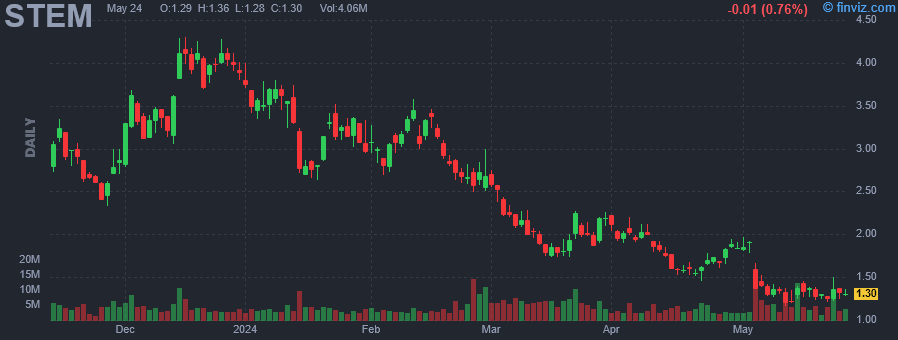
Stem, Inc. engages in the provision of an energy storage system, hardware, ongoing software platform and professional services, and solar asset performance monitoring and control. The company was founded in 2009 and is headquartered in San Francisco, CA. |
| Insider Trading |
Relationship |
Date |
Transaction |
Cost |
#Shares |
Value ($) |
#Shares Total |
SEC Form 4 |
| Russo Alan | Chief Revenue Officer | Apr 30 '24 | Sale | 1.87 | 24,142 | 45,146 | 212,910 | Apr 30 05:21 PM | | BUSH WILLIAM JOHN | Chief Financial Officer | Apr 30 '24 | Sale | 1.87 | 24,035 | 44,945 | 390,217 | Apr 30 05:21 PM | | Patel Prakesh | Chief Strategy Officer | Apr 30 '24 | Sale | 1.87 | 23,863 | 44,624 | 181,668 | Apr 30 05:22 PM | | Laureles Saul R. | Chief Legal Officer | Apr 30 '24 | Sale | 1.87 | 822 | 1,537 | 150,990 | Apr 30 05:21 PM | | Russo Alan | Chief Revenue Officer | Apr 28 '24 | Option Exercise | 0.00 | 69,254 | 0 | 237,052 | Apr 30 05:21 PM |
|
|
|
