 |
| Market Cap | 19.48M | EPS (ttm) | - |
| P/E | - | EPS this Y | - |
| Forward P/E | - | EPS next Y | - |
| PEG | - | EPS past 5Y | - |
| P/S | - | EPS next 5Y | - |
| P/B | - | EPS Q/Q | - |
| Dividend | - | Sales Q/Q | - |
| Insider Own | 68.27% | Inst Own | - |
| Insider Trans | 0.00% | Inst Trans | - |
| Short Float | - | Earnings | - |
| Analyst Recom | - | Target Price | - |
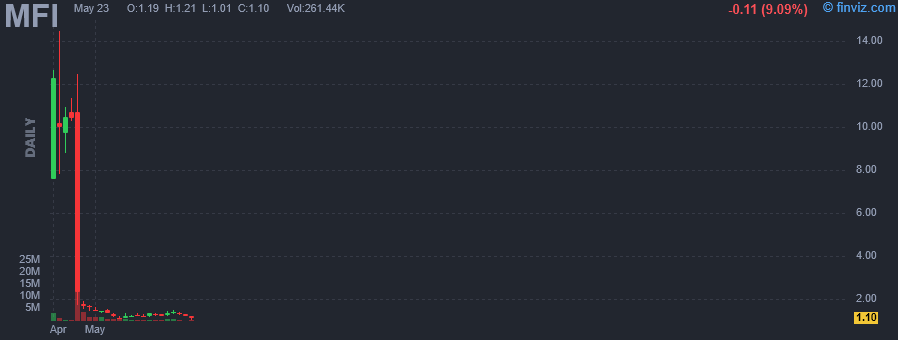
| Avg Volume | 4.59M | 52W Range | 1.43 - 14.49 |
|
|
|
|
mF International Ltd. is a holding company, which engages in the development and provision of financial trading solutions through its subsidiary. It offers real-time mission critical forex, bullion and commodities trading platform solutions, financial value-added services, mobile applications, and financial information for brokers and institutional clients via internet or platform as software as a service. The company was founded on June 15, 2022 and is headquartered in Hong Kong. |
|
 |
 |
| Market Cap | 346.24M | EPS (ttm) | 0.18 |
| P/E | 41.03 | EPS this Y | -32.44% |
| Forward P/E | 3.87 | EPS next Y | 28.10% |
| PEG | - | EPS past 5Y | -25.46% |
| P/S | 0.14 | EPS next 5Y | - |
| P/B | 0.58 | EPS Q/Q | -144.18% |
| Dividend | 7.84% | Sales Q/Q | -5.25% |
| Insider Own | 59.63% | Inst Own | 36.76% |
| Insider Trans | 0.00% | Inst Trans | -1.96% |
| Short Float | 16.76% | Earnings | May 08/a |
| Analyst Recom | 2.43 | Target Price | 14.80 |
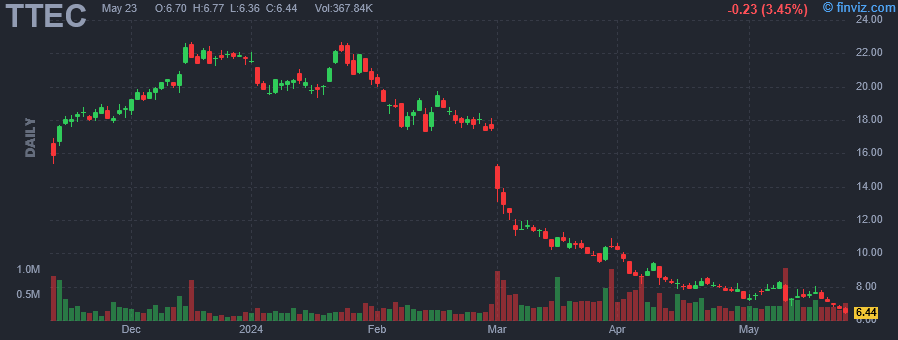
| Avg Volume | 370.41K | 52W Range | 7.27 - 36.70 |
|
|
|
|
TTEC Holdings, Inc. is a digital global customer experience technology and services company. It focuses on the design, implementation, and delivery of transformative solutions for many brands. The firm operates through the following segments: TTEC Digital and TTEC Engage. The TTEC Digital segment provides design, build, and operate tech-enabled, insight-driven CX solutions. The TTEC Engage segment provides digitally-enabled customer care, acquisition, and fraud prevention services. The company was founded by Kenneth D. Tuchman in 1982 and is headquartered in Greenwood Village, CO. |
| Insider Trading |
Relationship |
Date |
Transaction |
Cost |
#Shares |
Value ($) |
#Shares Total |
SEC Form 4 |
| Bourret Francois | CHIEF ACCOUNTING OFFICER | Apr 14 '24 | Option Exercise | 0.00 | 1,191 | 0 | 6,004 | Apr 16 04:44 PM | | McLean Margaret B | GC & CRO | Apr 14 '24 | Option Exercise | 0.00 | 1,634 | 0 | 54,757 | Apr 16 04:51 PM | | Bourret Francois | CHIEF ACCOUNTING OFFICER | Mar 17 '24 | Option Exercise | 0.00 | 2,718 | 0 | 5,832 | Mar 19 04:35 PM | | Swanback Michelle R | PRESIDENT, CEO, TTEC ENGAGE | Mar 16 '24 | Option Exercise | 0.00 | 10,986 | 0 | 19,672 | Mar 19 04:31 PM | | McLean Margaret B | GC & CRO | Mar 04 '24 | Option Exercise | 0.00 | 612 | 0 | 52,306 | Mar 06 04:39 PM |
|
|
|
 |
| Market Cap | 14.96B | EPS (ttm) | -7.00 |
| P/E | - | EPS this Y | -18.91% |
| Forward P/E | 5.47 | EPS next Y | -1.70% |
| PEG | - | EPS past 5Y | - |
| P/S | 0.10 | EPS next 5Y | -7.67% |
| P/B | 1.11 | EPS Q/Q | -941.30% |
| Dividend | 8.80% | Sales Q/Q | 6.28% |
| Insider Own | 17.52% | Inst Own | 59.06% |
| Insider Trans | 0.00% | Inst Trans | -0.06% |
| Short Float | 5.46% | Earnings | Mar 28/b |
| Analyst Recom | 3.10 | Target Price | 22.76 |
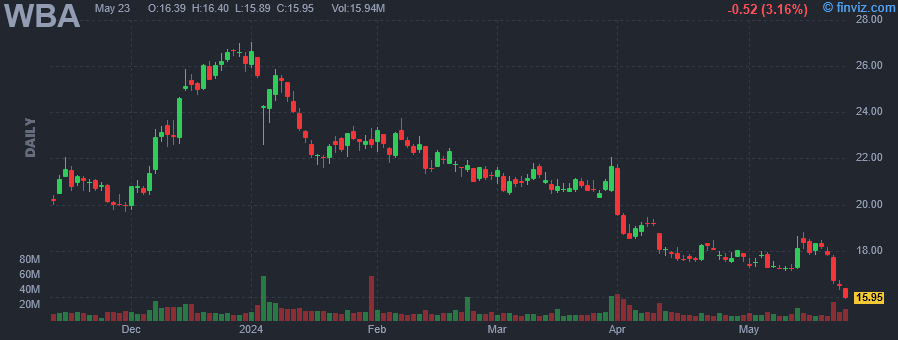
| Avg Volume | 12.55M | 52W Range | 17.49 - 35.36 |
|
|
|
|
Walgreens Boots Alliance, Inc. engages in the provision of healthcare and retail pharmacy services. It operates through the following segments: United States Retail Pharmacy, International, and United States Healthcare. The US Retail Pharmacy segment includes the operation of retail drugstores, health and wellness services, specialty and home delivery pharmacy services, and equity method investment. The International segment offers pharmacy-led health and beauty retail businesses outside the US and the pharmaceutical wholesaling and distribution business in Germany. The US Healthcare segment delivers improved health outcomes and lower costs for payors and providers through owned and partnered assets. The company was founded by Charles R. Walgreen and John Boot in 1909 and is headquartered in Deerfield, IL. |
| Insider Trading |
Relationship |
Date |
Transaction |
Cost |
#Shares |
Value ($) |
#Shares Total |
SEC Form 4 |
| Bhandari Inderpal S | Director | Apr 11 '24 | Buy | 18.05 | 3,000 | 54,150 | 3,000 | Apr 15 05:45 PM | | Mahajan Manmohan | EVP and Global CFO | Apr 02 '24 | Buy | 19.38 | 6,000 | 116,280 | 166,969 | Apr 02 06:40 PM | | Walgreens Boots Alliance, Inc. | 10% Owner | Feb 07 '24 | Sale | 235.41 | 4,212,395 | 991,639,907 | 26,277,561 | Feb 09 07:00 AM | | JARRETT VALERIE B | Director | Jan 29 '24 | Buy | 22.44 | 4,456 | 99,993 | 4,456 | Jan 31 04:11 PM | | SCHLICHTING NANCY M | Director | Jan 16 '24 | Sale | 23.05 | 15,209 | 350,567 | 0 | Jan 18 04:18 PM |
|
|
| |
 |
| Market Cap | 502.80M | EPS (ttm) | 0.24 |
| P/E | 17.69 | EPS this Y | -73.96% |
| Forward P/E | 93.11 | EPS next Y | -28.00% |
| PEG | - | EPS past 5Y | 22.88% |
| P/S | 0.05 | EPS next 5Y | - |
| P/B | 1.76 | EPS Q/Q | -103.42% |
| Dividend | 2.86% | Sales Q/Q | 2.43% |
| Insider Own | 37.52% | Inst Own | 57.21% |
| Insider Trans | -5.84% | Inst Trans | -1.09% |
| Short Float | 4.11% | Earnings | May 07/a |
| Analyst Recom | 1.80 | Target Price | 8.30 |
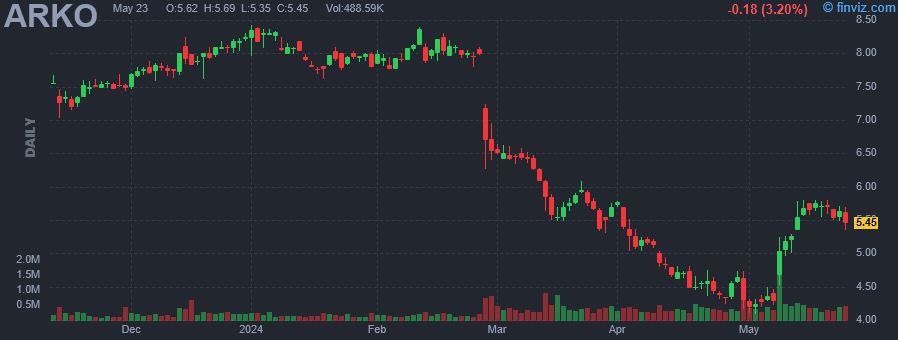
| Avg Volume | 366.74K | 52W Range | 4.16 - 8.55 |
|
|
|
|
ARKO Corp. engages in the business of operating convenience stores and as wholesalers of fuel. It operates through the following segments: Retail, Wholesale, Fleet Fueling, GPM Petroleum (GPMP) LP, and All Other. The Retail segment includes the operation of a chain of retail stores, which are convenience stores selling fuel products. The Wholesale segment focuses on supplying fuel to independent dealers on either a cost plus or consignment basis. The Fleet Fueling segment is involved in proprietary and third-party card lock locations, and issuance of proprietary fuel cards that provide customers access to a network of fueling sites. The GPMP segment sells and supplies fuel to GPM and its subsidiaries that sell fuel in the retail and wholesale segments. The company was founded in 2003 and is headquartered in Richmond, VA. |
| Insider Trading |
Relationship |
Date |
Transaction |
Cost |
#Shares |
Value ($) |
#Shares Total |
SEC Form 4 |
| Willner Morris | 10% Owner | Feb 28 '24 | Sale | 6.76 | 2,792,631 | 18,878,186 | 11,683,980 | Mar 01 07:23 PM |
|
|
|
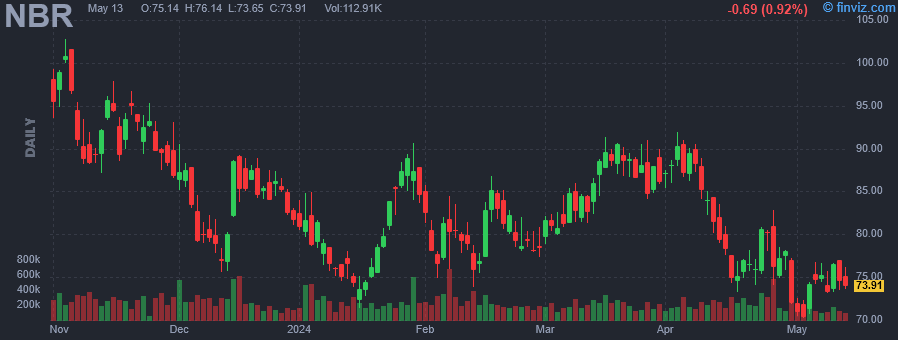 |
| Market Cap | 677.24M | EPS (ttm) | -12.98 |
| P/E | - | EPS this Y | 68.00% |
| Forward P/E | 11.76 | EPS next Y | 248.51% |
| PEG | - | EPS past 5Y | 44.00% |
| P/S | 0.23 | EPS next 5Y | -12.60% |
| P/B | 2.04 | EPS Q/Q | -210.22% |
| Dividend | - | Sales Q/Q | -5.83% |
| Insider Own | 7.90% | Inst Own | 80.63% |
| Insider Trans | 0.00% | Inst Trans | -2.18% |
| Short Float | 11.71% | Earnings | Apr 24/a |
| Analyst Recom | 2.92 | Target Price | 105.22 |
| Avg Volume | 242.75K | 52W Range | 71.42 - 141.47 |
|
|
|
|
Nabors Industries Ltd. engages in the provision of off shore platform rigs. It also provides performance tools, directional drilling services, tubular running services, and technologies for its own rig fleet and those operated by third parties. It manufactures drilling equipment and drilling rig instrumentation. It operates through the following business segments: U.S. Drilling, Canada Drilling, International Drilling, Drilling Solutions, and Rig Technologies. The U.S. Drilling segment includes land drilling activities in the lower states and Alaska, as well as offshore operations in the Gulf of Mexico. The Canada Drilling segment operates in land-based drilling rigs in Canada. The International Drilling segment focuses on maintaining a footprint in the oil and gas market, most notably in Saudi Arabia, Algeria, Argentina, Colombia, Kazakhstan, and Venezuela. The Drilling Solutions segment offers drilling technologies, such as proprietary drilling-bit steering systems and rig instrumentation software. The Rig Technologies segment refers to the Canrig, which manufactures and sells top drives, catwalks, wrenches, draw works, and drilling related equipment, such as robotic systems and downhole tools. The company was founded by Clair Nabors in 1952 and is headquartered in Hamilton, Bermuda. |
| Insider Trading |
Relationship |
Date |
Transaction |
Cost |
#Shares |
Value ($) |
#Shares Total |
SEC Form 4 |
| PETRELLO ANTHONY G | CHAIRMAN, PRESIDENT & CEO | Jan 02 '24 | Option Exercise | 0.00 | 18,428 | 0 | 150,705 | Jan 03 06:51 PM | | Restrepo William J | Chief Financial Officer | Jan 02 '24 | Option Exercise | 0.00 | 3,422 | 0 | 111,182 | Jan 03 06:57 PM | | Restrepo William J | Chief Financial Officer | Jan 01 '24 | Option Exercise | 0.00 | 3,962 | 0 | 111,695 | Jan 03 06:57 PM | | PETRELLO ANTHONY G | CHAIRMAN, PRESIDENT & CEO | Jan 01 '24 | Option Exercise | 0.00 | 18,484 | 0 | 108,095 | Jan 03 06:51 PM | | Kotts John P | Director | Sep 05 '23 | Sale | 125.13 | 4,975 | 622,527 | 4,787 | Sep 05 09:50 PM |
|
|
| |
 |
| Market Cap | 22.35B | EPS (ttm) | 2.02 |
| P/E | 23.48 | EPS this Y | 20.25% |
| Forward P/E | 23.90 | EPS next Y | 0.99% |
| PEG | 2.97 | EPS past 5Y | 1.94% |
| P/S | 5.26 | EPS next 5Y | 7.90% |
| P/B | 6.89 | EPS Q/Q | 187.99% |
| Dividend | 1.79% | Sales Q/Q | -1.11% |
| Insider Own | 36.89% | Inst Own | 34.64% |
| Insider Trans | 0.00% | Inst Trans | 0.34% |
| Short Float | 3.37% | Earnings | Mar 06/b |
| Analyst Recom | 3.00 | Target Price | 58.14 |
| Avg Volume | 1.79M | 52W Range | 47.65 - 71.27 |
|
|
|
|
Brown-Forman Corp. engages in the production and distribution of alcoholic beverages. The firm offers whiskey, scotch, tequila, vodka, liquor, and wine. Its brands include Jack Daniel, Woodford Reserve, Old Forester, Early Times, Canadian Mist, Coopers' Craft, Slane Irish, Finlandia, Korbel, El Jimador, Sonoma Cutrer and Chambord. The company was founded by George Garvin Brown III in 1870 and is headquartered in Louisville, KY. |
| Insider Trading |
Relationship |
Date |
Transaction |
Cost |
#Shares |
Value ($) |
#Shares Total |
SEC Form 4 |
| Nall Timothy M | EVP, Chief Supp/Tech | Apr 01 '24 | Option Exercise | 35.60 | 8,043 | 286,355 | 12,884 | Apr 03 05:45 PM | | Whiting Lawson E | President & CEO | Mar 12 '24 | Option Exercise | 35.60 | 15,601 | 555,442 | 41,045 | Mar 13 04:48 PM | | Hamel Matthew E | EVP and General Counsel | Jan 31 '24 | Option Exercise | 35.60 | 8,538 | 303,978 | 33,805 | Feb 01 05:57 PM | | Hamel Matthew E | EVP and General Counsel | Oct 31 '23 | Option Exercise | 35.60 | 8,538 | 303,978 | 32,169 | Nov 02 04:38 PM | | Hamel Matthew E | EVP and General Counsel | Jul 31 '23 | Option Exercise | 35.60 | 8,538 | 303,953 | 29,879 | Jul 31 05:03 PM |
|
|
|
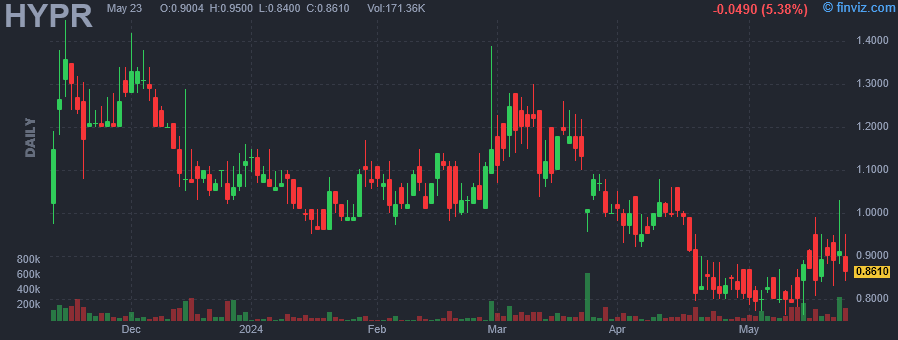 |
| Market Cap | 57.69M | EPS (ttm) | -0.62 |
| P/E | - | EPS this Y | 13.44% |
| Forward P/E | - | EPS next Y | 6.83% |
| PEG | - | EPS past 5Y | - |
| P/S | 5.23 | EPS next 5Y | - |
| P/B | 0.68 | EPS Q/Q | 19.46% |
| Dividend | - | Sales Q/Q | 88.62% |
| Insider Own | 34.13% | Inst Own | 11.42% |
| Insider Trans | -0.02% | Inst Trans | -5.17% |
| Short Float | 2.64% | Earnings | May 13/a |
| Analyst Recom | 2.33 | Target Price | 1.30 |
| Avg Volume | 76.65K | 52W Range | 0.80 - 3.28 |
|
|
|
Apr-29-24 04:05PM
|
Hyperfine, Inc. to Announce First Quarter 2024 Financial Results on May 13, 2024
(Business Wire) |
|
Apr-25-24 09:35AM
|
Down -19% in 4 Weeks, Here's Why Hyperfine (HYPR) Looks Ripe for a Turnaround
(Zacks) |
|
Apr-23-24 09:00AM
|
Hyperfine, Inc. Takes the Stage at ISMRM with Seventeen Abstracts Assessing the Potential of Using Swoop System Images Across Multiple Care Settings and Clinical Conditions
(Business Wire) |
|
Apr-17-24 09:00AM
|
Leading Institutions Enroll First Alzheimers Patients Receiving Amyloid-Targeting Therapy in CARE PMR Study
(Business Wire) -8.08% |
|
Mar-21-24 08:53PM
|
HYPR Stock Earnings: Hyperfine Beats EPS, Misses Revenue for Q4 2023
(InvestorPlace) |
|
05:25PM
|
Hyperfine, Inc. (HYPR) Reports Q4 Loss, Lags Revenue Estimates
(Zacks) |
|
04:05PM
|
Hyperfine, Inc. Reports Fourth Quarter and Full Year 2023 Financial Results
(GlobeNewswire) |
|
Mar-12-24 09:00AM
|
Hyperfine, Inc. Collaborates with Kings College London to Demonstrate the Swoop System and UNITY Project to The Princess Royal
(Business Wire) -10.66% |
|
Mar-07-24 04:30PM
|
Hyperfine, Inc. to Announce Fourth Quarter and Full Year 2023 Financial Results on March 21, 2024
(Business Wire) |
|
Feb-28-24 04:30PM
|
Hyperfine, Inc. to Present at the Oppenheimer 34th Annual Healthcare Conference
(Business Wire) +7.77% |
|
Hyperfine, Inc. is a medical device development company, which engages in providing imaging and monitoring through magnetic resonance imaging to revolutionize healthcare for people. It also develops imaging of health conditions through its Swoop portable magnetic resonance. The company was founded by Jonathan M. Rothberg and Ronald Walsworth on February 25, 2014 and is headquartered in Guilford, CT. |
| Insider Trading |
Relationship |
Date |
Transaction |
Cost |
#Shares |
Value ($) |
#Shares Total |
SEC Form 4 |
| TEISSEYRE THOMAS | Chief Operating Officer | Feb 16 '24 | Sale | 1.11 | 3,230 | 3,585 | 96,526 | Feb 16 04:06 PM | | TEISSEYRE THOMAS | Chief Operating Officer | Nov 16 '23 | Sale | 1.26 | 2,655 | 3,345 | 99,756 | Nov 17 07:34 PM | | TEISSEYRE THOMAS | Chief Operating Officer | Aug 16 '23 | Sale | 2.26 | 2,785 | 6,294 | 102,411 | Aug 17 04:45 PM | | Siddiqui Khan | CMO and Chief Strategy Officer | Aug 16 '23 | Sale | 2.26 | 1,729 | 3,908 | 76,981 | Aug 17 04:44 PM | | Siddiqui Khan | CMO and Chief Strategy Officer | May 16 '23 | Sale | 1.25 | 1,735 | 2,169 | 78,710 | May 16 06:15 PM |
|
|
| |
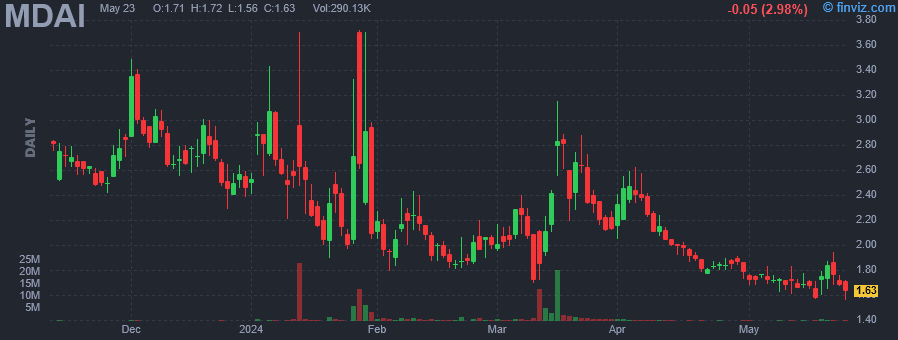 |
| Market Cap | 30.20M | EPS (ttm) | -1.33 |
| P/E | - | EPS this Y | 47.72% |
| Forward P/E | - | EPS next Y | -15.66% |
| PEG | - | EPS past 5Y | - |
| P/S | 3.46 | EPS next 5Y | - |
| P/B | - | EPS Q/Q | -592.84% |
| Dividend | - | Sales Q/Q | - |
| Insider Own | 57.55% | Inst Own | 10.86% |
| Insider Trans | 0.02% | Inst Trans | 8.02% |
| Short Float | 2.09% | Earnings | May 07/a |
| Analyst Recom | 1.00 | Target Price | 6.20 |
| Avg Volume | 1.34M | 52W Range | 1.70 - 19.50 |
|
|
|
|
Spectral AI, Inc. is a predictive artificial intelligence company. It focuses on medical diagnostics for faster and more accurate treatment decisions in wound care for burn, DFU, and future clinical applications. Its DeepView platform is a predictive diagnostic device that offers clinicians an objective and immediate assessment of a wound's healing potential prior to treatment or other medical intervention. The company was founded on November 17, 2020 and is headquartered in Dallas, TX. |
| Insider Trading |
Relationship |
Date |
Transaction |
Cost |
#Shares |
Value ($) |
#Shares Total |
SEC Form 4 |
| DiMaio John Michael | 10% Owner | Nov 20 '23 | Buy | 2.67 | 2,000 | 5,340 | 2,481,908 | Nov 22 01:11 PM | | Radecki Brian J | Director | Sep 11 '23 | Option Exercise | 0.00 | 25,000 | 0 | 25,000 | Sep 13 12:48 PM | | Edmonds Franklin S. Jr. | Director | Sep 11 '23 | Option Exercise | 0.00 | 20,000 | 0 | 20,000 | Sep 13 12:46 PM | | Rosecliff Acquisition Sponsor | Director | Sep 11 '23 | Option Exercise | 0.00 | 815,000 | 0 | 815,000 | Sep 13 12:44 PM | | Bellini Heather | Director | Sep 11 '23 | Option Exercise | 0.00 | 20,000 | 0 | 20,000 | Sep 13 05:45 PM |
|
|
|
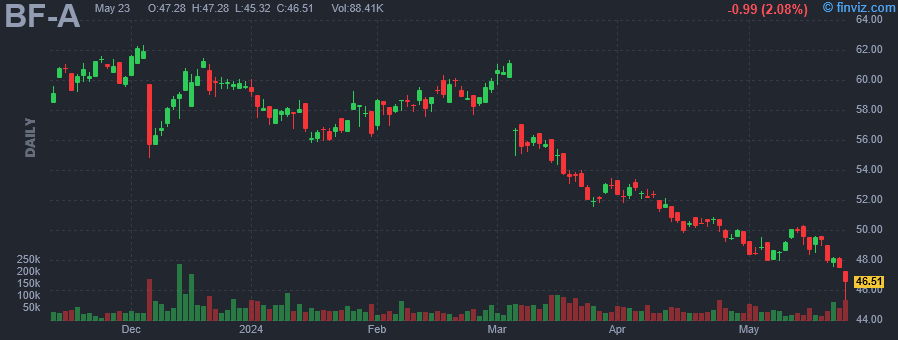 |
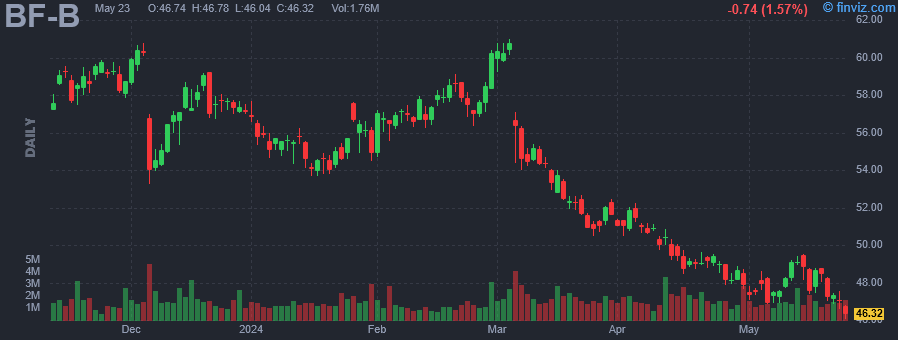
| Market Cap | 22.85B | EPS (ttm) | 2.02 |
| P/E | 24.00 | EPS this Y | 20.60% |
| Forward P/E | 24.41 | EPS next Y | 0.80% |
| PEG | - | EPS past 5Y | 1.94% |
| P/S | 5.38 | EPS next 5Y | - |
| P/B | 7.04 | EPS Q/Q | 187.99% |
| Dividend | 1.75% | Sales Q/Q | -1.11% |
| Insider Own | 89.72% | Inst Own | 3.83% |
| Insider Trans | 0.00% | Inst Trans | - |
| Short Float | 0.47% | Earnings | Mar 06/b |
| Analyst Recom | 3.00 | Target Price | 58.48 |
| Avg Volume | 50.44K | 52W Range | 48.92 - 72.65 |
|
|
|
|
Brown-Forman Corp. engages in the production and distribution of alcoholic beverages. The firm offers whiskey, scotch, tequila, vodka, liquor, and wine. Its brands include Jack Daniel, Woodford Reserve, Old Forester, Early Times, Canadian Mist, Coopers' Craft, Slane Irish, Finlandia, Korbel, El Jimador, Sonoma Cutrer and Chambord. The company was founded by George Garvin Brown III in 1870 and is headquartered in Louisville, KY. |
| Insider Trading |
Relationship |
Date |
Transaction |
Cost |
#Shares |
Value ($) |
#Shares Total |
SEC Form 4 |
| Nall Timothy M | EVP, Chief Supp/Tech | Apr 01 '24 | Option Exercise | 35.60 | 8,043 | 286,355 | 12,884 | Apr 03 05:45 PM | | Whiting Lawson E | President & CEO | Mar 12 '24 | Option Exercise | 35.60 | 15,601 | 555,442 | 41,045 | Mar 13 04:48 PM | | Hamel Matthew E | EVP and General Counsel | Jan 31 '24 | Option Exercise | 35.60 | 8,538 | 303,978 | 33,805 | Feb 01 05:57 PM | | Hamel Matthew E | EVP and General Counsel | Oct 31 '23 | Option Exercise | 35.60 | 8,538 | 303,978 | 32,169 | Nov 02 04:38 PM | | Hamel Matthew E | EVP and General Counsel | Jul 31 '23 | Option Exercise | 35.60 | 8,538 | 303,953 | 29,879 | Jul 31 05:03 PM |
|
|
|
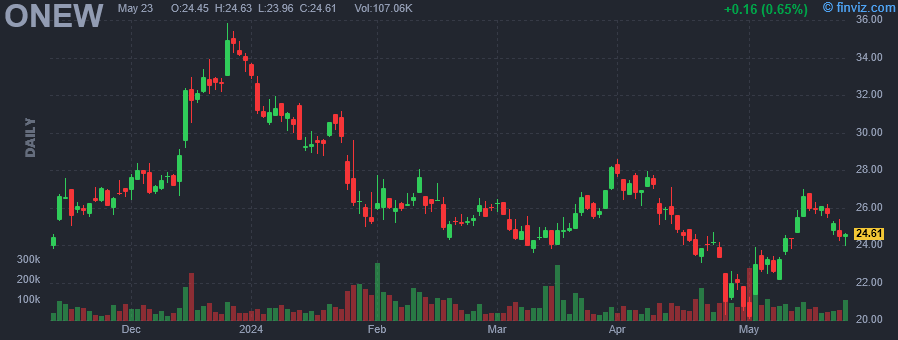 |
| Market Cap | 293.59M | EPS (ttm) | -3.88 |
| P/E | - | EPS this Y | -32.47% |
| Forward P/E | 4.77 | EPS next Y | 22.57% |
| PEG | - | EPS past 5Y | -17.30% |
| P/S | 0.15 | EPS next 5Y | - |
| P/B | 0.83 | EPS Q/Q | -180.82% |
| Dividend | - | Sales Q/Q | -0.72% |
| Insider Own | 25.80% | Inst Own | 74.62% |
| Insider Trans | 0.00% | Inst Trans | -4.25% |
| Short Float | 8.06% | Earnings | May 02/b |
| Analyst Recom | 1.71 | Target Price | 32.33 |
| Avg Volume | 89.97K | 52W Range | 20.29 - 39.15 |
|
|
|
|
OneWater Marine, Inc. is a holding company, which engages in the retail of marine in the United States. It operates through the Dealerships and Distribution segments. The Dealerships segment involves the sale of new and pre-owned boats, arranges financing and insurance products, performs repairs and maintenance services, offers marine related parts, accessories and slips, and storage accommodations. The Distribution segment focuses on the manufacturing, assembly, and distribution of primarily marine-related products. The company was founded by Philip Austin Singleton, Jr. on April 3, 2019 and is headquartered in Buford, GA. |
| Insider Trading |
Relationship |
Date |
Transaction |
Cost |
#Shares |
Value ($) |
#Shares Total |
SEC Form 4 |
| Singleton Philip Austin Jr. | CEO - See Remarks | Aug 25 '23 | Buy | 25.47 | 2,378 | 60,568 | 580,183 | Aug 29 04:17 PM | | Singleton Philip Austin Jr. | CEO - See Remarks | Aug 17 '23 | Buy | 26.92 | 4,633 | 124,720 | 577,805 | Aug 17 08:25 PM | | Singleton Philip Austin Jr. | CEO - See Remarks | Aug 16 '23 | Buy | 26.99 | 100 | 2,699 | 573,172 | Aug 17 08:25 PM | | Singleton Philip Austin Jr. | CEO - See Remarks | Aug 15 '23 | Buy | 26.99 | 267 | 7,206 | 573,072 | Aug 17 08:25 PM | | Schraudenbach John | Director | Aug 14 '23 | Buy | 27.56 | 3,624 | 99,877 | 24,352 | Aug 15 04:04 PM |
|
|
|
