 |
| Market Cap | 41.85M | EPS (ttm) | -0.17 |
| P/E | - | EPS this Y | - |
| Forward P/E | - | EPS next Y | - |
| PEG | - | EPS past 5Y | - |
| P/S | 0.53 | EPS next 5Y | - |
| P/B | 0.40 | EPS Q/Q | 25.71% |
| Dividend | 4.92% | Sales Q/Q | 5.43% |
| Insider Own | 19.53% | Inst Own | 36.25% |
| Insider Trans | 0.41% | Inst Trans | -2.68% |
| Short Float | 0.16% | Earnings | - |
| Analyst Recom | - | Target Price | - |
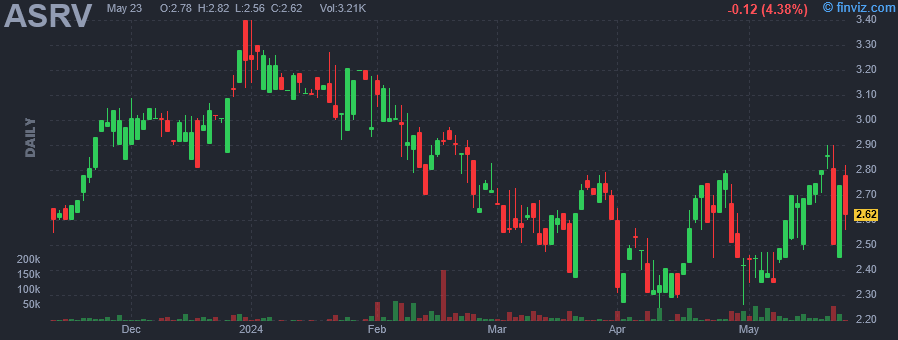
| Avg Volume | 20.73K | 52W Range | 2.25 - 3.40 |
|
|
|
|
AmeriServ Financial, Inc. is a holding company, which engages in the provision of consumer, mortgage and commercial financial products and services through its subsidiary. It operates through the following segments: Community Banking, Wealth Management, and Investment or Parent. The Community Banking segment includes both retail and commercial banking activities. The Wealth Management segment is involved in the operations of a Trust Company, West Chester Capital Advisors, an investment advisory firm, and Financial Services. The Investment or Parent segment offers investment securities, borrowing activities, and general corporate expenses. The company was founded in January 1983 and is headquartered in Johnstown, PA. |
| Insider Trading |
Relationship |
Date |
Transaction |
Cost |
#Shares |
Value ($) |
#Shares Total |
SEC Form 4 |
| STOPKO JEFFREY A | President & CEO ASRV & Bank | Apr 30 '24 | Buy | 2.40 | 3,000 | 7,200 | 139,189 | May 01 10:49 AM | | STOPKO JEFFREY A | President & CEO ASRV & Bank | Mar 12 '24 | Buy | 2.53 | 2,000 | 5,060 | 136,189 | Mar 13 09:45 AM | | STOPKO JEFFREY A | President & CEO ASRV & Bank | Feb 27 '24 | Buy | 2.74 | 2,000 | 5,480 | 134,189 | Feb 28 10:34 AM | | Bloomingdale Richard W. | Director | Feb 23 '24 | Buy | 2.85 | 1,725 | 4,916 | 9,919 | Feb 26 03:13 PM | | STOPKO JEFFREY A | President & CEO ASRV & Bank | Feb 21 '24 | Buy | 2.94 | 2,000 | 5,880 | 132,189 | Feb 21 03:04 PM |
|
|
 |
 |
| Market Cap | 484.86M | EPS (ttm) | 0.21 |
| P/E | 55.95 | EPS this Y | - |
| Forward P/E | - | EPS next Y | - |
| PEG | - | EPS past 5Y | - |
| P/S | 13.43 | EPS next 5Y | - |
| P/B | 0.88 | EPS Q/Q | - |
| Dividend | 3.52% | Sales Q/Q | -3.10% |
| Insider Own | - | Inst Own | 31.00% |
| Insider Trans | - | Inst Trans | - |
| Short Float | 0.19% | Earnings | - |
| Analyst Recom | - | Target Price | - |
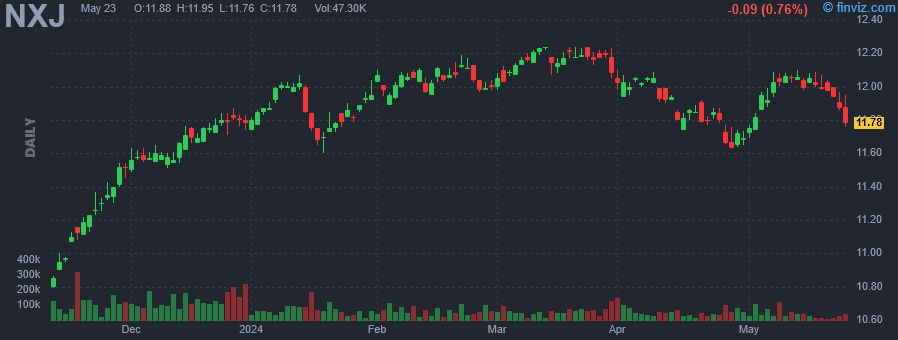
| Avg Volume | 64.00K | 52W Range | 10.06 - 12.24 |
|
|
|
|
Nuveen New Jersey Quality Municipal Income Fund is a closed ended fixed income mutual fund launched by Nuveen Investments, Inc. The fund is co-managed by Nuveen Fund Advisors LLC and Nuveen Asset Management, LLC. It invests in the fixed income markets of New Jersey. The fund invests in undervalued municipal securities and other related investments that are, exempt from regular federal and New Jersey income taxes that are rated Baa or BBB or better. It employs fundamental analysis with bottom-up stock picking approach to create its portfolio. The fund benchmarks the performance of its portfolio against the Standard & Poor's (S&P) New Jersey Municipal Bond Index. The fund was formerly known as Nuveen New Jersey Dividend Advantage Municipal Fund. Nuveen New Jersey Quality Municipal Income Fund was formed on June 1, 1999 and is domiciled in the United States. |
| Insider Trading |
Relationship |
Date |
Transaction |
Cost |
#Shares |
Value ($) |
#Shares Total |
SEC Form 4 |
| Saba Capital Management, L.P. | 10% Owner | Apr 29 '24 | Buy | 11.66 | 5,494 | 64,060 | 5,921,875 | May 01 10:30 AM | | Saba Capital Management, L.P. | 10% Owner | Apr 02 '24 | Buy | 11.99 | 27,925 | 334,821 | 5,916,381 | Apr 03 02:01 PM | | Saba Capital Management, L.P. | 10% Owner | Apr 01 '24 | Buy | 12.03 | 54,332 | 653,614 | 5,888,456 | Apr 03 02:01 PM | | Saba Capital Management, L.P. | 10% Owner | Mar 26 '24 | Buy | 12.18 | 6,788 | 82,678 | 5,834,124 | Mar 27 09:27 AM | | Saba Capital Management, L.P. | 10% Owner | Mar 19 '24 | Buy | 12.22 | 9,550 | 116,701 | 5,827,336 | Mar 20 12:12 PM |
|
|
|
 |
| Market Cap | 428.43M | EPS (ttm) | -0.24 |
| P/E | - | EPS this Y | - |
| Forward P/E | - | EPS next Y | - |
| PEG | - | EPS past 5Y | - |
| P/S | 13.56 | EPS next 5Y | - |
| P/B | 0.89 | EPS Q/Q | - |
| Dividend | 3.43% | Sales Q/Q | 5.80% |
| Insider Own | - | Inst Own | 33.03% |
| Insider Trans | - | Inst Trans | - |
| Short Float | 0.13% | Earnings | - |
| Analyst Recom | - | Target Price | - |
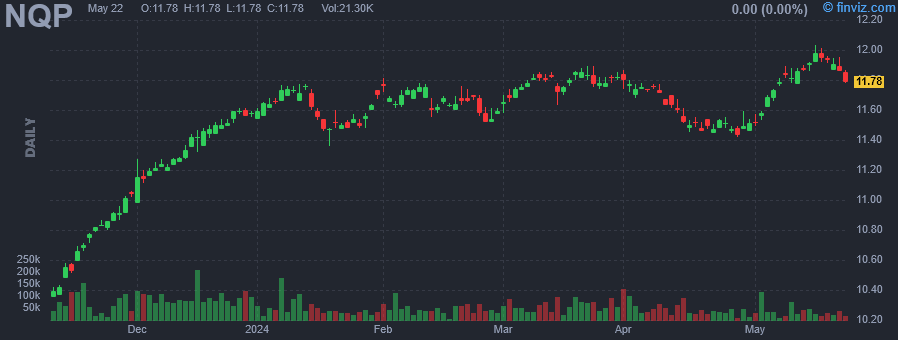
| Avg Volume | 54.76K | 52W Range | 9.65 - 11.89 |
|
|
|
|
Nuveen Pennsylvania Quality Municipal Income Fund is a closed ended fixed income mutual fund launched by Nuveen Investments, Inc. The fund is co-managed by Nuveen Fund Advisors LLC and Nuveen Asset Management, LLC. It invests in the fixed income markets of Pennsylvania. The fund invests in tax exempt municipal bonds, with a rating of Baa/BBB or higher. It employs fundamental analysis, with bottom-up stock picking approach, to create its portfolio. The fund benchmarks the performance of its portfolio against the Standard & Poor's Pennsylvania Municipal Bond Index and Standard & Poor's National Municipal Bond Index. The fund was formerly known a Nuveen Pennsylvania Investment Quality Municipal Fund. Nuveen Pennsylvania Quality Municipal Income Fund was formed on December 20, 1990 and is domiciled in the United States. |
| Insider Trading |
Relationship |
Date |
Transaction |
Cost |
#Shares |
Value ($) |
#Shares Total |
SEC Form 4 |
| Saba Capital Management, L.P. | 10% Owner | Apr 29 '24 | Buy | 11.49 | 7,796 | 89,576 | 5,095,490 | May 01 10:28 AM | | Saba Capital Management, L.P. | 10% Owner | Apr 25 '24 | Buy | 11.46 | 31,908 | 365,666 | 5,087,694 | Apr 26 11:51 AM | | Saba Capital Management, L.P. | 10% Owner | Apr 02 '24 | Buy | 11.76 | 49,402 | 580,968 | 5,055,786 | Apr 03 01:55 PM | | Saba Capital Management, L.P. | 10% Owner | Apr 01 '24 | Buy | 11.77 | 35,421 | 416,905 | 5,006,384 | Apr 03 01:55 PM | | Saba Capital Management, L.P. | 10% Owner | Mar 28 '24 | Buy | 11.81 | 12,368 | 146,066 | 4,970,963 | Apr 01 08:48 AM |
|
|
| |
 |
| Market Cap | 292.44M | EPS (ttm) | - |
| P/E | - | EPS this Y | - |
| Forward P/E | - | EPS next Y | - |
| PEG | - | EPS past 5Y | - |
| P/S | - | EPS next 5Y | - |
| P/B | - | EPS Q/Q | - |
| Dividend | 9.00% | Sales Q/Q | - |
| Insider Own | - | Inst Own | 42.80% |
| Insider Trans | - | Inst Trans | - |
| Short Float | 0.08% | Earnings | - |
| Analyst Recom | - | Target Price | - |
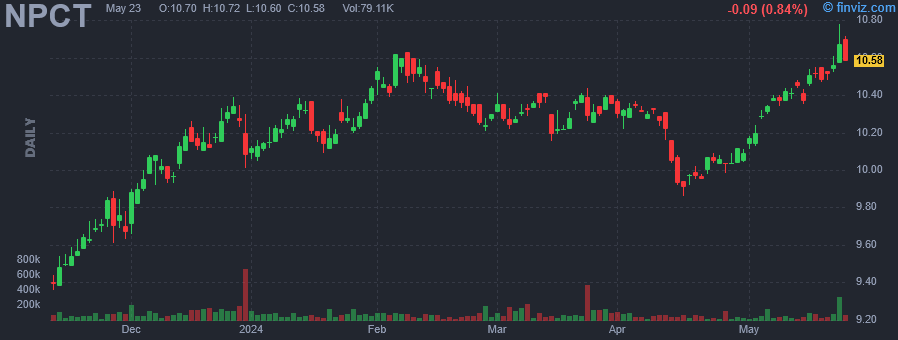
| Avg Volume | 88.25K | 52W Range | 8.58 - 10.63 |
|
|
|
| Insider Trading |
Relationship |
Date |
Transaction |
Cost |
#Shares |
Value ($) |
#Shares Total |
SEC Form 4 |
| Saba Capital Management, L.P. | 10% Owner | Apr 29 '24 | Buy | 10.10 | 19,191 | 193,829 | 3,352,378 | May 01 10:25 AM | | Saba Capital Management, L.P. | 10% Owner | Apr 25 '24 | Buy | 10.03 | 68,072 | 682,762 | 3,333,187 | Apr 26 11:48 AM | | Saba Capital Management, L.P. | 10% Owner | Apr 03 '24 | Buy | 10.29 | 28,324 | 291,454 | 3,265,115 | Apr 05 02:22 PM | | Saba Capital Management, L.P. | 10% Owner | Apr 02 '24 | Buy | 10.26 | 30,848 | 316,500 | 3,236,791 | Apr 03 01:53 PM | | Saba Capital Management, L.P. | 10% Owner | Mar 19 '24 | Buy | 10.28 | 13,886 | 142,748 | 3,205,943 | Mar 20 12:06 PM |
|
|
|
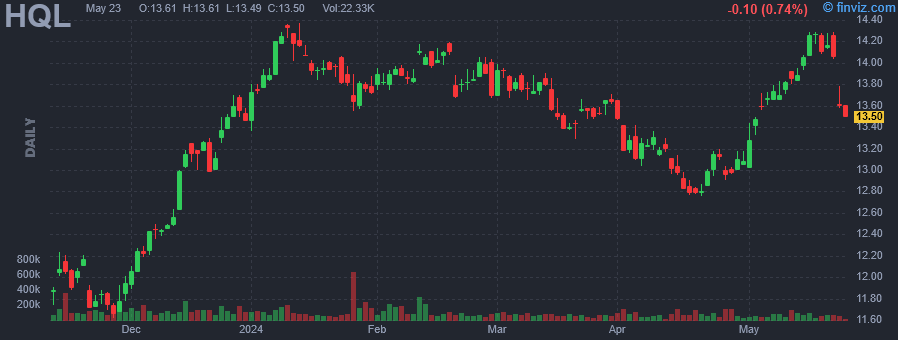 |
| Market Cap | 363.21M | EPS (ttm) | 0.79 |
| P/E | 16.81 | EPS this Y | - |
| Forward P/E | - | EPS next Y | - |
| PEG | - | EPS past 5Y | - |
| P/S | 103.39 | EPS next 5Y | - |
| P/B | 0.82 | EPS Q/Q | - |
| Dividend | 7.61% | Sales Q/Q | 34.40% |
| Insider Own | - | Inst Own | 36.04% |
| Insider Trans | - | Inst Trans | - |
| Short Float | 0.07% | Earnings | - |
| Analyst Recom | - | Target Price | - |
| Avg Volume | 100.38K | 52W Range | 11.34 - 14.37 |
|
|
|
|
Tekla Life Sciences Investors is a closed-ended equity mutual fund launched and managed by Tekla Capital Management LLC. The fund invests in public equity markets across the globe. It seeks to invest in stocks of companies operating in the life sciences sector, including the biotechnology, pharmaceutical, diagnostics, managed healthcare, medical equipment, hospitals, healthcare information technology and services, devices and supplies industries, and in agriculture and environmental management industries. The fund primarily invests in growth stocks of small cap companies. It employs fundamental analysis with a focus on factors such as market position for services or products, experience of business management, technological expertise, and the ability either to generate funds internally to finance growth or to secure outside sources of capital to create its portfolio. The fund benchmarks the performance of its portfolio against the NASDAQ Biotech Index and the S&P 500 Index. It was formerly known as H&Q Life Sciences Investors fund. Tekla Life Sciences Investors was formed on February 20, 1992 and is domiciled in the United States. |
| Insider Trading |
Relationship |
Date |
Transaction |
Cost |
#Shares |
Value ($) |
#Shares Total |
SEC Form 4 |
| Saba Capital Management, L.P. | 10% Owner | Apr 30 '24 | Buy | 13.13 | 16,573 | 217,603 | 3,042,204 | May 01 10:23 AM | | Saba Capital Management, L.P. | 10% Owner | Apr 26 '24 | Buy | 13.00 | 120,304 | 1,563,952 | 3,025,602 | Apr 29 04:54 PM | | Saba Capital Management, L.P. | 10% Owner | Apr 25 '24 | Buy | 12.99 | 97,574 | 1,267,486 | 2,905,298 | Apr 26 11:40 AM | | Saba Capital Management, L.P. | 10% Owner | Apr 24 '24 | Buy | 13.12 | 20,529 | 269,340 | 2,807,724 | Apr 26 11:40 AM | | Saba Capital Management, L.P. | 10% Owner | Apr 23 '24 | Buy | 13.15 | 48,203 | 633,869 | 2,787,195 | Apr 23 08:00 PM |
|
|
| |
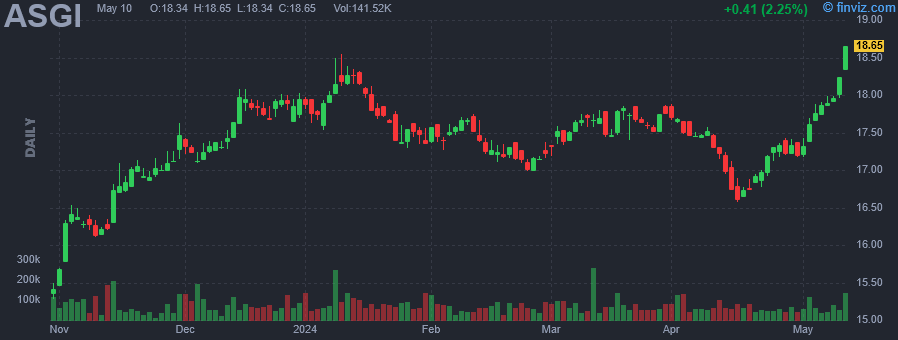 |
| Market Cap | 436.58M | EPS (ttm) | -0.66 |
| P/E | - | EPS this Y | - |
| Forward P/E | - | EPS next Y | - |
| PEG | - | EPS past 5Y | - |
| P/S | - | EPS next 5Y | - |
| P/B | - | EPS Q/Q | - |
| Dividend | 9.06% | Sales Q/Q | - |
| Insider Own | - | Inst Own | 40.44% |
| Insider Trans | - | Inst Trans | - |
| Short Float | 0.18% | Earnings | - |
| Analyst Recom | - | Target Price | - |
| Avg Volume | 74.02K | 52W Range | 14.96 - 18.55 |
|
|
|
|
Abrdn Global Infrastructure Income Fund seeks investment results that correspond generally to the price and yield performance, before fees and expenses, of the Northern Trust Real Assets Allocation IndexSM.Under normal circumstances, the fund will invest at least 80% of its total assets (exclusive of collateral held from securities lending) in the securities of the underlying index. The underlying index measures the performance of an optimized allocation to the underlying funds that is intended to provide exposures to certain real assets and minimize overall volatility of investment in the underlying funds. |
| Insider Trading |
Relationship |
Date |
Transaction |
Cost |
#Shares |
Value ($) |
#Shares Total |
SEC Form 4 |
| Saba Capital Management, L.P. | 10% Owner | Apr 29 '24 | Buy | 17.37 | 15,132 | 262,843 | 2,812,434 | May 01 10:21 AM | | Saba Capital Management, L.P. | 10% Owner | Apr 25 '24 | Buy | 17.27 | 34,547 | 596,627 | 2,797,302 | Apr 26 11:36 AM | | Saba Capital Management, L.P. | 10% Owner | Apr 23 '24 | Buy | 17.11 | 13,691 | 234,253 | 2,762,755 | Apr 23 07:56 PM | | Saba Capital Management, L.P. | 10% Owner | Apr 22 '24 | Buy | 16.89 | 6,129 | 103,519 | 2,749,064 | Apr 23 07:56 PM | | Goodson Alan R | Director of Adviser | Apr 18 '24 | Buy | 16.83 | 3,881 | 65,317 | 3,881 | Apr 19 07:41 AM |
|
|
|
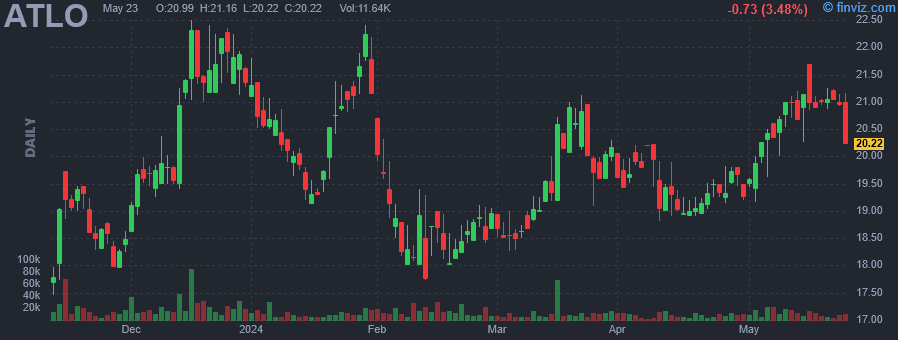 |
| Market Cap | 176.11M | EPS (ttm) | 1.11 |
| P/E | 17.69 | EPS this Y | - |
| Forward P/E | - | EPS next Y | - |
| PEG | - | EPS past 5Y | -8.02% |
| P/S | 2.04 | EPS next 5Y | - |
| P/B | 1.06 | EPS Q/Q | -26.86% |
| Dividend | 5.51% | Sales Q/Q | 14.59% |
| Insider Own | 1.88% | Inst Own | 26.61% |
| Insider Trans | 0.98% | Inst Trans | 7.54% |
| Short Float | 1.05% | Earnings | - |
| Analyst Recom | - | Target Price | - |
| Avg Volume | 13.24K | 52W Range | 15.01 - 22.50 |
|
|
|
|
Ames National Corp. is a bank holding company, which engages in the provision of banking services through its subsidiaries. Its activities include personal, business, agricultural and commercial lending, management of the investment securities portfolio, deposit account services, and wealth management services. The company was founded on January 21, 1975 and is headquartered in Ames, IA. |
| Insider Trading |
Relationship |
Date |
Transaction |
Cost |
#Shares |
Value ($) |
#Shares Total |
SEC Form 4 |
| Cassabaum Michelle R | Director | Apr 30 '24 | Buy | 19.50 | 67 | 1,306 | 6,118 | May 01 09:32 AM | | Cassabaum Michelle R | Director | Mar 01 '24 | Buy | 18.80 | 300 | 5,640 | 6,051 | Mar 04 03:07 PM | | LARSON JAMES R II | Director | Feb 07 '24 | Buy | 18.20 | 250 | 4,550 | 12,000 | Feb 07 12:14 PM | | LARSON JAMES R II | Director | Feb 06 '24 | Buy | 18.60 | 250 | 4,650 | 11,750 | Feb 06 03:39 PM | | LARSON JAMES R II | Director | Feb 02 '24 | Buy | 19.67 | 200 | 3,935 | 11,500 | Feb 05 10:27 AM |
|
|
| |
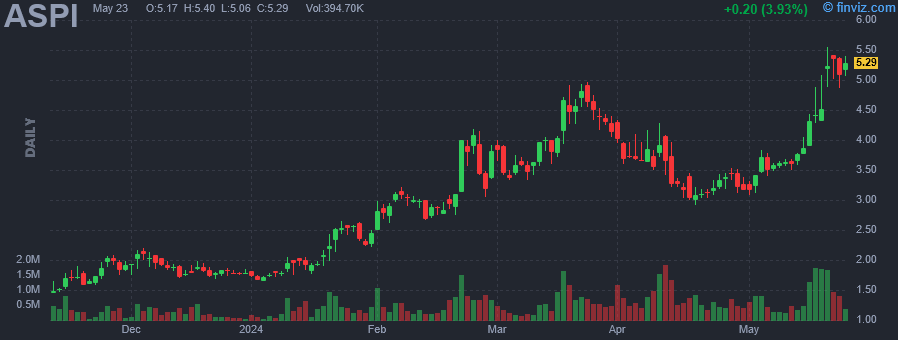 |
| Market Cap | 154.59M | EPS (ttm) | -0.49 |
| P/E | - | EPS this Y | 77.55% |
| Forward P/E | - | EPS next Y | 36.36% |
| PEG | - | EPS past 5Y | - |
| P/S | 359.51 | EPS next 5Y | - |
| P/B | 9.49 | EPS Q/Q | -141.87% |
| Dividend | - | Sales Q/Q | - |
| Insider Own | 53.59% | Inst Own | 3.33% |
| Insider Trans | 0.20% | Inst Trans | - |
| Short Float | 3.18% | Earnings | - |
| Analyst Recom | 1.00 | Target Price | 5.50 |
| Avg Volume | 649.47K | 52W Range | 0.28 - 4.97 |
|
|
|
|
ASP Isotopes, Inc. is a pre-commercial stage advanced materials company, which engages in the development of technology and processes that will allow for the enrichment of natural isotopes into higher concentration products. Its products include medical, green energy, and Industrial isotopes. The company was founded by Paul E. Mann and Robert Ainscow on September 13, 2021 and is headquartered in Washington, DC. |
| Insider Trading |
Relationship |
Date |
Transaction |
Cost |
#Shares |
Value ($) |
#Shares Total |
SEC Form 4 |
| Ryan Robert John Andrew | Director | Apr 30 '24 | Buy | 3.43 | 16,234 | 55,740 | 572,102 | May 01 08:50 AM | | Ryan Robert John Andrew | Director | Apr 29 '24 | Buy | 3.20 | 4,313 | 13,802 | 555,868 | May 01 08:50 AM | | Ryan Robert John Andrew | Director | Apr 26 '24 | Buy | 3.48 | 5,000 | 17,400 | 551,555 | Apr 30 07:49 AM | | Ryan Robert John Andrew | Director | Apr 25 '24 | Buy | 3.42 | 9,500 | 32,450 | 546,555 | Apr 29 09:04 PM | | Ryan Robert John Andrew | Director | Jan 29 '24 | Buy | 2.35 | 15,596 | 36,651 | 537,055 | Feb 26 07:27 AM |
|
|
|
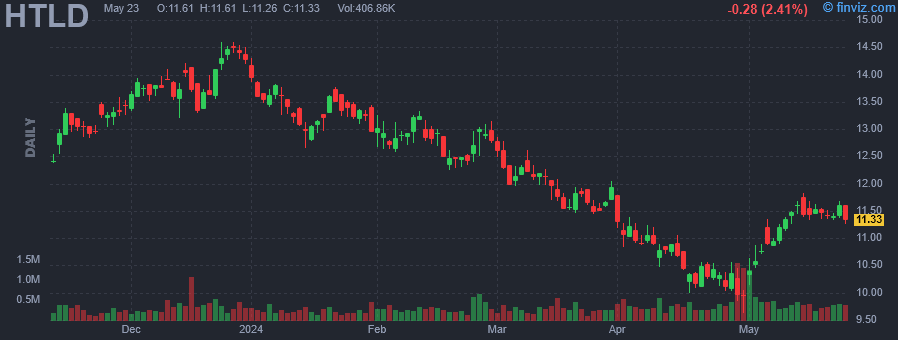 |
| Market Cap | 822.12M | EPS (ttm) | -0.16 |
| P/E | - | EPS this Y | -234.74% |
| Forward P/E | 21.18 | EPS next Y | 291.80% |
| PEG | - | EPS past 5Y | -26.69% |
| P/S | 0.72 | EPS next 5Y | 68.70% |
| P/B | 0.97 | EPS Q/Q | -219.74% |
| Dividend | 0.77% | Sales Q/Q | -18.31% |
| Insider Own | 41.91% | Inst Own | 56.55% |
| Insider Trans | 2.86% | Inst Trans | -0.75% |
| Short Float | 3.25% | Earnings | Apr 23/b |
| Analyst Recom | 3.40 | Target Price | 11.75 |
| Avg Volume | 368.85K | 52W Range | 9.63 - 17.08 |
|
|
|
|
Heartland Express, Inc. is a holding company, which engages in the provision of short-to-medium haul truckload carrier services. It offers long haul truckload and regional truckload transportation. The company was founded by Russell A. Gerdin in 1978 and is headquartered in North Liberty, IA. |
| Insider Trading |
Relationship |
Date |
Transaction |
Cost |
#Shares |
Value ($) |
#Shares Total |
SEC Form 4 |
| GERDIN MICHAEL J | Chief Executive Officer | Apr 30 '24 | Buy | 9.92 | 93,496 | 927,536 | 182,405 | Apr 30 09:32 PM | | Ann S. Gerdin Revocable Trust | Co-Trustee of 10% Owner | Apr 30 '24 | Buy | 9.86 | 93,496 | 922,020 | 770,704 | Apr 30 09:04 PM | | Ann S. Gerdin Revocable Trust | Co-Trustee of 10% Owner | Apr 29 '24 | Buy | 10.12 | 93,496 | 946,095 | 677,208 | Apr 30 09:04 PM | | GERDIN MICHAEL J | Chief Executive Officer | Apr 29 '24 | Buy | 9.97 | 31,200 | 310,989 | 88,909 | Apr 30 09:32 PM | | Ann S. Gerdin Revocable Trust | Co-Trustee of 10% Owner | Apr 26 '24 | Buy | 10.44 | 88,100 | 920,178 | 583,712 | Apr 30 09:04 PM |
|
|
|
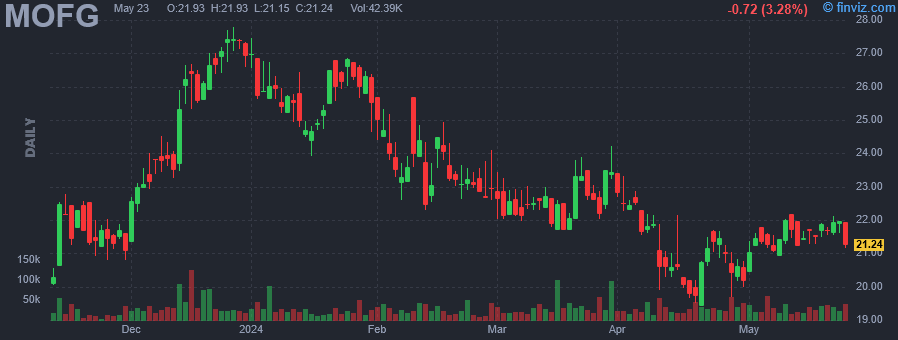 |
| Market Cap | 331.22M | EPS (ttm) | 1.45 |
| P/E | 14.54 | EPS this Y | 48.12% |
| Forward P/E | 7.61 | EPS next Y | 40.30% |
| PEG | 1.82 | EPS past 5Y | -11.76% |
| P/S | 1.14 | EPS next 5Y | 8.00% |
| P/B | 0.63 | EPS Q/Q | 133.60% |
| Dividend | 4.61% | Sales Q/Q | 43.10% |
| Insider Own | 9.13% | Inst Own | 65.79% |
| Insider Trans | 0.45% | Inst Trans | -1.66% |
| Short Float | 0.44% | Earnings | Apr 25/a |
| Analyst Recom | 2.20 | Target Price | 25.10 |
| Avg Volume | 32.59K | 52W Range | 17.80 - 27.78 |
|
|
|
|
MidWestOne Financial Group, Inc. is a financial holding company, focuses on delivering relationship-based business and personal banking products and services through its bank subsidiary, MidWestOne Bank. The Bank provides commercial loans, real estate loans, agricultural loans, credit card loans, and consumer loans. It also provides deposit products including demand and interest checking accounts, savings accounts, money market accounts, and time deposits. The Bank also provides products and services including treasury management, Zelle, online and mobile banking, debit cards, ATMs, and safe deposit boxes. It offers its products and services primarily through its full-service branch network, including 34 branches located throughout central and eastern Iowa, 13 branches located principally in the Minneapolis-St. Paul metropolitan area of Minnesota, seven branches in western Wisconsin, one branch in each of Naples and Fort Myers, Florida, and one branch in Denver, Colorado. MidWestOne Financial Group was founded in 1983 and is headquartered in Iowa City, IA. |
| Insider Trading |
Relationship |
Date |
Transaction |
Cost |
#Shares |
Value ($) |
#Shares Total |
SEC Form 4 |
| REEVES CHARLES N | Chief Executive Officer | Apr 30 '24 | Buy | 20.72 | 1,000 | 20,716 | 30,000 | Apr 30 08:13 PM | | REEVES CHARLES N | Chief Executive Officer | Mar 11 '24 | Buy | 22.49 | 4,447 | 99,998 | 38,346 | Mar 11 05:12 PM | | Godwin Janet E | Director | Nov 06 '23 | Buy | 20.75 | 1,015 | 21,061 | 7,349 | Nov 07 07:08 PM | | Kaeding Nathaniel J | Director | May 25 '23 | Buy | 19.35 | 517 | 10,004 | 5,780 | May 25 03:08 PM | | HEINONEN RUTH ELIINA | Director | May 12 '23 | Buy | 18.14 | 200 | 3,627 | 6,317 | May 12 12:55 PM |
|
|
|
