 |
| Market Cap | 7.54B | EPS (ttm) | 2.13 |
| P/E | 43.09 | EPS this Y | 5.14% |
| Forward P/E | 32.05 | EPS next Y | 23.93% |
| PEG | 3.59 | EPS past 5Y | 31.82% |
| P/S | 6.45 | EPS next 5Y | 12.00% |
| P/B | 10.18 | EPS Q/Q | 19.17% |
| Dividend | 0.37% | Sales Q/Q | 20.44% |
| Insider Own | 17.69% | Inst Own | 70.46% |
| Insider Trans | -2.85% | Inst Trans | -0.20% |
| Short Float | 4.12% | Earnings | May 02/a |
| Analyst Recom | 1.80 | Target Price | 95.67 |
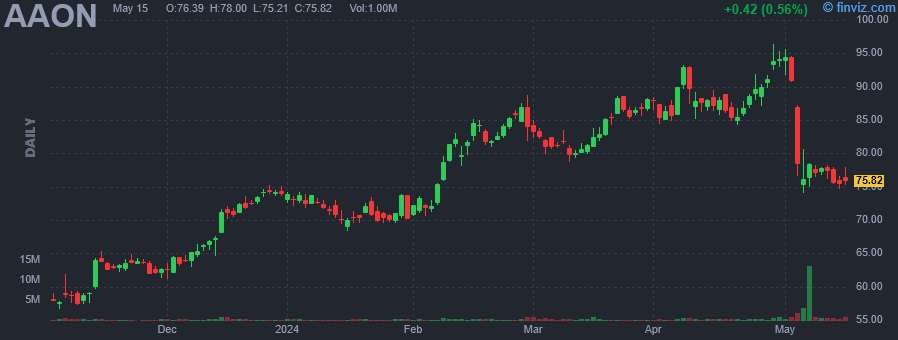
| Avg Volume | 463.58K | 52W Range | 52.24 - 96.34 |
|
|
|
|
AAON, Inc. engages in the engineering, manufacturing, marketing and sale of air conditioning and heating equipment. It operates through the following segments: Units, Parts-External, Parts-Internal, and Other. Its products include air handling units, self contained units, packaged rooftop units, geothermal heat units, controls, and coils. The company was founded by Norman H. Asbjornson on August 18, 1987 and is headquartered in Tulsa, OK. |
| Insider Trading |
Relationship |
Date |
Transaction |
Cost |
#Shares |
Value ($) |
#Shares Total |
SEC Form 4 |
| ASBJORNSON NORMAN H | Director | Mar 15 '24 | Sale | 83.15 | 26,149 | 2,174,289 | 13,318,829 | Mar 18 04:00 PM | | ASBJORNSON NORMAN H | Director | Mar 14 '24 | Sale | 81.30 | 30,397 | 2,471,276 | 13,344,978 | Mar 18 04:00 PM | | ASBJORNSON NORMAN H | Director | Mar 14 '24 | Sale | 81.30 | 19,136 | 1,555,757 | 14,874 | Mar 18 04:00 PM | | Wakefield Stephen E | Vice President | Mar 13 '24 | Option Exercise | 38.33 | 24,655 | 944,980 | 40,647 | Mar 15 12:24 PM | | Wakefield Stephen E | Vice President | Mar 13 '24 | Sale | 80.86 | 24,655 | 1,993,603 | 15,992 | Mar 15 12:24 PM |
|
|
 |
 |
| Market Cap | 2671.83B | EPS (ttm) | 6.43 |
| P/E | 26.92 | EPS this Y | 6.66% |
| Forward P/E | 24.33 | EPS next Y | 8.75% |
| PEG | 2.45 | EPS past 5Y | 15.55% |
| P/S | 6.93 | EPS next 5Y | 11.00% |
| P/B | 36.10 | EPS Q/Q | 15.81% |
| Dividend | 0.58% | Sales Q/Q | 2.07% |
| Insider Own | 0.09% | Inst Own | 61.69% |
| Insider Trans | -4.48% | Inst Trans | -0.48% |
| Short Float | 0.66% | Earnings | May 02/a |
| Analyst Recom | 2.16 | Target Price | 196.84 |
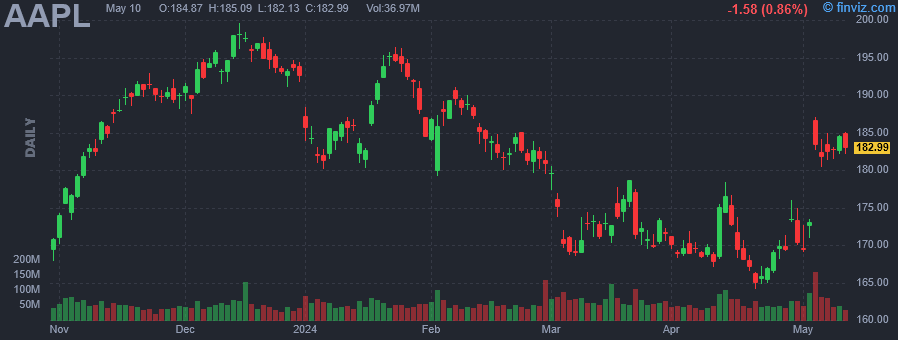
| Avg Volume | 61.72M | 52W Range | 164.07 - 199.62 |
|
|
|
|
Apple, Inc. engages in the design, manufacture, and sale of smartphones, personal computers, tablets, wearables and accessories, and other varieties of related services. It operates through the following geographical segments: Americas, Europe, Greater China, Japan, and Rest of Asia Pacific. The Americas segment includes North and South America. The Europe segment consists of European countries, as well as India, the Middle East, and Africa. The Greater China segment comprises China, Hong Kong, and Taiwan. The Rest of Asia Pacific segment includes Australia and Asian countries. Its products and services include iPhone, Mac, iPad, AirPods, Apple TV, Apple Watch, Beats products, AppleCare, iCloud, digital content stores, streaming, and licensing services. The company was founded by Steven Paul Jobs, Ronald Gerald Wayne, and Stephen G. Wozniak in April 1976 and is headquartered in Cupertino, CA. |
| Insider Trading |
Relationship |
Date |
Transaction |
Cost |
#Shares |
Value ($) |
#Shares Total |
SEC Form 4 |
| WILLIAMS JEFFREY E | COO | Apr 11 '24 | Sale | 172.22 | 59,162 | 10,188,880 | 489,944 | Apr 15 06:31 PM | | Maestri Luca | Senior Vice President, CFO | Apr 11 '24 | Sale | 174.12 | 53,194 | 9,261,933 | 107,788 | Apr 15 06:30 PM | | COOK TIMOTHY D | Chief Executive Officer | Apr 02 '24 | Sale | 168.62 | 97,227 | 16,394,529 | 3,280,180 | Apr 03 06:31 PM | | O'BRIEN DEIRDRE | Senior Vice President | Apr 02 '24 | Sale | 168.91 | 54,732 | 9,244,782 | 136,572 | Apr 03 06:33 PM | | Adams Katherine L. | SVP, GC and Secretary | Apr 02 '24 | Sale | 168.90 | 54,732 | 9,244,235 | 293,393 | Apr 03 06:30 PM |
|
|
|
 |
| Market Cap | 3.74B | EPS (ttm) | 3.25 |
| P/E | 23.67 | EPS this Y | 2.85% |
| Forward P/E | 19.62 | EPS next Y | 18.12% |
| PEG | 5.77 | EPS past 5Y | 16.04% |
| P/S | 1.62 | EPS next 5Y | 4.10% |
| P/B | 1.60 | EPS Q/Q | -82.58% |
| Dividend | 0.26% | Sales Q/Q | 16.37% |
| Insider Own | 1.70% | Inst Own | 91.36% |
| Insider Trans | 0.00% | Inst Trans | -1.05% |
| Short Float | 0.88% | Earnings | May 02/a |
| Analyst Recom | 1.40 | Target Price | 94.40 |
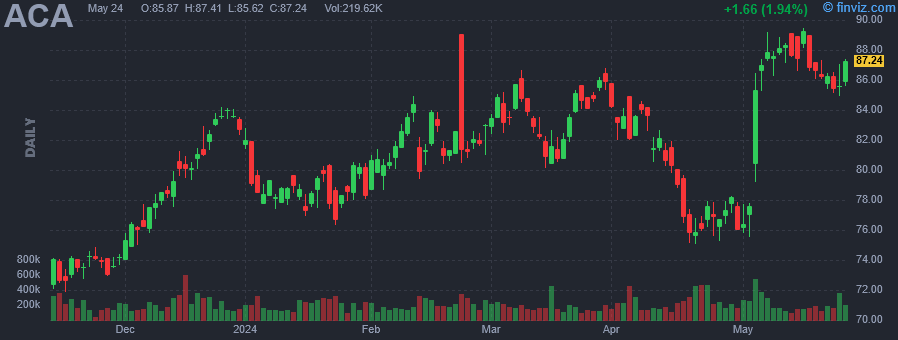
| Avg Volume | 224.48K | 52W Range | 61.98 - 89.07 |
|
|
|
|
Arcosa, Inc. engages in the provision of infrastructure-related products and services. It operates through the following segments: Construction Products, Energy Equipment, and Transportation Products. The Construction Products segment produces and sells construction aggregates, and manufactures and sells trench shields and shoring products and services for infrastructure-related projects. The Energy Equipment manufactures and sells products for energy-related businesses, including structural wind towers, steel utility structures for electricity transmission and distribution, and storage and distribution containers. The Transportation Products segment covers the manufacture and sale of products for the inland waterway and rail transportation industries, including barges, barge-related products, axles, and couplers. The company was founded in December 2017 and is headquartered in Dallas, TX. |
| Insider Trading |
Relationship |
Date |
Transaction |
Cost |
#Shares |
Value ($) |
#Shares Total |
SEC Form 4 |
| Carrillo Antonio | President & CEO | Aug 17 '23 | Sale | 76.59 | 8,398 | 643,208 | 348,972 | Aug 17 05:41 PM | | Carrillo Antonio | President & CEO | Aug 16 '23 | Sale | 77.32 | 26,233 | 2,028,436 | 357,370 | Aug 16 06:16 PM | | Carrillo Antonio | President & CEO | Aug 15 '23 | Sale | 78.25 | 14,411 | 1,127,700 | 383,603 | Aug 16 06:16 PM | | Cole Kerry S | Group President | May 25 '23 | Sale | 66.24 | 5,000 | 331,200 | 23,002 | May 25 06:12 PM | | Cole Kerry S | Group President | May 18 '23 | Sale | 69.12 | 9,001 | 622,149 | 28,002 | May 19 04:43 PM |
|
|
| |
 |
| Market Cap | 471.98M | EPS (ttm) | -0.23 |
| P/E | - | EPS this Y | -1.83% |
| Forward P/E | 3.95 | EPS next Y | 16.82% |
| PEG | - | EPS past 5Y | - |
| P/S | 0.26 | EPS next 5Y | 10.00% |
| P/B | 0.60 | EPS Q/Q | -416.84% |
| Dividend | 6.08% | Sales Q/Q | -2.16% |
| Insider Own | 3.94% | Inst Own | 84.18% |
| Insider Trans | 0.00% | Inst Trans | -4.70% |
| Short Float | 1.87% | Earnings | May 02/a |
| Analyst Recom | 1.00 | Target Price | 10.83 |
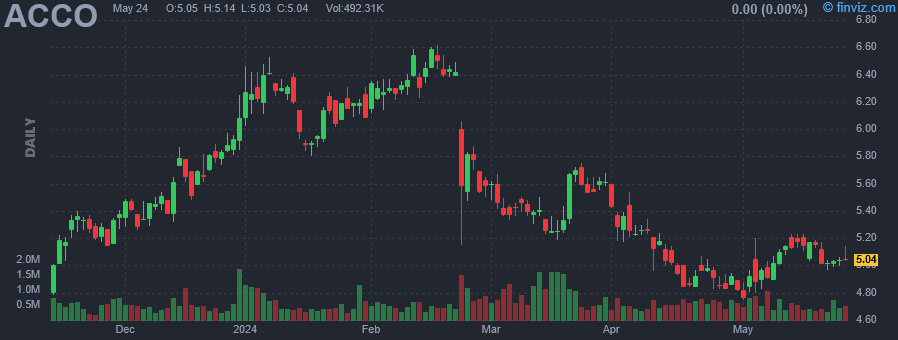
| Avg Volume | 699.84K | 52W Range | 4.30 - 6.62 |
|
|
|
|
ACCO Brands Corp. engages in the manufacture and marketing of office, school, calendar products, and select computer and electronic accessories. It operates through the followings segments: ACCO Brands North America, ACCO Brands EMEA, and ACCO Brands International. The ACCO Brands North America segment includes the U.S. and Canada operations, wherein it manufactures, sources, and sells traditional office products, school supplies, and calendar products. The ACCO Brands EMEA segment deals with the design, sourcing, and distribution of storage and organization products, stapling, punching, laminating, binding and shredding, do-it-yourself tools, and computer accessories in Europe, the Middle East, and Africa. The ACCO Brands International segments refers to the operations from the rest of the world, primarily Australia/New Zealand, Latin America, and Asia-Pacific The company was founded by Fred J. Kline in 1903 and is headquartered in Lake Zurich, IL. |
| Insider Trading |
Relationship |
Date |
Transaction |
Cost |
#Shares |
Value ($) |
#Shares Total |
SEC Form 4 |
| Tedford Thomas W | President & CEO | Mar 12 '24 | Option Exercise | 0.00 | 83,893 | 0 | 468,608 | Mar 14 02:35 PM | | Monko Cezary L | Exec VP; Pres ACCO Brands EMEA | Mar 12 '24 | Option Exercise | 0.00 | 68,644 | 0 | 238,474 | Mar 14 02:44 PM | | Dudek James | SVP, Corp Controller and CAO | Mar 12 '24 | Option Exercise | 0.00 | 15,256 | 0 | 35,252 | Mar 14 02:50 PM | | Jones Angela Y | SVP, Global Chief People Offic | Mar 12 '24 | Option Exercise | 0.00 | 26,697 | 0 | 38,930 | Mar 14 03:36 PM | | Daniel Paul P | SVP and CIO | Mar 12 '24 | Option Exercise | 0.00 | 12,205 | 0 | 12,221 | Mar 14 03:57 PM |
|
|
|
 |
| Market Cap | 19.97B | EPS (ttm) | 4.37 |
| P/E | 17.13 | EPS this Y | 5.25% |
| Forward P/E | 15.27 | EPS next Y | 6.44% |
| PEG | 3.57 | EPS past 5Y | 5.69% |
| P/S | 2.66 | EPS next 5Y | 4.80% |
| P/B | 1.76 | EPS Q/Q | -4.45% |
| Dividend | 3.56% | Sales Q/Q | -20.92% |
| Insider Own | 0.38% | Inst Own | 79.59% |
| Insider Trans | -1.55% | Inst Trans | -1.63% |
| Short Float | 1.57% | Earnings | May 02/a |
| Analyst Recom | 2.56 | Target Price | 76.22 |
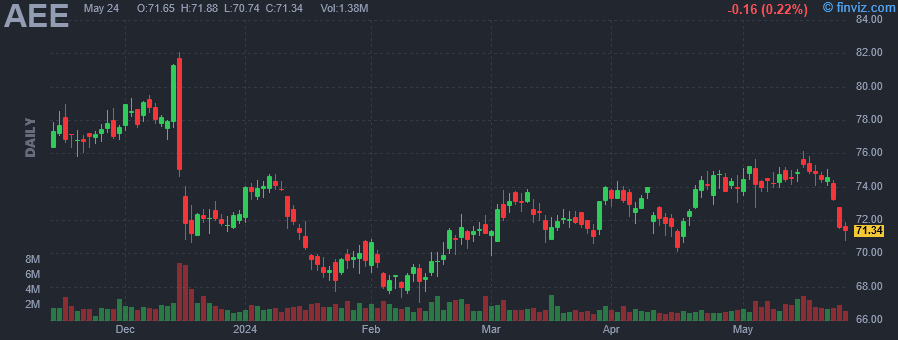
| Avg Volume | 1.67M | 52W Range | 67.03 - 90.72 |
|
|
|
|
Ameren Corp. is a public utility holding company, which engages in the provision of electric and natural gas services. It operates through the following segments: Ameren Missouri, Ameren Illinois Electric Distribution, Ameren Illinois Natural Gas, Ameren Transmission, and Other. The Ameren Transmission segment consists of the aggregated electric transmission businesses of Ameren Illinois and Ameren Transmission Company of Illinois (ATXI). The company was founded in 1902 and is headquartered in St. Louis, MO. |
| Insider Trading |
Relationship |
Date |
Transaction |
Cost |
#Shares |
Value ($) |
#Shares Total |
SEC Form 4 |
| Schukar Shawn E | Chmn & President of Subsidiary | Mar 14 '24 | Sale | 71.26 | 2,330 | 166,036 | 56,499 | Mar 14 04:33 PM | | LYONS MARTIN J | Chairman, President & CEO | Mar 04 '24 | Sale | 70.70 | 7,270 | 513,989 | 246,434 | Mar 04 05:39 PM | | Lindgren Mark C | EVP & Chief HR Officer of Sub | Mar 04 '24 | Sale | 70.70 | 1,630 | 115,241 | 47,883 | Mar 04 05:39 PM | | Flores Rafael | Director | Nov 29 '23 | Sale | 77.65 | 1,500 | 116,475 | 13,007 | Dec 01 05:07 PM | | MOEHN MICHAEL L | Sr Executive VP & CFO | Nov 15 '23 | Sale | 77.28 | 3,244 | 250,696 | 198,937 | Nov 17 07:34 PM |
|
|
| |
 |
| Market Cap | 13.41B | EPS (ttm) | 0.33 |
| P/E | 57.59 | EPS this Y | 8.40% |
| Forward P/E | 9.06 | EPS next Y | 9.07% |
| PEG | 7.68 | EPS past 5Y | -25.72% |
| P/S | 1.06 | EPS next 5Y | 7.50% |
| P/B | 7.65 | EPS Q/Q | 88.84% |
| Dividend | 3.69% | Sales Q/Q | -3.01% |
| Insider Own | 0.44% | Inst Own | 86.49% |
| Insider Trans | 1.29% | Inst Trans | 0.31% |
| Short Float | 1.74% | Earnings | May 02/a |
| Analyst Recom | 1.71 | Target Price | 21.90 |
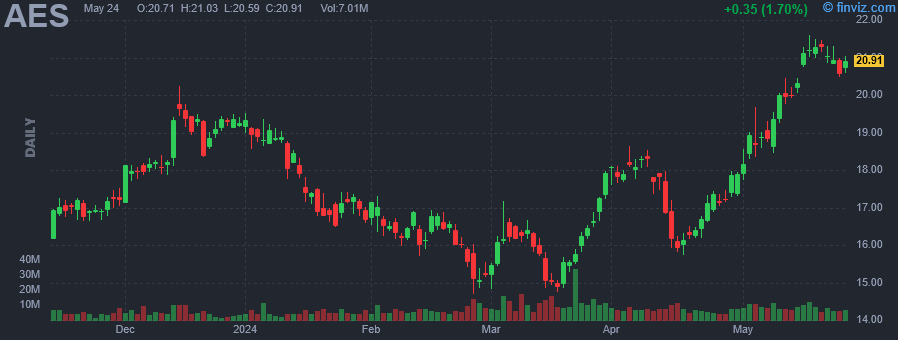
| Avg Volume | 9.16M | 52W Range | 11.43 - 23.16 |
|
|
|
|
The AES Corp. engages in the provision of power generation and utility services through its renewable and thermal generation facilities and distribution businesses. It operates through the following segments: U.S. and Utilities Strategic Business Unit (SBU), South America SBU, MCAC SBU, Eurasia SBU. The U.S. and Utilities SBU segment consists of facilities in the United States, Puerto Rico and El Salvador. The South America SBU segment covers Chile, Colombia, Argentina, and Brazil. The MCAC SBU segment refers to Mexico, Central America, and the Caribbean. The Eurasia SBU segment handles operations in Europe and Asia. The company was founded by Dennis W. Bakke and Roger W. Sant in 1981 and is headquartered in Arlington, VA. |
| Insider Trading |
Relationship |
Date |
Transaction |
Cost |
#Shares |
Value ($) |
#Shares Total |
SEC Form 4 |
| Falu Ricardo Manuel | EVP, COO, Pres. New Enrgy Tech | Mar 12 '24 | Buy | 16.01 | 6 | 96 | 84,785 | Apr 15 07:50 PM | | Gluski Andres | President and CEO | Feb 12 '24 | Option Exercise | 14.63 | 396,053 | 5,794,255 | 1,922,502 | Feb 14 04:16 PM | | Falu Ricardo Manuel | EVP, COO, Pres. New Enrgy Tech | Dec 28 '23 | Buy | 19.21 | 73 | 1,402 | 84,779 | Apr 15 07:50 PM | | Mendoza Tish | EVP & Chief HR Officer | Dec 13 '23 | Option Exercise | 14.63 | 24,643 | 360,527 | 188,855 | Dec 14 04:40 PM | | Mendoza Tish | EVP & Chief HR Officer | Dec 13 '23 | Sale | 18.95 | 21,594 | 409,206 | 167,261 | Dec 14 04:40 PM |
|
|
|
 |
| Market Cap | 233.67M | EPS (ttm) | -1.03 |
| P/E | - | EPS this Y | 9.93% |
| Forward P/E | - | EPS next Y | 47.10% |
| PEG | - | EPS past 5Y | - |
| P/S | 4.35 | EPS next 5Y | - |
| P/B | 15.13 | EPS Q/Q | -33.29% |
| Dividend | - | Sales Q/Q | 11.61% |
| Insider Own | 40.41% | Inst Own | 30.82% |
| Insider Trans | -1.40% | Inst Trans | 14.28% |
| Short Float | 0.82% | Earnings | May 02/a |
| Analyst Recom | 1.00 | Target Price | 12.75 |
| Avg Volume | 147.64K | 52W Range | 3.69 - 8.08 |
|
|
|
|
Arteris, Inc. engages in the provision of interconnect and other intellectual property technology. Its products include Non-Coherent NoC IP, Coherent NoC IP, Last-level Cache Ip, and IP Development Technolgy. The company was founded by Philippe Boucard, Cesar Douady, and Alain Henri Roger Fanet in February 2003 and is headquartered in Campbell, CA. |
| Insider Trading |
Relationship |
Date |
Transaction |
Cost |
#Shares |
Value ($) |
#Shares Total |
SEC Form 4 |
| Hawkins Nicholas B. | VP and Chief Financial Officer | Apr 11 '24 | Sale | 7.22 | 10,000 | 72,161 | 252,896 | Apr 15 04:37 PM | | Hawkins Nicholas B. | VP and Chief Financial Officer | Apr 04 '24 | Sale | 7.28 | 2,242 | 16,324 | 262,896 | Apr 04 05:42 PM | | Alpern Paul L | VP and General Counsel | Apr 03 '24 | Sale | 7.18 | 3,292 | 23,625 | 81,042 | Apr 04 05:29 PM | | Moll Laurent R | Chief Operating Officer | Apr 03 '24 | Sale | 7.17 | 581 | 4,167 | 588,306 | Apr 04 05:29 PM | | JANAC K CHARLES | President and CEO | Apr 02 '24 | Sale | 7.03 | 10,103 | 71,000 | 318,644 | Apr 04 05:29 PM |
|
|
| |
 |
| Market Cap | 2.34B | EPS (ttm) | 11.36 |
| P/E | 17.09 | EPS this Y | 6.76% |
| Forward P/E | 14.49 | EPS next Y | 10.43% |
| PEG | 2.59 | EPS past 5Y | 12.70% |
| P/S | 1.38 | EPS next 5Y | 6.60% |
| P/B | 2.47 | EPS Q/Q | 7.55% |
| Dividend | 0.45% | Sales Q/Q | 8.00% |
| Insider Own | 4.34% | Inst Own | 93.92% |
| Insider Trans | -1.24% | Inst Trans | -3.44% |
| Short Float | 1.83% | Earnings | May 02/a |
| Analyst Recom | 1.20 | Target Price | 239.60 |
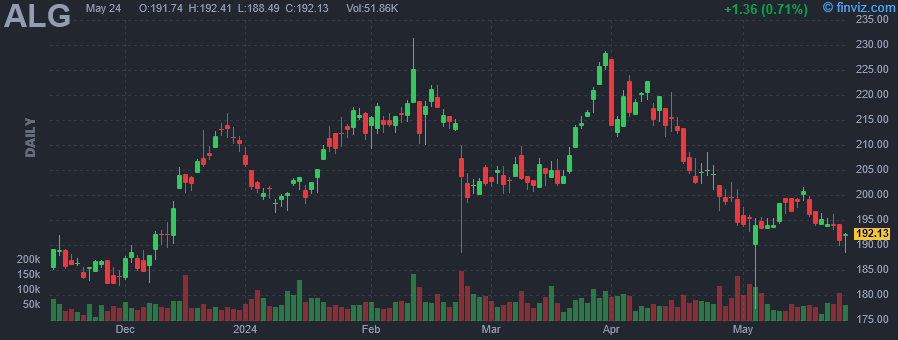
| Avg Volume | 72.77K | 52W Range | 157.74 - 231.40 |
|
|
|
|
Alamo Group, Inc. engages in the design and manufacture of agricultural equipment and infrastructure maintenance equipment for governmental and industrial use. Its products include tractor-mounted mowing and other vegetation maintenance equipment, street sweepers, excavators, vacuum trucks, snow removal equipment, zero turn radius mowers, agricultural implements, and related aftermarket parts. It operates through the Vegetation Management and Industrial Equipment segments. The Vegetation Management segment includes all of the operations of the former agricultural division plus the mowing and tree care operations. The Industrial Equipment segment covers the company's vocational truck business and other industrial operations such as excavators, vacuum trucks, street sweepers, and snow removal equipment. The company was founded by Donald J. Douglass in 1969 and is headquartered in Seguin, TX. |
| Insider Trading |
Relationship |
Date |
Transaction |
Cost |
#Shares |
Value ($) |
#Shares Total |
SEC Form 4 |
| Haberman Michael A | EVP Industrial Equipment | Mar 28 '24 | Sale | 225.11 | 3,050 | 686,586 | 16,156 | Mar 29 11:23 AM | | Haberman Michael A | EVP Industrial Equipment | Mar 27 '24 | Option Exercise | 54.61 | 1,700 | 92,838 | 19,624 | Mar 29 11:23 AM | | Haberman Michael A | EVP Industrial Equipment | Mar 27 '24 | Sale | 223.87 | 418 | 93,577 | 19,206 | Mar 29 11:23 AM | | Sullivan Lori L | VP, Internal Audit | Jan 12 '24 | Option Exercise | 69.43 | 1,000 | 69,430 | 3,249 | Jan 16 11:59 AM | | Raborn Richard Hodges | EVP Vegetation Management | Dec 22 '23 | Sale | 212.24 | 606 | 128,617 | 9,032 | Dec 26 08:27 PM |
|
|
|
 |
| Market Cap | 1.00B | EPS (ttm) | -0.79 |
| P/E | - | EPS this Y | 23.57% |
| Forward P/E | - | EPS next Y | 13.57% |
| PEG | - | EPS past 5Y | -35.06% |
| P/S | 0.55 | EPS next 5Y | - |
| P/B | 6.33 | EPS Q/Q | 19.57% |
| Dividend | - | Sales Q/Q | 28.63% |
| Insider Own | 52.41% | Inst Own | 40.95% |
| Insider Trans | -0.10% | Inst Trans | -2.48% |
| Short Float | 5.17% | Earnings | May 02/a |
| Analyst Recom | 2.17 | Target Price | 8.00 |
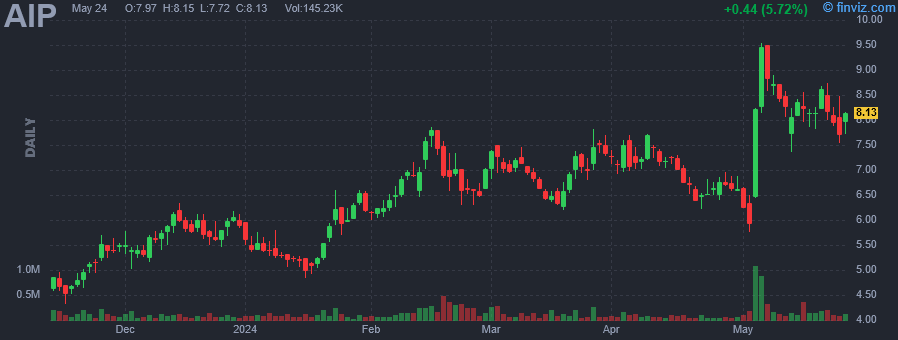
| Avg Volume | 923.02K | 52W Range | 4.46 - 9.20 |
|
|
|
|
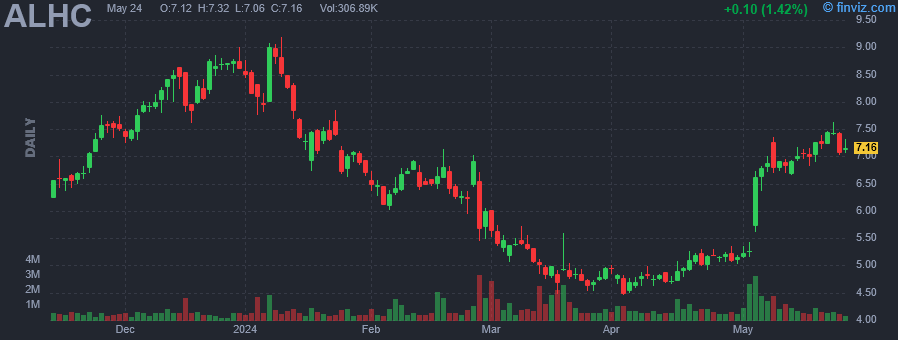
Alignment Healthcare, Inc. operates as a holding company. The company offers a consumer-centric platform that delivers customized health care solutions to seniors and those who need it most, the chronically ill and frail, through its Medicare Advantage plans. The firm offers health plan options through Alignment Health Plan, and partners with select health plans to help deliver better benefits at lower costs. The company was founded by John E. Kao in 2013 and is headquartered Orange, CA. |
| Insider Trading |
Relationship |
Date |
Transaction |
Cost |
#Shares |
Value ($) |
#Shares Total |
SEC Form 4 |
| Maroney Dawn Christine | President, Markets | Mar 28 '24 | Sale | 4.84 | 10,151 | 49,131 | 1,976,097 | Mar 29 08:00 PM | | Kardes Hakan | Chief Experience Officer | Mar 28 '24 | Sale | 4.84 | 4,363 | 21,117 | 430,444 | Mar 29 08:00 PM | | Freeman Robert Thomas | Chief Financial Officer | Mar 28 '24 | Sale | 4.84 | 4,299 | 20,807 | 865,407 | Mar 29 08:00 PM | | Scavo Robert L. | Chief Information Officer | Mar 28 '24 | Sale | 4.84 | 1,821 | 8,814 | 436,822 | Mar 29 08:00 PM | | Maroney Dawn Christine | President, Markets | Mar 20 '24 | Sale | 4.83 | 13,252 | 64,007 | 1,986,248 | Mar 21 05:00 PM |
|
|
|
 |
| Market Cap | 6.82B | EPS (ttm) | -0.14 |
| P/E | - | EPS this Y | 12.70% |
| Forward P/E | 56.76 | EPS next Y | 12.86% |
| PEG | - | EPS past 5Y | - |
| P/S | 11.14 | EPS next 5Y | - |
| P/B | 9.41 | EPS Q/Q | 60.33% |
| Dividend | - | Sales Q/Q | 6.90% |
| Insider Own | 33.62% | Inst Own | 65.75% |
| Insider Trans | -3.29% | Inst Trans | -0.40% |
| Short Float | 6.08% | Earnings | May 02/a |
| Analyst Recom | 1.91 | Target Price | 93.57 |
| Avg Volume | 404.90K | 52W Range | 57.59 - 92.92 |
|
|
|
|
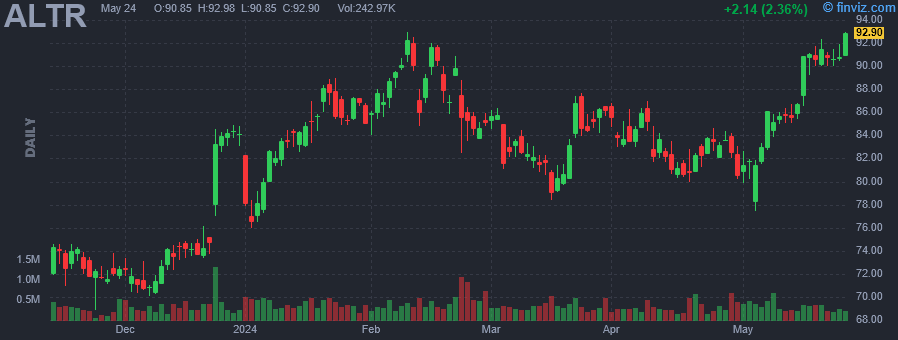
Altair Engineering, Inc. engages in the provision of software and cloud solutions for product design & development, high performance cloud computing, and data intelligence. It operates through the following segments: Software and Client Engineering Services. The Software segment includes a portfolio of software products, as well as solvers and optimization technology products, modelling and visualization tools. The Client Engineering Services segment engages in the provision of client engineering services to support customers with long-term, ongoing product design and development expertise. The company was founded by James Ralph Scapa in 1985 and is headquartered in Troy, MI. |
| Insider Trading |
Relationship |
Date |
Transaction |
Cost |
#Shares |
Value ($) |
#Shares Total |
SEC Form 4 |
| Christ Revocable Trust | 10% Owner | Apr 09 '24 | Sale | 85.85 | 12,783 | 1,097,379 | 187,217 | Apr 11 04:38 PM | | Christ George J | 10% Owner | Apr 09 '24 | Sale | 85.85 | 12,783 | 1,097,379 | 187,217 | Apr 11 04:44 PM | | Harris Teresa A | Director | Apr 02 '24 | Option Exercise | 0.00 | 620 | 0 | 19,515 | Apr 03 10:17 AM | | Harris Teresa A | Director | Apr 02 '24 | Sale | 84.00 | 620 | 52,080 | 18,895 | Apr 03 10:17 AM | | Christ Revocable Trust | 10% Owner | Mar 28 '24 | Sale | 85.99 | 83,336 | 7,165,779 | 200,000 | Apr 01 10:41 AM |
|
|
|
