 |
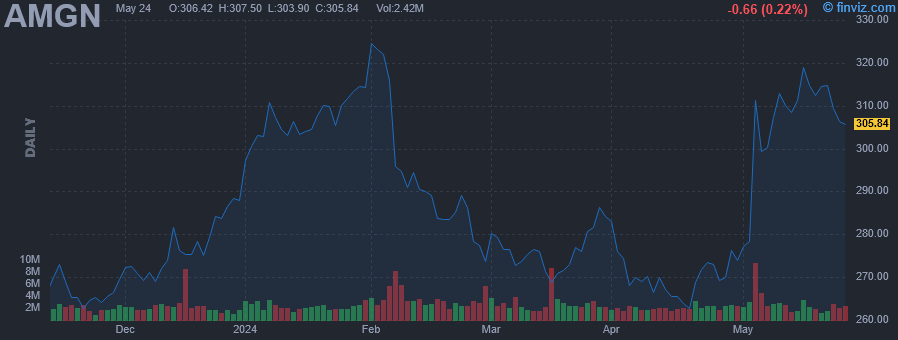
| Market Cap | 166.85B | EPS (ttm) | 6.99 |
| P/E | 44.52 | EPS this Y | 4.61% |
| Forward P/E | 15.05 | EPS next Y | 6.01% |
| PEG | 8.49 | EPS past 5Y | -0.22% |
| P/S | 5.67 | EPS next 5Y | 5.25% |
| P/B | 33.23 | EPS Q/Q | -103.99% |
| Dividend | 2.99% | Sales Q/Q | 23.03% |
| Insider Own | 0.24% | Inst Own | 78.11% |
| Insider Trans | -0.93% | Inst Trans | -1.47% |
| Short Float | 1.89% | Earnings | May 02/a |
| Analyst Recom | 2.16 | Target Price | 313.89 |
| Avg Volume | 2.93M | 52W Range | 211.71 - 329.72 |
|
|
| Today | Upgrade |
William Blair |
Mkt Perform → Outperform |
|
| Today | Upgrade |
Barclays |
Underweight → Equal Weight |
$230 → $300 |
|
|
Today 04:04PM
|
Amgen Is 'Very Encouraged' With Its Obesity Drug. But Can It Take On Novo, Lilly Duopoly?
(Investor's Business Daily) +11.84% |
|
03:46PM
|
These Stocks Are Moving the Most Today: Apple, Amgen, Expedia, Coinbase, Cloudflare, Fortinet, Live Nation, and More
(Barrons.com) |
|
02:53PM
|
Analyst unveils Amgen stock price target after weight-loss drug data
(TheStreet) |
|
01:58PM
|
Sector Update: Health Care Stocks Mixed in Afternoon Trading
(MT Newswires) |
|
01:00PM
|
Interest rate cuts could switch from stroll to a sprint after US jobs surprise
(The Telegraph) |
|
12:53PM
|
Top Stock Movers Now: Apple, Amgen, Fortinet, and More
(Investopedia) |
|
12:31PM
|
Apple, Amgen rise; Expedia, Fortinet fall, Friday, 5/3/2024
(Associated Press Finance) |
|
12:26PM
|
Stocks to Watch Friday: Amgen, Apple, Exxon
(The Wall Street Journal) |
|
12:14PM
|
Top Midday Stories: Apple's Dividend, Buybacks Announcements; Amgen Obesity Drug Trial Results; Exxon Completes Pioneer Acquisition
(MT Newswires) |
|
12:13PM
|
US STOCKS-Wall St rallies after soft jobs data allays rate jitters
(Reuters) |
|
Amgen, Inc. is a biotechnology company, which engages in the discovery, development, manufacture, and marketing of human therapeutics. It operates through Human Therapeutics segment. The company was founded by William K. Bowes, Jr., Franklin Pitcher Johnson, Jr., George B. Rathmann, and Joseph Rubinfeld on April 8, 1980 and is headquartered in Thousand Oaks, CA. |
| Insider Trading |
Relationship |
Date |
Transaction |
Cost |
#Shares |
Value ($) |
#Shares Total |
SEC Form 4 |
| Grygiel Nancy A. | SVP & CCO | Dec 04 '23 | Sale | 273.03 | 2,096 | 572,276 | 10,874 | Dec 04 07:41 PM | | Graham Jonathan P | EVP, Gen. Counsel & Secy. | Nov 08 '23 | Sale | 272.81 | 10,000 | 2,728,136 | 28,078 | Nov 13 08:30 PM | | AMGEN INC | 10% Owner | Sep 19 '23 | Buy | 17.00 | 1,764,705 | 29,999,985 | 35,368,653 | Sep 19 07:52 PM | | Gordon Murdo | EVP, Global Commercial Ops | Aug 10 '23 | Sale | 262.43 | 9,558 | 2,508,306 | 44,308 | Aug 11 06:13 PM |
|
|
 |
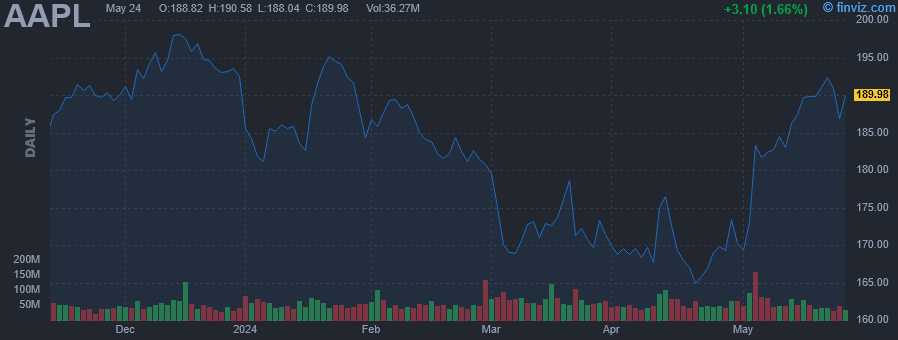 |
| Market Cap | 2831.43B | EPS (ttm) | 6.43 |
| P/E | 28.51 | EPS this Y | 7.35% |
| Forward P/E | 25.57 | EPS next Y | 8.98% |
| PEG | 2.59 | EPS past 5Y | 15.55% |
| P/S | 7.42 | EPS next 5Y | 11.00% |
| P/B | 38.43 | EPS Q/Q | 0.35% |
| Dividend | 0.54% | Sales Q/Q | -4.31% |
| Insider Own | 0.09% | Inst Own | 61.79% |
| Insider Trans | -4.48% | Inst Trans | -0.48% |
| Short Float | 0.66% | Earnings | May 02/a |
| Analyst Recom | 2.09 | Target Price | 199.97 |
| Avg Volume | 61.58M | 52W Range | 164.07 - 199.62 |
|
|
| Today | Upgrade |
Itau BBA |
Underperform → Market Perform |
$162 → $188 |
| Today | Reiterated |
Monness Crespi & Hardt |
Buy |
$200 → $205 |
|
|
Today 04:12PM
|
Stocks jump after April jobs data, Apple buyback announcement
(Yahoo Finance Video) +5.97% |
|
03:56PM
|
Apple bulls raise price targets after buyback announcement
(Yahoo Finance Video) |
|
03:51PM
|
Hudson Pacific Properties, Inc. (NYSE:HPP) Q1 2024 Earnings Call Transcript
(Insider Monkey) |
|
03:46PM
|
These Stocks Are Moving the Most Today: Apple, Amgen, Expedia, Coinbase, Cloudflare, Fortinet, Live Nation, and More
(Barrons.com) |
|
03:44PM
|
Equities Higher Amid Apple Rally as Traders Parse Jobs Data
(MT Newswires) |
|
03:37PM
|
7 Apple Analysts Size Up Q2 Results: Artificial Intelligence 'A Major Upgrade Cycle Within Product Categories Such As The iPhone'
(Benzinga) |
|
03:36PM
|
Apollo Global Management, Inc. (NYSE:APO) Q1 2024 Earnings Call Transcript
(Insider Monkey) |
|
03:29PM
|
Apple's stock could be poised for more run-up, says Bernstein's Toni Sacconaghi
(CNBC TV) |
|
03:29PM
|
Apple might be 'stuck in the last tech boom,' says Needham's Laura Martin
(CNBC TV) |
|
03:23PM
|
Apple's iPhone Growth in China, Third-Quarter Revenue Outlook Deter Bears, Oppenheimer Says
(MT Newswires) |
|
Apple, Inc. engages in the design, manufacture, and sale of smartphones, personal computers, tablets, wearables and accessories, and other varieties of related services. It operates through the following geographical segments: Americas, Europe, Greater China, Japan, and Rest of Asia Pacific. The Americas segment includes North and South America. The Europe segment consists of European countries, as well as India, the Middle East, and Africa. The Greater China segment comprises China, Hong Kong, and Taiwan. The Rest of Asia Pacific segment includes Australia and Asian countries. Its products and services include iPhone, Mac, iPad, AirPods, Apple TV, Apple Watch, Beats products, AppleCare, iCloud, digital content stores, streaming, and licensing services. The company was founded by Steven Paul Jobs, Ronald Gerald Wayne, and Stephen G. Wozniak in April 1976 and is headquartered in Cupertino, CA. |
| Insider Trading |
Relationship |
Date |
Transaction |
Cost |
#Shares |
Value ($) |
#Shares Total |
SEC Form 4 |
| WILLIAMS JEFFREY E | COO | Apr 11 '24 | Sale | 172.22 | 59,162 | 10,188,880 | 489,944 | Apr 15 06:31 PM | | Maestri Luca | Senior Vice President, CFO | Apr 11 '24 | Sale | 174.12 | 53,194 | 9,261,933 | 107,788 | Apr 15 06:30 PM | | COOK TIMOTHY D | Chief Executive Officer | Apr 02 '24 | Sale | 168.62 | 97,227 | 16,394,529 | 3,280,180 | Apr 03 06:31 PM | | O'BRIEN DEIRDRE | Senior Vice President | Apr 02 '24 | Sale | 168.91 | 54,732 | 9,244,782 | 136,572 | Apr 03 06:33 PM | | Adams Katherine L. | SVP, GC and Secretary | Apr 02 '24 | Sale | 168.90 | 54,732 | 9,244,235 | 293,393 | Apr 03 06:30 PM |
|
|
|
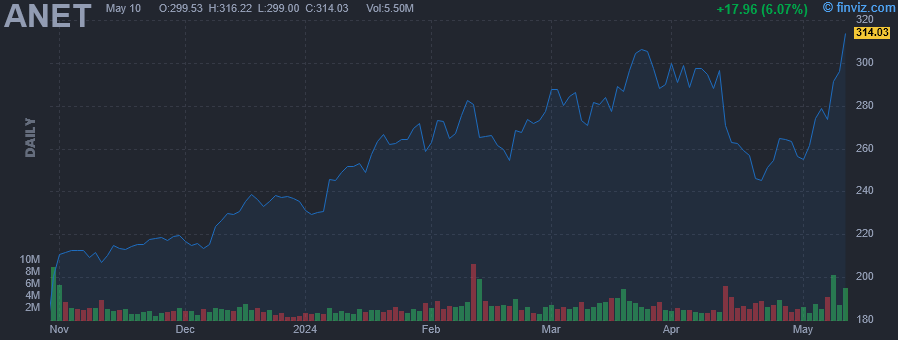 |
| Market Cap | 86.05B | EPS (ttm) | 6.58 |
| P/E | 41.71 | EPS this Y | 8.04% |
| Forward P/E | 31.97 | EPS next Y | 14.48% |
| PEG | 2.15 | EPS past 5Y | 45.36% |
| P/S | 14.68 | EPS next 5Y | 19.40% |
| P/B | 11.87 | EPS Q/Q | 42.04% |
| Dividend | - | Sales Q/Q | 20.77% |
| Insider Own | 18.29% | Inst Own | 69.26% |
| Insider Trans | -1.65% | Inst Trans | 1.40% |
| Short Float | 1.09% | Earnings | May 07/a |
| Analyst Recom | 1.82 | Target Price | 302.47 |
| Avg Volume | 2.70M | 52W Range | 131.68 - 307.74 |
|
|
| Today | Upgrade |
Jefferies |
Hold → Buy |
$240 → $320 |
|
|
|
Arista Networks, Inc. engages in the business of developing, marketing, and selling cloud networking solutions. The firm is also involved in switching and routing platforms and related network applications. The company was founded by Andreas Bechtolsheim, David Cheriton, and Kenneth Duda in November 2004 and is headquartered in Santa Clara, CA. |
| Insider Trading |
Relationship |
Date |
Transaction |
Cost |
#Shares |
Value ($) |
#Shares Total |
SEC Form 4 |
| Duda Kenneth | CTO and SVP Software Eng. | Apr 10 '24 | Option Exercise | 17.09 | 20,000 | 341,700 | 23,244 | Apr 12 06:57 PM | | Duda Kenneth | CTO and SVP Software Eng. | Apr 10 '24 | Sale | 290.05 | 20,000 | 5,800,910 | 3,244 | Apr 12 06:57 PM | | Duda Kenneth | CTO and SVP Software Eng. | Apr 10 '24 | Sale | 290.05 | 16,000 | 4,640,725 | 243,268 | Apr 12 06:57 PM | | Ullal Jayshree | President and CEO | Apr 09 '24 | Sale | 299.99 | 4,042 | 1,212,560 | 1,628,532 | Apr 11 07:21 PM | | McCool John F | Chief Platform Officer | Apr 04 '24 | Option Exercise | 56.59 | 416 | 23,539 | 416 | Apr 08 07:15 PM |
|
|
| |
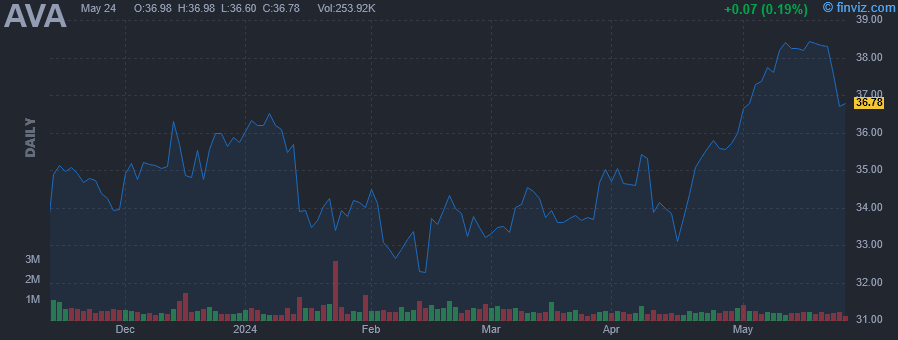 |
| Market Cap | 2.92B | EPS (ttm) | 2.41 |
| P/E | 15.46 | EPS this Y | 9.04% |
| Forward P/E | 14.35 | EPS next Y | 6.45% |
| PEG | 2.49 | EPS past 5Y | 1.58% |
| P/S | 1.55 | EPS next 5Y | 6.20% |
| P/B | 1.16 | EPS Q/Q | 25.46% |
| Dividend | 5.09% | Sales Q/Q | 28.40% |
| Insider Own | 1.01% | Inst Own | 86.11% |
| Insider Trans | -0.39% | Inst Trans | 1.23% |
| Short Float | 3.66% | Earnings | May 01/b |
| Analyst Recom | 3.00 | Target Price | 35.67 |
| Avg Volume | 527.15K | 52W Range | 30.53 - 44.76 |
|
|
| Today | Upgrade |
Mizuho |
Underperform → Neutral |
$36 |
|
|
|
Avista Corp. is a holding company, which engages in the electric and natural gas utility businesses. It operates through the Avista Utilities and Alaska Electric Light and Power Company segments. The Avista Utilities segment includes electric distribution and transmission, and natural gas distribution services in parts of eastern Washington, Northern Idaho, and Northeastern and Southwestern Oregon. The Alaska Electric Light and Power Company segment offers electric services in Juneau. The company was founded on March 13, 1889 and is headquartered in Spokane, WA. |
| Insider Trading |
Relationship |
Date |
Transaction |
Cost |
#Shares |
Value ($) |
#Shares Total |
SEC Form 4 |
| BURKE DONALD C | Director | Dec 01 '23 | Sale | 34.46 | 2,400 | 82,704 | 25,605 | Dec 04 10:22 AM | | KENSOK JAMES M | Vice President - Retired | Nov 15 '23 | Sale | 34.75 | 700 | 24,325 | 12,574 | Nov 15 10:50 AM | | MORRIS SCOTT L | Chairman of the Board | Aug 24 '23 | Buy | 32.39 | 3,100 | 100,424 | 128,169 | Aug 25 11:52 AM | | MEYER DAVID J | Vice President | Aug 09 '23 | Sale | 36.61 | 1,050 | 38,440 | 4,677 | Aug 09 10:56 AM | | MEYER DAVID J | Vice President | Aug 08 '23 | Sale | 36.90 | 1,050 | 38,745 | 5,727 | Aug 09 10:56 AM |
|
|
|
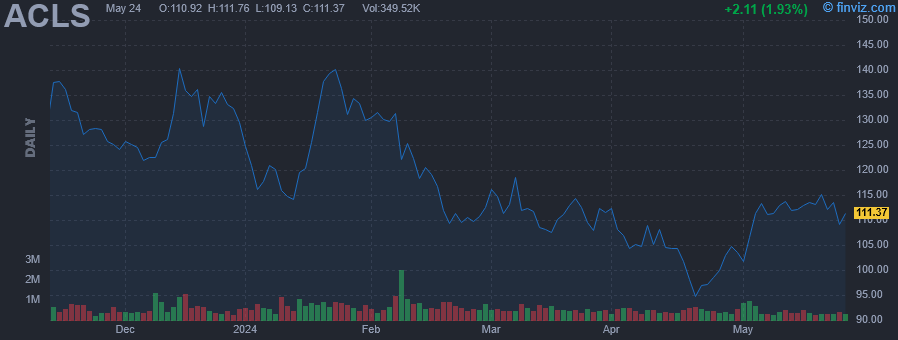 |
| Market Cap | 3.64B | EPS (ttm) | 7.56 |
| P/E | 14.74 | EPS this Y | -14.10% |
| Forward P/E | 13.61 | EPS next Y | 28.34% |
| PEG | 0.74 | EPS past 5Y | 40.64% |
| P/S | 3.22 | EPS next 5Y | 20.00% |
| P/B | 4.03 | EPS Q/Q | 9.38% |
| Dividend | - | Sales Q/Q | -0.65% |
| Insider Own | 1.56% | Inst Own | 91.68% |
| Insider Trans | 0.01% | Inst Trans | 1.98% |
| Short Float | 6.29% | Earnings | May 01/a |
| Analyst Recom | 1.50 | Target Price | 148.88 |
| Avg Volume | 646.99K | 52W Range | 93.77 - 201.00 |
|
|
| Today | Upgrade |
Craig Hallum |
Hold → Buy |
$130 |
|
|
|
Axcelis Technologies, Inc. engages in the manufacture of capital equipment for the semiconductor chip manufacturing industry. Its ion implantation systems product line includes high and medium current, and energy implanters. It also offers post-sales equipment service and support, such as spare parts, equipment upgrades, used equipment, maintenance services, and customer training. The company was founded in 1978 and is headquartered in Beverly, MA. |
| Insider Trading |
Relationship |
Date |
Transaction |
Cost |
#Shares |
Value ($) |
#Shares Total |
SEC Form 4 |
| Low Russell | PRESIDENT AND CEO | Mar 11 '24 | Buy | 112.39 | 440 | 49,452 | 57,754 | Mar 11 04:15 PM | | COOGAN JAMES GORDON | EVP AND CFO | Feb 29 '24 | Buy | 112.23 | 100 | 11,223 | 5,991 | Feb 29 04:15 PM | | Lawson Douglas A. | EVP, CORPORATE MKTG & STRATEGY | Feb 23 '24 | Buy | 111.04 | 500 | 55,520 | 19,648 | Feb 26 08:15 AM | | KEITHLEY JOSEPH P | Director | Dec 14 '23 | Sale | 140.50 | 500 | 70,250 | 3,157 | Dec 14 04:21 PM | | KEITHLEY JOSEPH P | Director | Nov 10 '23 | Sale | 130.43 | 500 | 65,215 | 4,157 | Nov 13 08:36 AM |
|
|
| |
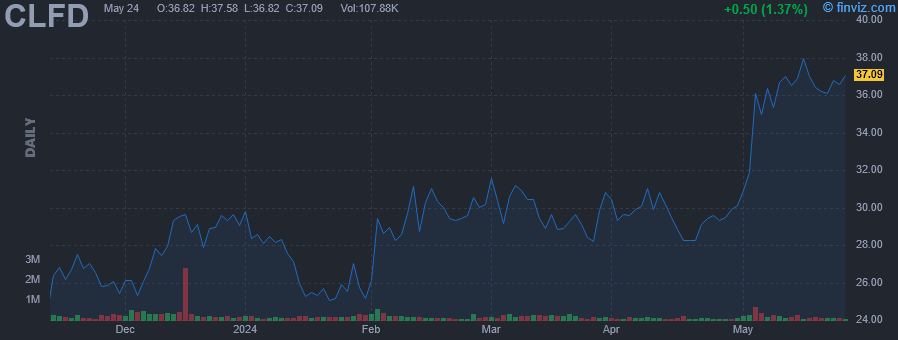 |
| Market Cap | 531.47M | EPS (ttm) | -0.23 |
| P/E | - | EPS this Y | -163.02% |
| Forward P/E | - | EPS next Y | 87.20% |
| PEG | - | EPS past 5Y | 46.82% |
| P/S | 2.92 | EPS next 5Y | - |
| P/B | 1.80 | EPS Q/Q | -159.49% |
| Dividend | - | Sales Q/Q | -48.60% |
| Insider Own | 16.14% | Inst Own | 60.80% |
| Insider Trans | 0.39% | Inst Trans | 26.86% |
| Short Float | 18.83% | Earnings | May 02/a |
| Analyst Recom | 1.50 | Target Price | 38.75 |
| Avg Volume | 191.49K | 52W Range | 22.91 - 50.82 |
|
|
| Today | Upgrade |
Northland Capital |
Market Perform → Outperform |
$25 → $40 |
|
|
|
Clearfield, Inc. engages in the design, manufacture, and distribution of fiber protection. It operates through the Clearfield and Nestor Cable segment. The Clearfield segment involves the design, manufacture, and selling of fiber management, protection, and delivery solutions. The Nestor Cables segment includes designs, manufacture, and selling fiber management, protection, and delivery solutions. The company was founded in 1979 and is headquartered in Brooklyn Park, MN. |
| Insider Trading |
Relationship |
Date |
Transaction |
Cost |
#Shares |
Value ($) |
#Shares Total |
SEC Form 4 |
| Harding Roger G | Director | Mar 05 '24 | Buy | 29.47 | 6,500 | 191,555 | 30,021 | Mar 06 12:09 PM | | Jones Walter Louis JR | Director | Mar 04 '24 | Buy | 30.41 | 818 | 24,875 | 4,737 | Mar 05 09:49 AM | | ROTH RONALD G | Chairman of the Board | Feb 23 '24 | Buy | 29.62 | 2,000 | 59,240 | 1,259,796 | Feb 27 11:21 AM | | Wirsbinski Carol Ann | Director | Aug 08 '23 | Buy | 38.93 | 512 | 19,932 | 2,039 | Aug 09 04:54 PM |
|
|
|
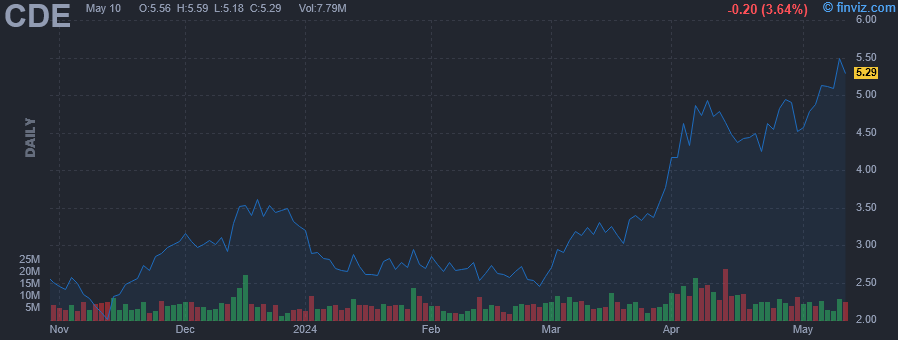 |
| Market Cap | 1.95B | EPS (ttm) | -0.30 |
| P/E | - | EPS this Y | 111.24% |
| Forward P/E | 18.27 | EPS next Y | 933.72% |
| PEG | - | EPS past 5Y | -2.67% |
| P/S | 2.33 | EPS next 5Y | - |
| P/B | 1.91 | EPS Q/Q | 7.47% |
| Dividend | - | Sales Q/Q | 10.82% |
| Insider Own | 1.62% | Inst Own | 69.71% |
| Insider Trans | -0.01% | Inst Trans | 1.66% |
| Short Float | 4.89% | Earnings | May 01/a |
| Analyst Recom | 1.33 | Target Price | 5.46 |
| Avg Volume | 7.90M | 52W Range | 2.00 - 5.47 |
|
|
| Today | Upgrade |
BMO Capital Markets |
Market Perform → Outperform |
|
|
|
|
Coeur Mining, Inc. engages in the exploration and development of silver and gold mining properties and mines located in United States, Canada, and Mexico. It operates through the following segments: Palmarejo, Rochester, Kensington, and Wharf, and Other. The Palmarejo segment includes a gold-silver complex. The Rochester segment operates an open pit heap leach silver-gold mine in northwestern Nevada. The Kensington segment relates to an underground gold mine located north of Juneau, Alaska. The Wharf segment focuses on an open pit heap leach gold mine located near Lead, South Dakota. The company was founded in 1928 and is headquartered in Chicago, IL. |
| Insider Trading |
Relationship |
Date |
Transaction |
Cost |
#Shares |
Value ($) |
#Shares Total |
SEC Form 4 |
| McGrath Aoife | SVP, Exploration | Mar 15 '24 | Buy | 3.23 | 6,200 | 20,020 | 207,308 | Mar 19 05:03 PM | | Watkinson Kenneth J | VP, Corporate Controller & CAO | Nov 27 '23 | Sale | 2.81 | 7,000 | 19,684 | 134,051 | Nov 27 07:06 PM | | McGrath Aoife | SVP, Exploration | Sep 11 '23 | Buy | 2.35 | 6,200 | 14,558 | 129,217 | Sep 13 04:42 PM | | Das Paramita | Director | Aug 14 '23 | Buy | 2.47 | 500 | 1,234 | 22,711 | Aug 16 04:22 PM | | Das Paramita | Director | Aug 11 '23 | Buy | 2.58 | 3,500 | 9,048 | 22,211 | Aug 15 06:46 PM |
|
|
| |
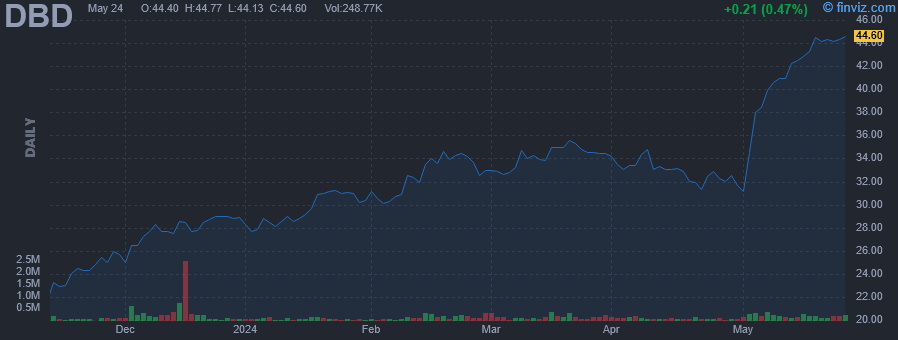 |
| Market Cap | 3.04B | EPS (ttm) | 48.30 |
| P/E | 0.79 | EPS this Y | -74.21% |
| Forward P/E | 6.99 | EPS next Y | 10.46% |
| PEG | 0.26 | EPS past 5Y | - |
| P/S | 0.80 | EPS next 5Y | 3.00% |
| P/B | 1.34 | EPS Q/Q | 72.28% |
| Dividend | - | Sales Q/Q | 4.35% |
| Insider Own | 2.37% | Inst Own | 52.62% |
| Insider Trans | -18.98% | Inst Trans | -19.50% |
| Short Float | 0.44% | Earnings | May 02/b |
| Analyst Recom | 1.00 | Target Price | 46.50 |
| Avg Volume | 150.67K | 52W Range | 16.50 - 35.94 |
|
|
| Today | Upgrade |
Wedbush |
Neutral → Outperform |
$40 → $50 |
|
|
|
Diebold Nixdorf, Inc. engages in the provision of integrated software-led services, self-service delivery and security systems to financial, retail, commercial, and government markets. It offers financial self-services such as self-service support and maintenance, value-added services, self-service software, and self-service products, and security solutions including physical and electronic security. It operates through the following segments: Eurasia Banking, Americas Banking, and Retail. The company was founded in 1859 and is headquartered North Canton, OH. |
| Insider Trading |
Relationship |
Date |
Transaction |
Cost |
#Shares |
Value ($) |
#Shares Total |
SEC Form 4 |
| Capital World Investors | 10% Owner | Apr 04 '24 | Sale | 33.16 | 84 | 2,785 | 341,814 | Apr 05 05:18 PM | | Capital World Investors | 10% Owner | Apr 03 '24 | Sale | 33.44 | 100 | 3,344 | 341,898 | Apr 05 05:18 PM | | Capital World Investors | 10% Owner | Apr 01 '24 | Sale | 34.66 | 100 | 3,466 | 341,998 | Apr 03 05:27 PM | | Capital World Investors | 10% Owner | Mar 28 '24 | Sale | 34.49 | 200 | 6,898 | 342,098 | Apr 01 01:43 PM | | Capital World Investors | 10% Owner | Mar 27 '24 | Sale | 34.57 | 100 | 3,457 | 342,298 | Mar 28 01:56 PM |
|
|
|
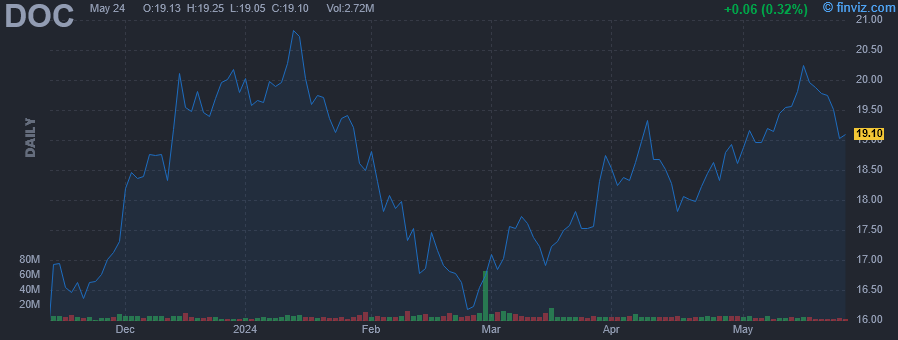 |
| Market Cap | 13.35B | EPS (ttm) | 0.35 |
| P/E | 53.94 | EPS this Y | -24.95% |
| Forward P/E | 32.04 | EPS next Y | 40.90% |
| PEG | - | EPS past 5Y | -24.23% |
| P/S | 5.90 | EPS next 5Y | -12.59% |
| P/B | 1.50 | EPS Q/Q | -94.98% |
| Dividend | 6.36% | Sales Q/Q | 15.39% |
| Insider Own | 0.31% | Inst Own | 75.81% |
| Insider Trans | -0.18% | Inst Trans | -1.76% |
| Short Float | 1.51% | Earnings | Apr 25/a |
| Analyst Recom | 1.70 | Target Price | 21.47 |
| Avg Volume | 7.89M | 52W Range | 15.24 - 22.38 |
|
|
| Today | Upgrade |
Wedbush |
Neutral → Outperform |
|
|
|
|
Healthpeak Properties, Inc. is a Standard & Poor's 500 company, which engages in acquiring, developing, owning, leasing, and managing healthcare real estate across the United States. It operates through the following segments: Lab, Outpatient Medical, Continuing Care Retirement Community (CCRC), and Other Non-Reportable. The Lab segment refers to lab properties, which contain laboratory and office space. The Outpatient Medical segment includes outpatient medical buildings and hospitals. The CCRC segment deals with retirement communities that include independent living, assisted living, memory care, and skilled nursing units. The Other Non-Reportable segment consists of an unconsolidated joint venture with a sovereign wealth fund that owns 19 senior housing assets and loans receivable. The company was founded in 1985 and is headquartered in Denver, CO. |
| Insider Trading |
Relationship |
Date |
Transaction |
Cost |
#Shares |
Value ($) |
#Shares Total |
SEC Form 4 |
| Hall Amy M | SVP-Leasing&Physician Strategy | Dec 08 '23 | Sale | 12.58 | 4,001 | 50,333 | 35,824 | Dec 12 04:10 PM | | Becker Laurie P | SVP - Controller | Sep 14 '23 | Sale | 13.47 | 22,322 | 300,677 | 55,776 | Sep 14 04:16 PM | | BLACK ALBERT JR | Director | Sep 12 '23 | Buy | 13.26 | 2,264 | 30,021 | 101,472 | Sep 13 05:12 PM |
|
|
|
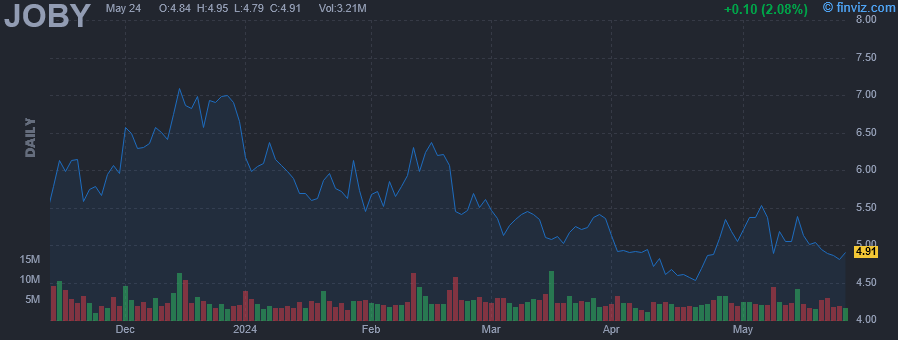 |
| Market Cap | 3.78B | EPS (ttm) | -0.80 |
| P/E | - | EPS this Y | 5.81% |
| Forward P/E | - | EPS next Y | -2.17% |
| PEG | - | EPS past 5Y | - |
| P/S | 3671.25 | EPS next 5Y | -11.81% |
| P/B | 3.63 | EPS Q/Q | -53.30% |
| Dividend | - | Sales Q/Q | - |
| Insider Own | 46.85% | Inst Own | 31.25% |
| Insider Trans | -0.56% | Inst Trans | 0.23% |
| Short Float | 20.57% | Earnings | May 07/a |
| Analyst Recom | 2.33 | Target Price | 8.00 |
| Avg Volume | 5.06M | 52W Range | 3.99 - 11.98 |
|
|
| Today | Upgrade |
JP Morgan |
Underweight → Neutral |
$5 |
|
|
|
Joby Aviation, Inc. is a transportation company, which engages in developing an all-electric, vertical take-off and landing aircraft that intends to operate as a commercial passenger aircraft. The company was founded by Bevirt Joebenn in 2009 and is headquartered in Santa Cruz, CA. |
| Insider Trading |
Relationship |
Date |
Transaction |
Cost |
#Shares |
Value ($) |
#Shares Total |
SEC Form 4 |
| Simi Bonny W | President of Operations | Apr 29 '24 | Option Exercise | 1.77 | 56,581 | 100,148 | 205,147 | May 01 04:08 PM | | Papadopoulos Didier | President of Aircraft OEM | Apr 18 '24 | Sale | 4.64 | 6,091 | 28,262 | 76,284 | Apr 18 06:58 PM | | Bevirt JoeBen | CEO and Chief Architect | Apr 18 '24 | Sale | 4.64 | 5,448 | 25,279 | 662,605 | Apr 18 06:58 PM | | Simi Bonny W | President of Operations | Apr 18 '24 | Sale | 4.64 | 5,243 | 24,328 | 148,566 | Apr 18 06:58 PM | | Field Matthew | See Remarks | Apr 18 '24 | Sale | 4.64 | 4,572 | 21,214 | 283,149 | Apr 18 06:57 PM |
|
|
|
