 |
| Market Cap | 347.40M | EPS (ttm) | -0.02 |
| P/E | - | EPS this Y | -3686.00% |
| Forward P/E | - | EPS next Y | -11.90% |
| PEG | - | EPS past 5Y | 67.21% |
| P/S | 3.43 | EPS next 5Y | -0.90% |
| P/B | - | EPS Q/Q | 109.36% |
| Dividend | - | Sales Q/Q | 32.22% |
| Insider Own | 1.84% | Inst Own | 48.12% |
| Insider Trans | -5.72% | Inst Trans | -20.06% |
| Short Float | 5.41% | Earnings | Mar 11/a |
| Analyst Recom | 2.86 | Target Price | 2.85 |
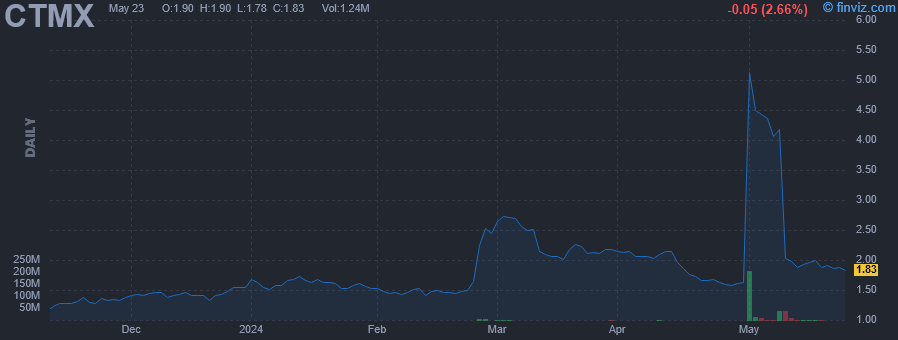
| Avg Volume | 928.95K | 52W Range | 1.04 - 2.86 |
|
|
|
|
CytomX Therapeutics, Inc. is a clinical-stage, oncology-focused biopharmaceutical company, which engages in the development of conditionally activated, biologics localized to the tumor microenvironment. The company was founded by Frederick W. Gluck and Nancy E. Stagliano in September 2010 and is headquartered in South San Francisco, CA. |
| Insider Trading |
Relationship |
Date |
Transaction |
Cost |
#Shares |
Value ($) |
#Shares Total |
SEC Form 4 |
| McCarthy Sean A. | CEO | Mar 26 '24 | Option Exercise | 1.57 | 109,768 | 172,874 | 634,249 | Mar 28 07:12 PM | | McCarthy Sean A. | CEO | Mar 19 '24 | Sale | 2.09 | 20,223 | 42,175 | 524,481 | Mar 21 04:40 PM | | BELVIN MARCIA | SVP, Chief Scientific Officer | Mar 19 '24 | Sale | 2.09 | 12,795 | 26,684 | 168,579 | Mar 21 04:37 PM | | Landau Jeffrey B | Chief Business Officer | Mar 19 '24 | Sale | 2.09 | 6,562 | 13,685 | 110,060 | Mar 21 04:36 PM | | ROWLAND LLOYD A | General Counsel | Mar 19 '24 | Sale | 2.09 | 5,268 | 10,986 | 117,728 | Mar 21 04:41 PM |
|
|
 |
 |
| Market Cap | 200.55M | EPS (ttm) | -9.25 |
| P/E | - | EPS this Y | 81.74% |
| Forward P/E | - | EPS next Y | 17.63% |
| PEG | - | EPS past 5Y | - |
| P/S | 0.37 | EPS next 5Y | - |
| P/B | 1.36 | EPS Q/Q | 91.93% |
| Dividend | - | Sales Q/Q | -0.14% |
| Insider Own | 91.62% | Inst Own | 0.44% |
| Insider Trans | 0.00% | Inst Trans | 28.45% |
| Short Float | 7.96% | Earnings | May 08/a |
| Analyst Recom | 2.60 | Target Price | 11.12 |
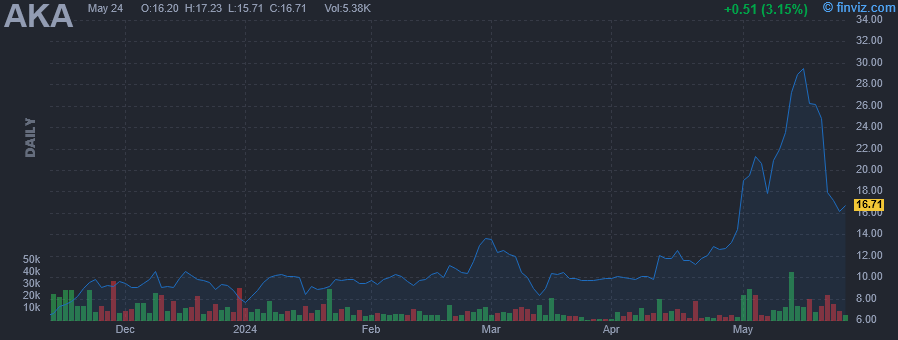
| Avg Volume | 6.50K | 52W Range | 3.60 - 14.51 |
|
|
|
|
a.k.a. Brands Holding Corp. engages in the provision of a portfolio of online fashion products through its digital platform. It operates through the Online and Stores business segments. The Online segment offers fashion products through Culture Kings. The Stores segment provides retail services. The company was founded on May 19, 2021 and is headquartered in San Francisco, CA. |
|
|
 |
| Market Cap | 3.85B | EPS (ttm) | -0.77 |
| P/E | - | EPS this Y | 199.70% |
| Forward P/E | 109.61 | EPS next Y | 39.75% |
| PEG | - | EPS past 5Y | 8.36% |
| P/S | 15.93 | EPS next 5Y | - |
| P/B | 28.00 | EPS Q/Q | 156.17% |
| Dividend | - | Sales Q/Q | 158.72% |
| Insider Own | 3.79% | Inst Own | 109.94% |
| Insider Trans | -13.22% | Inst Trans | 21.24% |
| Short Float | 20.09% | Earnings | Apr 30/a |
| Analyst Recom | 1.29 | Target Price | 120.50 |
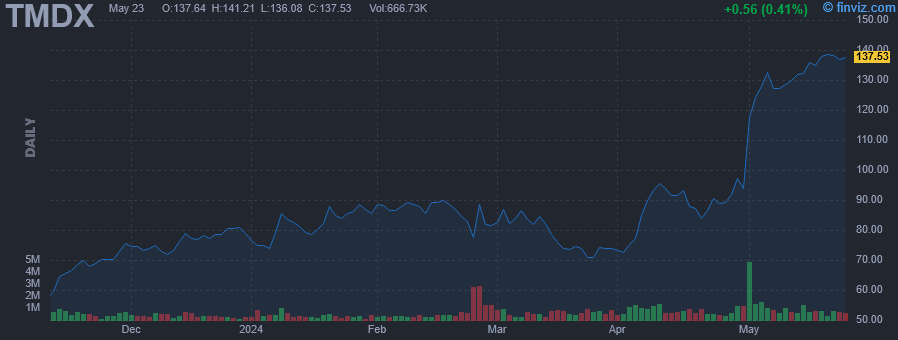
| Avg Volume | 772.29K | 52W Range | 36.42 - 99.63 |
|
|
|
|
TransMedics Group, Inc. operates as a commercial stage medical technology company. The firm engages in the development and commercialization of organ care system platform. It focuses on the preservation of human organs for transplant in a near-physiologic condition to address the limitations of cold storage organ preservation. The company was founded by Waleed H. Hassanein in August 1998 and is headquartered in Andover, MA. |
| Insider Trading |
Relationship |
Date |
Transaction |
Cost |
#Shares |
Value ($) |
#Shares Total |
SEC Form 4 |
| Hassanein Waleed H | President & CEO | Apr 17 '24 | Option Exercise | 13.28 | 4,000 | 53,120 | 78,087 | Apr 18 04:51 PM | | Hassanein Waleed H | President & CEO | Apr 17 '24 | Sale | 95.12 | 4,000 | 380,480 | 74,087 | Apr 18 04:51 PM | | Hassanein Waleed H | President & CEO | Apr 10 '24 | Option Exercise | 13.28 | 12,000 | 159,360 | 86,087 | Apr 12 04:05 PM | | Hassanein Waleed H | President & CEO | Apr 10 '24 | Sale | 95.09 | 12,000 | 1,141,080 | 74,087 | Apr 12 04:05 PM | | Khayal Tamer I | Chief Commercial Officer | Apr 09 '24 | Option Exercise | 26.46 | 15,512 | 410,420 | 40,697 | Apr 10 05:19 PM |
|
|
| |
 |
| Market Cap | 546.85M | EPS (ttm) | -5.25 |
| P/E | - | EPS this Y | 65.21% |
| Forward P/E | - | EPS next Y | 62.29% |
| PEG | - | EPS past 5Y | - |
| P/S | 2.46 | EPS next 5Y | - |
| P/B | 2.64 | EPS Q/Q | 74.45% |
| Dividend | - | Sales Q/Q | 44.70% |
| Insider Own | 37.76% | Inst Own | 42.38% |
| Insider Trans | -7.23% | Inst Trans | -11.90% |
| Short Float | 6.57% | Earnings | Apr 29/a |
| Analyst Recom | 2.00 | Target Price | 11.38 |
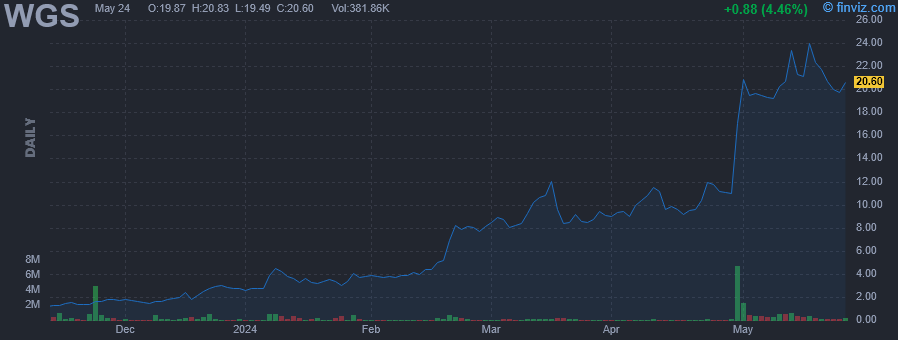
| Avg Volume | 305.98K | 52W Range | 1.16 - 18.24 |
|
|
|
|
GeneDx Holdings Corp. is a patient centered health intelligence company. It engages in transforming healthcare by applying AI and machine learning to multidimensional, longitudinal clinical and genomic data to build dynamic models of human health and defining optimal, individualized health trajectories. The firm, through its Centrellis health intelligence platform, generates a more complete understanding of disease and wellness and provides science-driven solutions to the most pressing medical needs. The company was founded by Eric Schadt in October 2015 and is headquartered in Stamford, CT. |
| Insider Trading |
Relationship |
Date |
Transaction |
Cost |
#Shares |
Value ($) |
#Shares Total |
SEC Form 4 |
| Feeley Kevin | CHIEF FINANCIAL OFFICER | Apr 29 '24 | Option Exercise | 0.00 | 3,013 | 0 | 31,940 | Apr 30 04:27 PM | | Stueland Katherine | Chief Executive Officer | Apr 29 '24 | Option Exercise | 0.00 | 15,496 | 0 | 82,194 | Apr 30 04:30 PM | | Stueland Katherine | Chief Executive Officer | Apr 29 '24 | Sale | 11.04 | 6,325 | 69,808 | 75,869 | Apr 30 04:30 PM | | Feeley Kevin | CHIEF FINANCIAL OFFICER | Apr 29 '24 | Sale | 11.04 | 1,104 | 12,185 | 30,836 | Apr 30 04:27 PM | | Stueland Katherine | CHIEF EXECUTIVE OFFICER | Mar 18 '24 | Sale | 10.59 | 8,559 | 90,661 | 66,698 | Mar 19 04:15 PM |
|
|
|
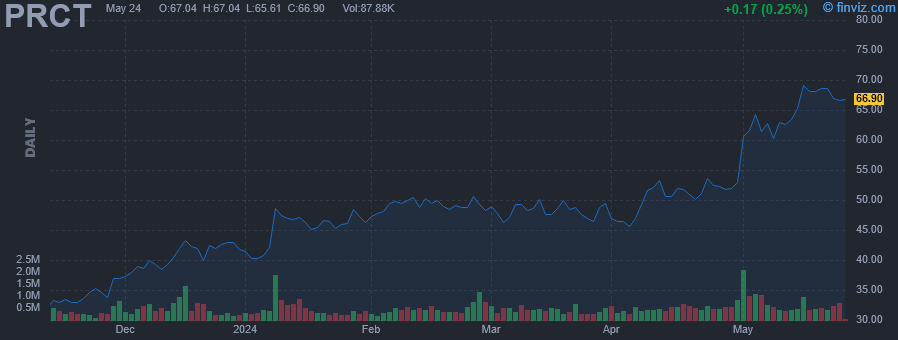 |
| Market Cap | 3.12B | EPS (ttm) | -2.25 |
| P/E | - | EPS this Y | 12.97% |
| Forward P/E | - | EPS next Y | 22.75% |
| PEG | - | EPS past 5Y | -23.27% |
| P/S | 22.88 | EPS next 5Y | 10.80% |
| P/B | 10.96 | EPS Q/Q | 13.60% |
| Dividend | - | Sales Q/Q | 83.29% |
| Insider Own | 4.70% | Inst Own | 88.48% |
| Insider Trans | -13.00% | Inst Trans | -6.33% |
| Short Float | 10.94% | Earnings | May 01/a |
| Analyst Recom | 1.22 | Target Price | 58.57 |
| Avg Volume | 501.61K | 52W Range | 24.83 - 54.79 |
|
|
|
|
PROCEPT BioRobotics Corp. is a commercial-stage surgical robotics company, which engages in the development of transformative solutions in urology. It manufactures and sells the AquaBeam Robotic System, an image-guided, surgical robotic system for use in minimally invasive urologic surgery, with an initial focus on treating BPH. The firm's proprietary AquaBeam Robotic System employs a single-use disposable handpiece to deliver its Aquablation therapy, which combines real-time, multidimensional imaging, personalized treatment planning, automated robotics and heat-free waterjet ablation for targeted and rapid removal of prostate tissue. The company was founded by Nikolai Aljuri and Rodney C. Perkins in 2007 and is headquartered in San Jose, CA. |
| Insider Trading |
Relationship |
Date |
Transaction |
Cost |
#Shares |
Value ($) |
#Shares Total |
SEC Form 4 |
| Zadno Reza | President, CEO | Mar 18 '24 | Sale | 48.83 | 5,391 | 263,243 | 241,319 | Mar 20 04:46 PM | | Waters Kevin | EVP, CFO | Mar 18 '24 | Sale | 48.83 | 1,024 | 50,002 | 102,149 | Mar 20 04:48 PM | | Nouri Alaleh | EVP, CLO, CORP. SEC. | Mar 18 '24 | Sale | 48.83 | 441 | 21,534 | 62,472 | Mar 20 04:52 PM | | Shiblaq Hisham | EVP, Chief Comm. Officer | Mar 18 '24 | Sale | 48.83 | 244 | 11,915 | 55,860 | Mar 20 04:41 PM | | Waters Kevin | EVP, CFO | Mar 15 '24 | Option Exercise | 4.53 | 53,757 | 243,692 | 103,173 | Mar 18 06:05 PM |
|
|
| |
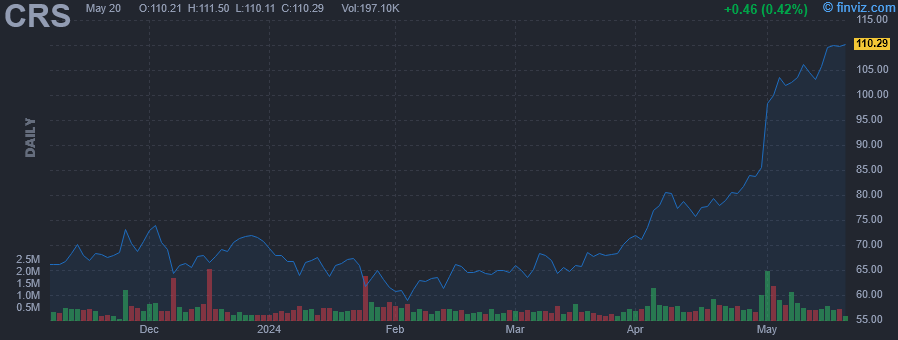 |
| Market Cap | 4.86B | EPS (ttm) | 2.88 |
| P/E | 34.17 | EPS this Y | 253.73% |
| Forward P/E | 19.53 | EPS next Y | 24.86% |
| PEG | 1.49 | EPS past 5Y | -21.93% |
| P/S | 1.78 | EPS next 5Y | 22.87% |
| P/B | 3.30 | EPS Q/Q | 581.61% |
| Dividend | 0.81% | Sales Q/Q | 7.79% |
| Insider Own | 3.03% | Inst Own | 92.04% |
| Insider Trans | -0.25% | Inst Trans | -3.42% |
| Short Float | 3.02% | Earnings | May 01/b |
| Analyst Recom | 1.40 | Target Price | 91.00 |
| Avg Volume | 485.89K | 52W Range | 44.40 - 86.79 |
|
|
|
|
Carpenter Technology Corp. engages in the manufacturing, fabrication, and distribution of specialty metals. It operates through the Specialty Alloys Operations and Performance Engineered Products segments. The Specialty Alloys Operations segment is composed of its major premium alloy and stainless-steel manufacturing operations. The Performance Engineered Products segment includes the Dynamet titanium, Carpenter Additive, and the Latrobe and Mexico distribution businesses. The company was founded by James Carpenter in 1889 and is headquartered in Philadelphia, PA. |
| Insider Trading |
Relationship |
Date |
Transaction |
Cost |
#Shares |
Value ($) |
#Shares Total |
SEC Form 4 |
| MCLANE CHARLES DOUGLAS JR | Director | Nov 07 '23 | Sale | 66.42 | 3,791 | 251,798 | 6,459 | Nov 08 04:48 PM | | MCLANE CHARLES DOUGLAS JR | Director | Nov 06 '23 | Option Exercise | 23.44 | 15,734 | 368,798 | 15,734 | Nov 08 04:48 PM | | WARD JR STEPHEN M | Director | Oct 15 '23 | Option Exercise | 59.32 | 1,227 | 72,786 | 22,755 | Oct 17 04:12 PM | | INGLIS I MARTIN | Director | Oct 15 '23 | Option Exercise | 59.32 | 1,227 | 72,786 | 4,827 | Oct 17 04:09 PM | | KAROL STEVEN E | Director | Sep 20 '23 | Option Exercise | 59.32 | 1,227 | 72,786 | 181,227 | Sep 21 04:45 PM |
|
|
|
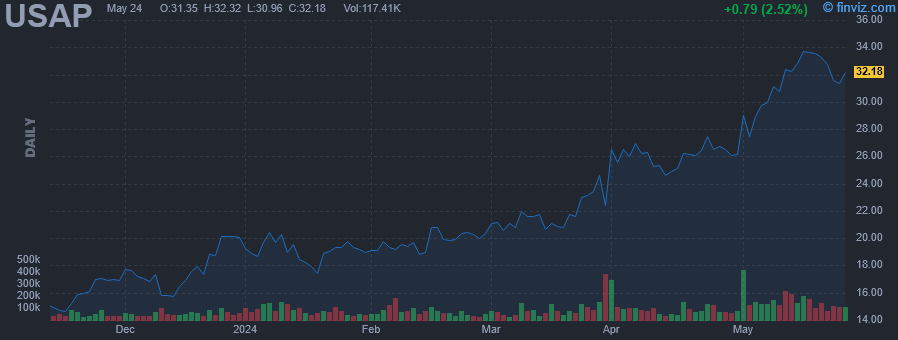 |
| Market Cap | 267.06M | EPS (ttm) | 0.52 |
| P/E | 55.92 | EPS this Y | 245.28% |
| Forward P/E | 11.96 | EPS next Y | 32.79% |
| PEG | 17.75 | EPS past 5Y | -16.16% |
| P/S | 0.93 | EPS next 5Y | 3.15% |
| P/B | 1.18 | EPS Q/Q | 166.33% |
| Dividend | - | Sales Q/Q | 41.96% |
| Insider Own | 8.88% | Inst Own | 62.79% |
| Insider Trans | 0.00% | Inst Trans | -1.29% |
| Short Float | 1.24% | Earnings | May 01/b |
| Analyst Recom | 1.00 | Target Price | 30.00 |
| Avg Volume | 94.30K | 52W Range | 9.11 - 27.60 |
|
|
|
|
Universal Stainless & Alloy Products, Inc. engages in the manufacture and marketing of semi-finished and finished specialty steels, including stainless steel, nickel alloys, tool steel, and certain other premium alloyed steels. Its products are sold to service centers, forgers, rerollers and original equipment manufacturers in the aerospace, power generation, oil and gas, heavy equipment and general industrial markets. The company was founded in 1994 and is headquartered in Bridgeville, PA. |
| Insider Trading |
Relationship |
Date |
Transaction |
Cost |
#Shares |
Value ($) |
#Shares Total |
SEC Form 4 |
| Bacchus Judith L | Director | May 03 '23 | Buy | 8.39 | 536 | 4,497 | 19,643 | May 05 10:37 AM | | Kornblatt M. David | Director | May 03 '23 | Buy | 8.39 | 500 | 4,195 | 40,776 | May 05 10:28 AM | | AYERS CHRISTOPHER L | Director | May 03 '23 | Buy | 8.39 | 500 | 4,195 | 38,776 | May 05 10:24 AM | | TOLEDANO UDI | Director | May 03 '23 | Buy | 8.39 | 500 | 4,195 | 84,076 | May 05 10:31 AM |
|
|
| |
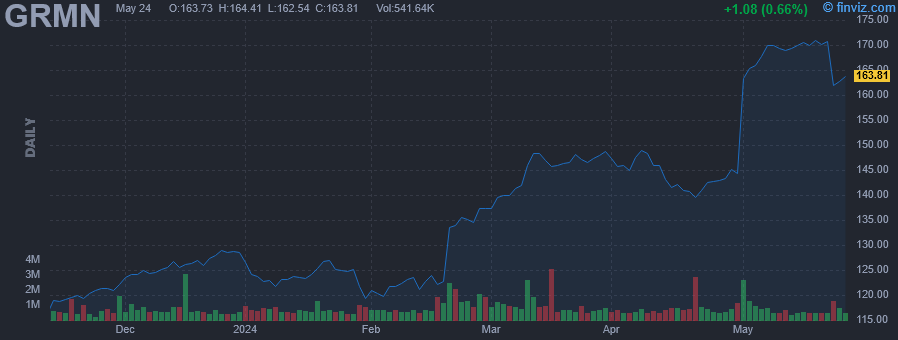 |
| Market Cap | 31.39B | EPS (ttm) | 6.71 |
| P/E | 24.34 | EPS this Y | -1.14% |
| Forward P/E | 26.60 | EPS next Y | 11.16% |
| PEG | 4.35 | EPS past 5Y | 12.90% |
| P/S | 6.00 | EPS next 5Y | 5.60% |
| P/B | 4.47 | EPS Q/Q | 84.42% |
| Dividend | 1.84% | Sales Q/Q | 13.48% |
| Insider Own | 19.63% | Inst Own | 54.89% |
| Insider Trans | -0.46% | Inst Trans | 0.87% |
| Short Float | 1.86% | Earnings | May 01/b |
| Analyst Recom | 3.00 | Target Price | 149.51 |
| Avg Volume | 999.25K | 52W Range | 95.79 - 149.54 |
|
|
|
|
Garmin Ltd. is a holding company, which engages in the provision of navigation, communications and information devices, most of which are enabled by Global Positioning System (GPS) technology. It operates through the following segments: Marine, Outdoor, Fitness, Auto OEM, Consumer Auto, and Aviation. The Marine segment manufactures and offers recreational marine electronics such as cartography, Sounders, Radar, Autopilot Systems and Sailing. The Outdoor segment offers products designed for use in outdoor activities such as Outdoor Handhelds, Adventure Watches, Golf Devices, Dog Tracking & Training Device, Garmin Connect & Garmin Connect Mobile, and Connect IQ. The Fitness segment refers to the products designed for use in fitness and activity tracking such as Running & Multi-Sport Watches, Cycling Computers, Power Meters, Safety & Awareness, and Activity Tracking Devices. The Auto OEM and Consumer Auto segments offer products designed for use in the auto market such as Personal Navigation Devices, Original Equipment Manufacturer (OEM) Solutions, and Cameras. The Aviation segment provides solutions to aircraft manufacturers, existing aircraft owners and operators, as well as government/defense customers. The company was founded in 1989 and is headquartered in Schaffhausen, Switzerland. |
| Insider Trading |
Relationship |
Date |
Transaction |
Cost |
#Shares |
Value ($) |
#Shares Total |
SEC Form 4 |
| BURRELL JONATHAN | Director | Mar 15 '24 | Sale | 146.15 | 15,000 | 2,192,282 | 623,834 | Mar 15 06:13 PM | | BURRELL JONATHAN | Director | Mar 14 '24 | Sale | 147.49 | 15,000 | 2,212,284 | 638,834 | Mar 15 06:13 PM | | BURRELL JONATHAN | Director | Mar 13 '24 | Sale | 148.89 | 15,000 | 2,233,340 | 653,834 | Mar 15 06:13 PM | | BURRELL JONATHAN | Director | Mar 12 '24 | Sale | 146.12 | 15,000 | 2,191,785 | 668,834 | Mar 13 11:45 AM | | BURRELL JONATHAN | Director | Mar 11 '24 | Sale | 142.12 | 15,000 | 2,131,802 | 683,834 | Mar 13 11:45 AM |
|
|
|
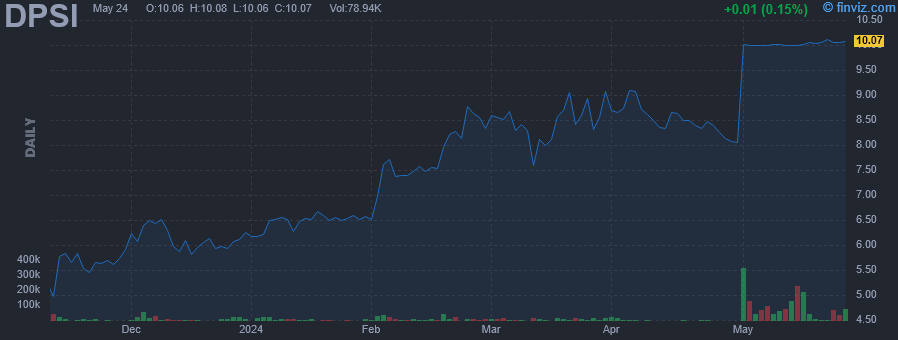 |
| Market Cap | 76.95M | EPS (ttm) | 0.32 |
| P/E | 31.68 | EPS this Y | - |
| Forward P/E | - | EPS next Y | - |
| PEG | - | EPS past 5Y | -14.33% |
| P/S | 0.67 | EPS next 5Y | - |
| P/B | 3.94 | EPS Q/Q | -160.59% |
| Dividend | - | Sales Q/Q | 24.63% |
| Insider Own | 29.87% | Inst Own | 4.98% |
| Insider Trans | 0.00% | Inst Trans | 14.56% |
| Short Float | 0.08% | Earnings | Apr 01/b |
| Analyst Recom | 1.00 | Target Price | 10.50 |
| Avg Volume | 10.84K | 52W Range | 4.04 - 9.26 |
|
|
|
|
DecisionPoint Systems, Inc. operates as an integrator of mobility and wireless systems for business organizations. The company was founded on July 5, 1985 and is headquartered in Delray Beach, FL. |
| Insider Trading |
Relationship |
Date |
Transaction |
Cost |
#Shares |
Value ($) |
#Shares Total |
SEC Form 4 |
| Smith Steven F | Chief Executive Officer | Aug 30 '23 | Option Exercise | 3.26 | 31,250 | 101,875 | 623,928 | Sep 01 03:24 PM | | Guttilla John C | Director | Aug 18 '23 | Buy | 5.35 | 10,000 | 53,500 | 42,188 | Aug 22 02:38 PM |
|
|
|
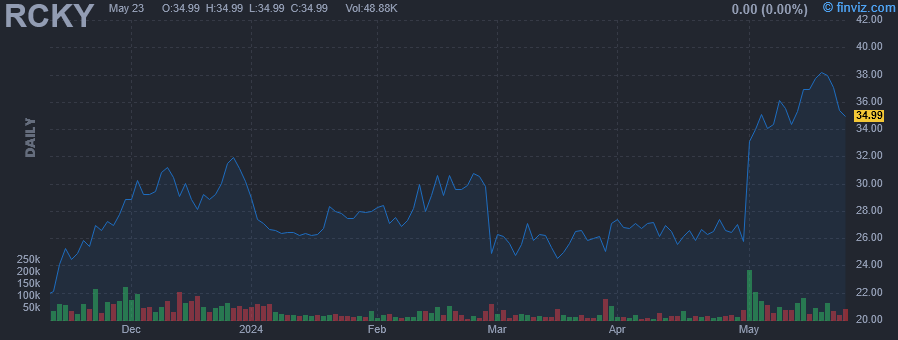 |
| Market Cap | 245.53M | EPS (ttm) | 1.41 |
| P/E | 23.49 | EPS this Y | 48.45% |
| Forward P/E | 9.18 | EPS next Y | 25.83% |
| PEG | 2.35 | EPS past 5Y | -6.25% |
| P/S | 0.53 | EPS next 5Y | 10.00% |
| P/B | 1.10 | EPS Q/Q | 2.19% |
| Dividend | 1.87% | Sales Q/Q | -9.34% |
| Insider Own | 7.41% | Inst Own | 75.54% |
| Insider Trans | -3.34% | Inst Trans | -0.73% |
| Short Float | 4.02% | Earnings | Apr 30/a |
| Analyst Recom | 3.00 | Target Price | 32.00 |
| Avg Volume | 26.47K | 52W Range | 11.77 - 32.38 |
|
|
|
|
Rocky Brands, Inc. engages in the design, manufacture, and marketing of footwear and apparel. Its brands include Rocky, Georgia Boot, Durango, Lehigh, and Michelin. It operates through the following segments: Wholesale, Retail, and Contract Manufacturing. The Wholesale segment distributes products through retail stores. The Retail segment includes direct sales of products to consumers through e-commerce websites, third party marketplaces, and Rocky outlet stores. The Contract Manufacturing segment focuses on wholesale, retail business and footwear contracts with the U.S. military. The company was founded in 1932 and is headquartered in Nelsonville, OH. |
| Insider Trading |
Relationship |
Date |
Transaction |
Cost |
#Shares |
Value ($) |
#Shares Total |
SEC Form 4 |
| BROOKS MIKE | Director | Dec 13 '23 | Sale | 29.27 | 4,000 | 117,080 | 224,170 | Dec 14 03:13 PM | | BROOKS MIKE | Director | Dec 12 '23 | Option Exercise | 26.00 | 4,000 | 104,000 | 228,170 | Dec 14 03:13 PM | | Moore Robert Burton Jr. | Director | Dec 11 '23 | Option Exercise | 26.00 | 4,000 | 104,000 | 32,258 | Dec 12 04:05 PM | | LOVELAND CURTIS A | Assistant Secretary | Dec 11 '23 | Option Exercise | 26.00 | 4,000 | 104,000 | 102,039 | Dec 13 05:20 PM | | Moore Robert Burton Jr. | Director | Dec 11 '23 | Sale | 31.11 | 4,000 | 124,459 | 28,258 | Dec 12 04:05 PM |
|
|
|
