 |
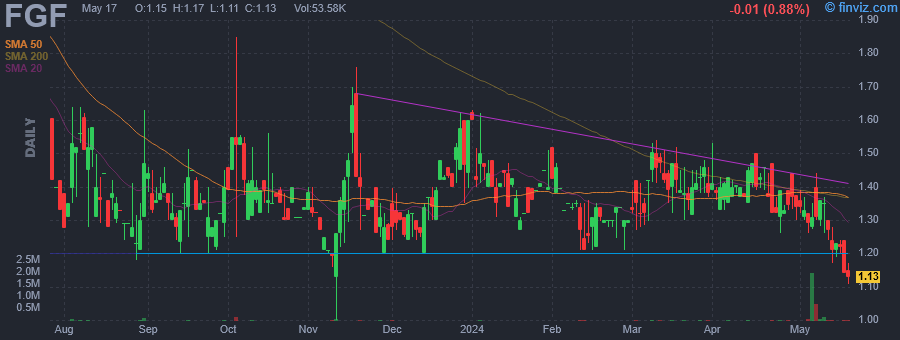
| Market Cap | 40.85M | EPS (ttm) | 0.22 |
| P/E | 6.60 | EPS this Y | - |
| Forward P/E | - | EPS next Y | - |
| PEG | - | EPS past 5Y | - |
| P/S | 2.14 | EPS next 5Y | - |
| P/B | 0.73 | EPS Q/Q | -52.15% |
| Dividend | - | Sales Q/Q | 69.79% |
| Insider Own | 10.15% | Inst Own | 29.55% |
| Insider Trans | 0.00% | Inst Trans | 0.19% |
| Short Float | 0.04% | Earnings | Mar 14/a |
| Analyst Recom | 1.00 | Target Price | 7.00 |
| Avg Volume | 47.17K | 52W Range | 1.00 - 2.39 |
|
|
|
|
Fundamental Global, Inc. engages in the provision of reinsurance, asset management and merchant banking services. The company was founded in October 2012 and is headquartered in Mooresville, NC. |
| Insider Trading |
Relationship |
Date |
Transaction |
Cost |
#Shares |
Value ($) |
#Shares Total |
SEC Form 4 |
| Fundamental Global GP, LLC | 10% Owner | Jun 13 '23 | Buy | 1.85 | 26,407 | 48,853 | 5,666,111 | Jun 14 07:13 PM | | Fundamental Global GP, LLC | 10% Owner | Jun 12 '23 | Buy | 1.85 | 20,593 | 38,097 | 5,639,704 | Jun 14 07:13 PM |
|
|
 |
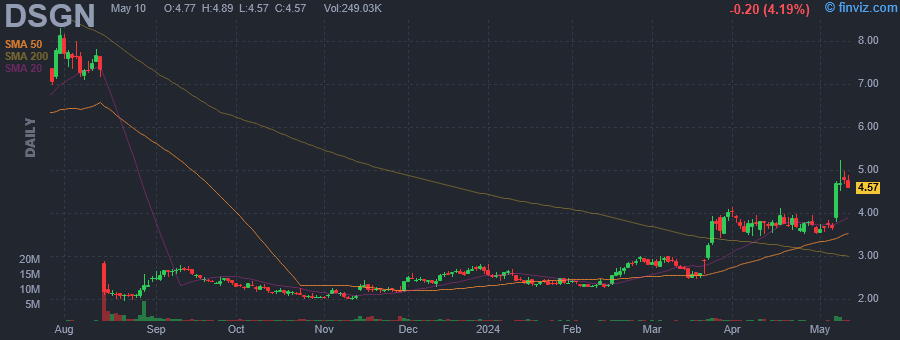 |
| Market Cap | 226.52M | EPS (ttm) | -1.19 |
| P/E | - | EPS this Y | 1.96% |
| Forward P/E | - | EPS next Y | -20.29% |
| PEG | - | EPS past 5Y | -138.68% |
| P/S | - | EPS next 5Y | - |
| P/B | 0.82 | EPS Q/Q | 32.06% |
| Dividend | - | Sales Q/Q | - |
| Insider Own | 41.56% | Inst Own | 44.89% |
| Insider Trans | 0.12% | Inst Trans | 3.11% |
| Short Float | 7.24% | Earnings | Mar 19/a |
| Analyst Recom | 2.33 | Target Price | 6.67 |
| Avg Volume | 263.46K | 52W Range | 1.94 - 8.47 |
|
|
| Today | Upgrade |
Piper Sandler |
Neutral → Overweight |
$6 → $12 |
|
|
|
Design Therapeutics, Inc. operates as a biotechnology company that develops therapies for serious degenerative disorders. It is created to design, develop and commercialize a novel class of small molecule therapeutic candidates (GeneTACs) designed to directly address the underlying basis of genetic disease. The company was founded by Pratik Shah and Aseem Z. Ansari on December 18, 2017 and is headquartered in Carlsbad, CA. |
| Insider Trading |
Relationship |
Date |
Transaction |
Cost |
#Shares |
Value ($) |
#Shares Total |
SEC Form 4 |
| Schmid John P. | Director | Mar 25 '24 | Buy | 3.74 | 17,809 | 66,606 | 26,965 | Mar 25 07:10 PM | | Berger Heather A. | Director | Mar 25 '24 | Buy | 3.74 | 1,300 | 4,866 | 1,300 | Mar 25 07:09 PM | | Schmid John P. | Director | Mar 22 '24 | Buy | 3.62 | 9,156 | 33,133 | 9,156 | Mar 25 07:10 PM | | LAPPE RODNEY W | Director | Sep 29 '23 | Buy | 2.35 | 21,000 | 49,287 | 133,024 | Oct 02 06:01 PM | | William Arsani | Director | Aug 29 '23 | Buy | 2.44 | 1,960,000 | 4,782,400 | 3,000,000 | Aug 30 06:02 PM |
|
|
|
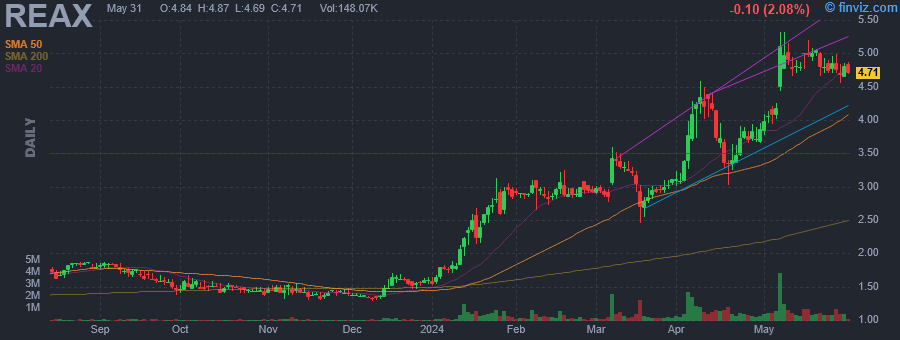 |
| Market Cap | 825.30M | EPS (ttm) | -0.15 |
| P/E | - | EPS this Y | 20.00% |
| Forward P/E | - | EPS next Y | 16.67% |
| PEG | - | EPS past 5Y | -60.94% |
| P/S | 1.20 | EPS next 5Y | - |
| P/B | 22.83 | EPS Q/Q | -73.23% |
| Dividend | - | Sales Q/Q | 88.66% |
| Insider Own | 56.19% | Inst Own | 1.41% |
| Insider Trans | 0.00% | Inst Trans | - |
| Short Float | 0.69% | Earnings | May 07/b |
| Analyst Recom | 1.00 | Target Price | 4.25 |
| Avg Volume | 592.74K | 52W Range | 1.09 - 4.58 |
|
|
|
|
The Real Brokerage, Inc. engages in the provision of real estate brokerage services through mobile application. The company was founded by Tamir Poleg, Yuval Niv and Gal Weiss on June 26, 2014 and is headquartered in Toronto, Canada. |
|
| |
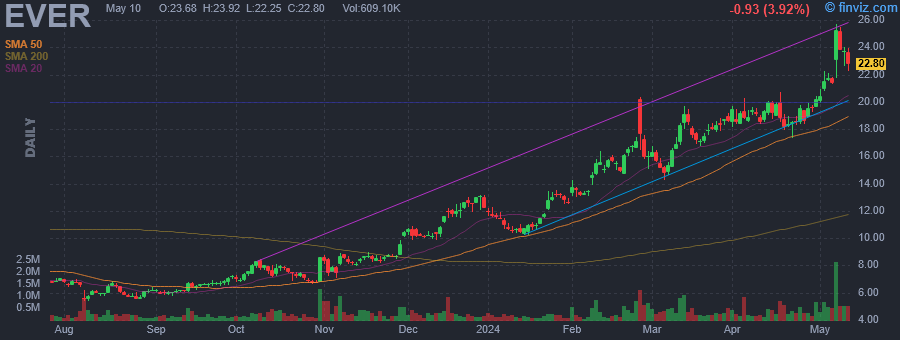 |
| Market Cap | 812.68M | EPS (ttm) | -1.53 |
| P/E | - | EPS this Y | 91.40% |
| Forward P/E | - | EPS next Y | 98.11% |
| PEG | - | EPS past 5Y | 12.66% |
| P/S | 2.82 | EPS next 5Y | -11.40% |
| P/B | 9.89 | EPS Q/Q | 28.73% |
| Dividend | - | Sales Q/Q | -36.92% |
| Insider Own | 31.63% | Inst Own | 59.95% |
| Insider Trans | -12.88% | Inst Trans | -0.84% |
| Short Float | 4.96% | Earnings | May 06/a |
| Analyst Recom | 1.67 | Target Price | 27.12 |
| Avg Volume | 450.99K | 52W Range | 5.36 - 22.27 |
|
|
|
|
EverQuote, Inc. operates as an online insurance marketplace connecting consumers with insurance providers. It offers car, home and life insurance. The firm's data and technology platform matches and connects consumers seeking to purchase insurance with relevant options from its broad direct network of insurance providers. The company was founded by Seth N. Birnbaum, David B. Blundin, and Tomas Revesz in August 1, 2008 and is headquartered in Cambridge, MA. |
| Insider Trading |
Relationship |
Date |
Transaction |
Cost |
#Shares |
Value ($) |
#Shares Total |
SEC Form 4 |
| BLUNDIN DAVID B | Director | May 03 '24 | Sale | 21.90 | 51,934 | 1,137,355 | 529,055 | May 06 04:05 PM | | BLUNDIN DAVID B | Director | May 03 '24 | Sale | 21.90 | 41,789 | 915,179 | 469,907 | May 06 04:05 PM | | LINK VENTURES, LLLP | 10% Owner | May 03 '24 | Sale | 21.90 | 4,884 | 106,960 | 1,548,546 | May 06 04:05 PM | | BLUNDIN DAVID B | Director | May 02 '24 | Sale | 21.88 | 29,034 | 635,264 | 576,105 | May 06 04:05 PM | | BLUNDIN DAVID B | Director | May 02 '24 | Sale | 21.88 | 23,362 | 511,161 | 511,696 | May 06 04:05 PM |
|
|
|
 |
| Market Cap | 395.37M | EPS (ttm) | -2.11 |
| P/E | - | EPS this Y | 80.93% |
| Forward P/E | 45.96 | EPS next Y | 113.04% |
| PEG | - | EPS past 5Y | 23.09% |
| P/S | 3.40 | EPS next 5Y | 16.90% |
| P/B | - | EPS Q/Q | 33.60% |
| Dividend | - | Sales Q/Q | 71.38% |
| Insider Own | 1.10% | Inst Own | 47.89% |
| Insider Trans | 0.00% | Inst Trans | 5.01% |
| Short Float | 11.04% | Earnings | May 07/b |
| Analyst Recom | 1.75 | Target Price | 7.41 |
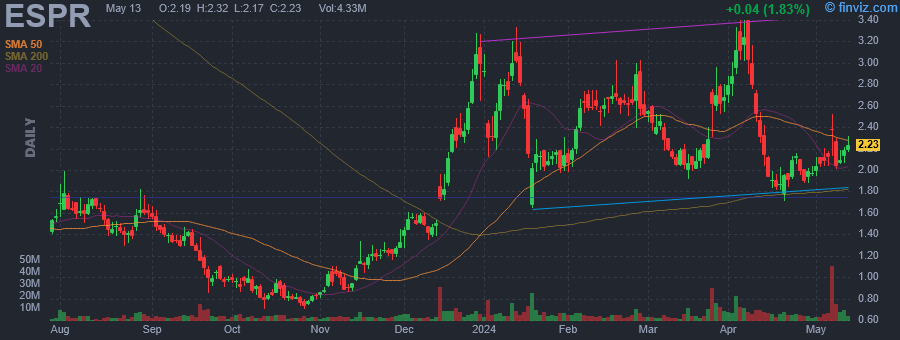
| Avg Volume | 6.08M | 52W Range | 0.70 - 3.40 |
|
|
|
|
Esperion Therapeutics, Inc. is a pharmaceutical company, which engages in the development and commercialization of oral therapies for elevated low-density lipoprotein cholesterol. The firm offers NEXLETOL (bempedoic acid) tablets, and NEXLIZET (bempedoic acid and ezetimibe) tablets. The company was founded by Roger S. Newton, Hans Ageland, Jan O. Johansson, Anders Paul Wiklund, Michael E. Pape, David I. Scheer and Charles L. Bisgaier in May 1998 and is headquartered in Ann Arbor, MI. |
| Insider Trading |
Relationship |
Date |
Transaction |
Cost |
#Shares |
Value ($) |
#Shares Total |
SEC Form 4 |
| Warren Eric | Chief Commercial Officer | Sep 20 '23 | Sale | 1.25 | 742 | 924 | 68,318 | Sep 21 05:06 PM | | Warren Eric | Chief Commercial Officer | Aug 18 '23 | Sale | 1.41 | 243 | 344 | 69,060 | Aug 21 04:32 PM | | Warren Eric | Chief Commercial Officer | Jul 19 '23 | Sale | 1.58 | 106 | 168 | 69,303 | Jul 20 04:38 PM | | Warren Eric | Chief Commercial Officer | Jun 21 '23 | Sale | 1.48 | 603 | 894 | 69,409 | Jun 22 04:45 PM | | Warren Eric | Chief Commercial Officer | May 17 '23 | Sale | 1.62 | 219 | 356 | 70,012 | May 18 04:07 PM |
|
|
| |
 |
| Market Cap | 308.17M | EPS (ttm) | 0.04 |
| P/E | 121.17 | EPS this Y | -250.00% |
| Forward P/E | - | EPS next Y | -450.00% |
| PEG | 3.36 | EPS past 5Y | -37.98% |
| P/S | 1.60 | EPS next 5Y | 36.10% |
| P/B | 0.56 | EPS Q/Q | -134.75% |
| Dividend | - | Sales Q/Q | -29.79% |
| Insider Own | 5.26% | Inst Own | 86.02% |
| Insider Trans | -3.81% | Inst Trans | -1.95% |
| Short Float | 3.75% | Earnings | May 08/a |
| Analyst Recom | 2.00 | Target Price | 5.21 |
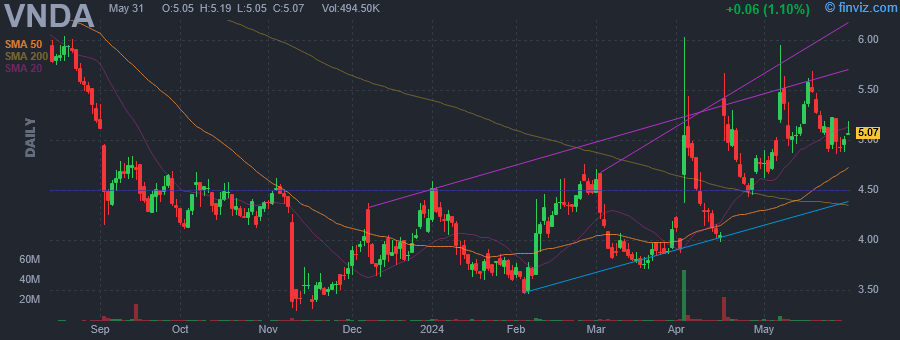
| Avg Volume | 2.37M | 52W Range | 3.30 - 6.98 |
|
|
|
|
Vanda Pharmaceuticals, Inc. engages in the development and commercialization of therapies for high unmet medical needs. The firm intends to treat schizophrenia, jet lag disorder, atopic dermatitis, central nervous system disorders, and circadian rhythm sleep disorder. Its product portfolio includes HETLIOZ, Fanapt, Tradipitant, Trichostatin, and AQW051. The company was founded by Mihael Hristos Polymeropoulos and Argeris N. Karabelas in 2002 and is headquartered in Washington, DC. |
| Insider Trading |
Relationship |
Date |
Transaction |
Cost |
#Shares |
Value ($) |
#Shares Total |
SEC Form 4 |
| Polymeropoulos Mihael Hristos | President and CEO | Mar 05 '24 | Sale | 4.13 | 24,288 | 100,273 | 1,871,730 | Mar 06 04:47 PM | | Wijkstrom Joakim | SVP, Chief Marketing Officer | Mar 05 '24 | Sale | 4.21 | 9,229 | 38,830 | 129,789 | Mar 06 04:48 PM | | Moran Kevin Patrick | SVP, CFO & Treasurer | Mar 05 '24 | Sale | 4.20 | 8,902 | 37,411 | 231,014 | Mar 06 04:46 PM | | Williams Timothy | SVP & General Counsel | Mar 05 '24 | Sale | 4.18 | 8,941 | 37,396 | 196,825 | Mar 06 04:50 PM | | Birznieks Gunther | SVP, Business Development | Mar 05 '24 | Sale | 4.13 | 8,684 | 35,884 | 313,569 | Mar 06 04:46 PM |
|
|
|
 |
| Market Cap | 2.10B | EPS (ttm) | -0.69 |
| P/E | - | EPS this Y | 157.87% |
| Forward P/E | 15.04 | EPS next Y | 116.36% |
| PEG | - | EPS past 5Y | - |
| P/S | 1.21 | EPS next 5Y | 20.00% |
| P/B | 2.50 | EPS Q/Q | -113.97% |
| Dividend | - | Sales Q/Q | -21.47% |
| Insider Own | 2.96% | Inst Own | 91.92% |
| Insider Trans | -1.80% | Inst Trans | 1.00% |
| Short Float | 1.87% | Earnings | May 06/a |
| Analyst Recom | 1.00 | Target Price | 49.67 |
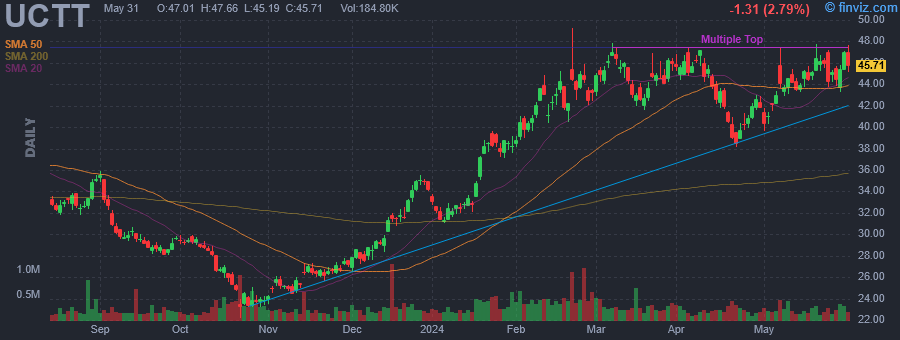
| Avg Volume | 310.77K | 52W Range | 22.15 - 49.25 |
|
|
| Today | Reiterated |
TD Cowen |
Buy |
$47 → $55 |
|
|
|
Ultra Clean Holdings, Inc. engages in the development and supplying of critical subsystems, components and parts, and ultra-high purity cleaning and analytical services for the semiconductor industry. It operates through the Products and Services segments. The Products segment is involved in the design and manufacture of production tools, components, parts, and modules, and subsystems for the semiconductor and display capital equipment industry. The Services segment provides purity parts cleaning, process tool part recoating, surface encapsulation, and high sensitivity micro contamination analysis for the semiconductor device makers and wafer fabrication equipment. The company was founded in November 2002 and is headquartered in Hayward, CA. |
| Insider Trading |
Relationship |
Date |
Transaction |
Cost |
#Shares |
Value ($) |
#Shares Total |
SEC Form 4 |
| Cho Paul Yoonku | General Counsel and Secretary | Dec 04 '23 | Sale | 28.38 | 4,689 | 133,074 | 15,147 | Dec 06 06:13 PM | | McKibben Jeffrey L. | Chief Information Officer | Nov 20 '23 | Sale | 26.71 | 4,200 | 112,168 | 22,408 | Nov 21 07:06 PM | | McKibben Jeffrey L. | Chief Information Officer | Nov 17 '23 | Sale | 26.26 | 3,720 | 97,687 | 26,608 | Nov 21 07:06 PM | | Cook Christopher S | President, Products Division | Nov 14 '23 | Sale | 26.68 | 4,662 | 124,382 | 32,915 | Apr 15 07:25 PM | | Palfrey Jamie J. | SVP, Global Human Resources | Nov 03 '23 | Sale | 25.68 | 6,932 | 178,013 | 20,970 | Nov 07 06:58 PM |
|
|
| |
 |
| Market Cap | 796.18M | EPS (ttm) | 0.12 |
| P/E | 49.92 | EPS this Y | -34.23% |
| Forward P/E | 14.96 | EPS next Y | 21.24% |
| PEG | 7.52 | EPS past 5Y | - |
| P/S | 1.12 | EPS next 5Y | 6.64% |
| P/B | 7.62 | EPS Q/Q | -234.43% |
| Dividend | - | Sales Q/Q | 20.19% |
| Insider Own | 45.19% | Inst Own | 41.42% |
| Insider Trans | -28.19% | Inst Trans | -6.16% |
| Short Float | 13.22% | Earnings | May 07/b |
| Analyst Recom | 1.69 | Target Price | 9.67 |
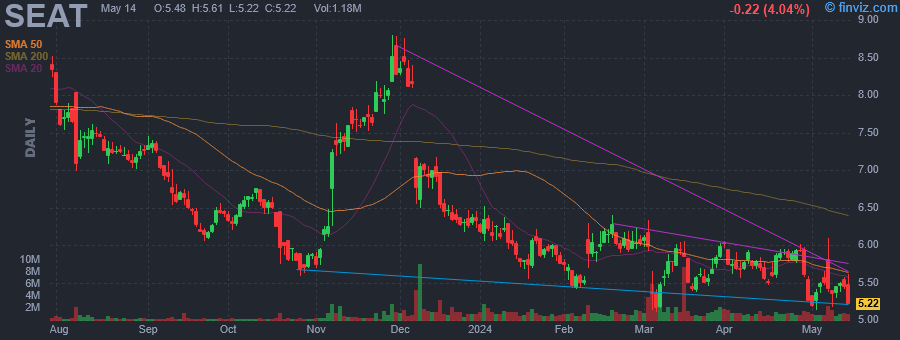
| Avg Volume | 1.62M | 52W Range | 5.11 - 9.89 |
|
|
|
|
Vivid Seats, Inc. operates as an online ticket marketplace, which engages in the provision of different selections of events and tickets in North America. It operates through the following segments: Marketplace and Resale. The Marketplace segment acts as an intermediary between event ticket buyers and ticket sellers. The Resale segment acquires tickets to resell on secondary ticket marketplaces, including its own. Its partners include Caesars Entertainment, RollingStone, Marriott Bonvoy, Capital One, American Airlines and others. The company was founded in 2001 and is headquartered in Chicago, IL. |
| Insider Trading |
Relationship |
Date |
Transaction |
Cost |
#Shares |
Value ($) |
#Shares Total |
SEC Form 4 |
| Bakal Riva | Chief Strategy Officer | Apr 22 '24 | Sale | 5.90 | 1,136 | 6,702 | 97,670 | Apr 23 05:59 PM | | Pickus Edward | Chief Accounting Officer | Apr 22 '24 | Sale | 5.90 | 537 | 3,168 | 35,434 | Apr 23 05:58 PM | | Wagner Jonathan Miles | Chief Technology Officer | Mar 12 '24 | Sale | 5.71 | 29,588 | 168,947 | 139,925 | Mar 13 04:26 PM | | Bakal Riva | Chief Strategy Officer | Mar 12 '24 | Sale | 5.71 | 2,051 | 11,711 | 94,955 | Mar 13 04:20 PM | | Pickus Edward | Chief Accounting Officer | Mar 12 '24 | Sale | 5.71 | 725 | 4,140 | 34,154 | Mar 13 04:24 PM |
|
|
|
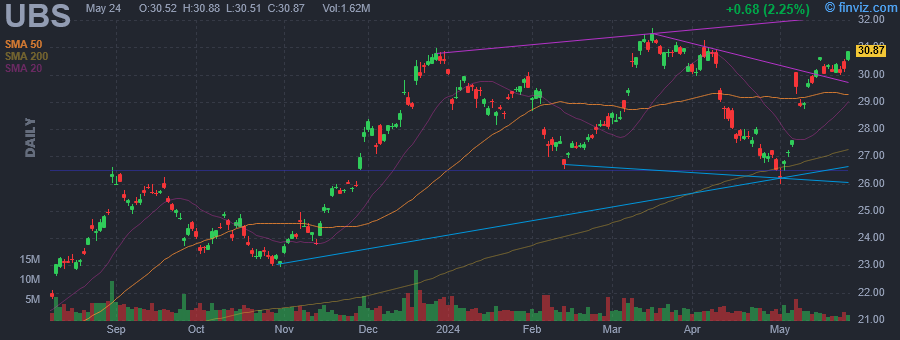 |
| Market Cap | 96.20B | EPS (ttm) | 8.63 |
| P/E | 3.47 | EPS this Y | 201.54% |
| Forward P/E | 14.52 | EPS next Y | 98.07% |
| PEG | 0.34 | EPS past 5Y | 48.81% |
| P/S | 1.35 | EPS next 5Y | 10.12% |
| P/B | 1.12 | EPS Q/Q | -185.00% |
| Dividend | 2.66% | Sales Q/Q | 121.68% |
| Insider Own | 12.14% | Inst Own | 49.99% |
| Insider Trans | 0.00% | Inst Trans | - |
| Short Float | 0.43% | Earnings | May 07/b |
| Analyst Recom | 2.40 | Target Price | 30.50 |
| Avg Volume | 2.87M | 52W Range | 18.52 - 31.71 |
|
|
|
|
UBS Group AG is a holding company, which engages in the provision of financial management solutions. It operates through the following segments: Global Wealth Management, Personal and Corporate Banking, Asset Management, Investment Bank, Non-Core and Legacy, and Group Items. The Global Wealth Management segment involves the provision of advice and solutions and offers investment management, estate planning and corporate finance, banking products and services. The Personal and Corporate segment focuses on offering retirement, financing, investments and strategic transactions through its branch network and digital channels. The Asset Management segment consists of capabilities and styles, and advisory support. The Investment Bank segment includes research, advisory services, facilitating clients raising debt and equity from the public, private, and capital markets, cash and derivatives trading. The Non-Core and Legacy segment refers to assets and liabilities prior to the acquisition. The Group Items segment consists of Technology, Corporate Services, Human Resources, Finance, Legal, Risk Control, Compliance, Regulatory and Governance, Communications and Branding, Group Sustainability and Impact, Chief Strategy Office, and Group Treasury. The company was founded on June 29, 1998 and is headquartered in Zurich, Switzerland. |
| Insider Trading |
Relationship |
Date |
Transaction |
Cost |
#Shares |
Value ($) |
#Shares Total |
SEC Form 4 |
| UBS Group AG | 10% Owner | Apr 25 '24 | Buy | 6.07 | 1,005 | 6,105 | 35,077 | May 03 12:04 PM | | UBS Group AG | 10% Owner | Apr 25 '24 | Sale | 5.43 | 30,056 | 163,307 | 5,025 | May 03 12:04 PM | | UBS Group AG | 10% Owner | Apr 24 '24 | Sale | 6.30 | 106 | 668 | 34,076 | May 03 12:04 PM |
|
|
|
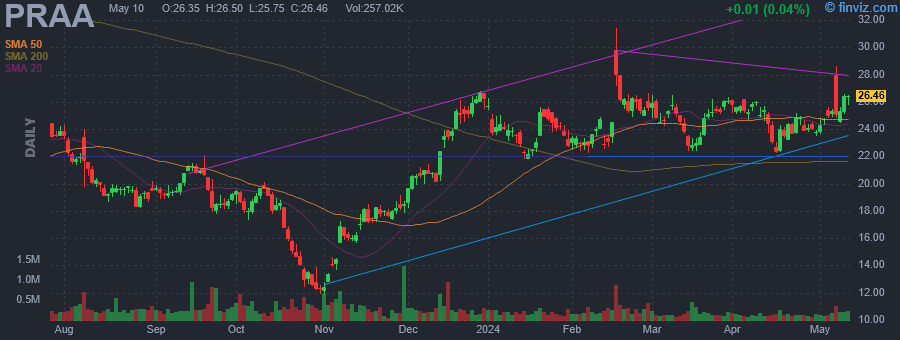 |
| Market Cap | 1.08B | EPS (ttm) | -2.14 |
| P/E | - | EPS this Y | 140.73% |
| Forward P/E | 15.56 | EPS next Y | 103.46% |
| PEG | - | EPS past 5Y | - |
| P/S | 1.33 | EPS next 5Y | 36.00% |
| P/B | 0.92 | EPS Q/Q | -154.93% |
| Dividend | - | Sales Q/Q | 0.10% |
| Insider Own | 3.92% | Inst Own | 98.13% |
| Insider Trans | -0.38% | Inst Trans | -7.58% |
| Short Float | 2.48% | Earnings | May 06/a |
| Analyst Recom | 2.00 | Target Price | 32.33 |
| Avg Volume | 209.78K | 52W Range | 11.85 - 34.89 |
|
|
|
|
PRA Group, Inc. engages in the purchase, collection and management of portfolios of nonperforming loans. The firm purchase portfolios of nonperforming loans at a discount in two broad categories: Core and Insolvency. It also provides fee-based services on class action claims recoveries and by servicing consumer bankruptcy accounts in the United States. The company was founded by Steven D. Fredrickson and Kevin P. Stevenson on March 20, 1996 and is headquartered in Norfolk, VA. |
| Insider Trading |
Relationship |
Date |
Transaction |
Cost |
#Shares |
Value ($) |
#Shares Total |
SEC Form 4 |
| Atal Vikram A | President and CEO | Apr 15 '24 | Sale | 24.39 | 5,830 | 142,194 | 155,625 | Apr 17 09:11 PM | | FREDRICKSON STEVEN D | Chairman | Aug 29 '23 | Buy | 19.31 | 26,000 | 502,060 | 139,709 | Aug 30 05:02 PM | | Connelly Marjorie Mary | Director | Jun 02 '23 | Buy | 20.20 | 7,425 | 149,985 | 29,512 | Jun 06 07:11 PM | | Atal Vikram A | President and CEO | May 18 '23 | Buy | 18.81 | 40,000 | 752,250 | 20,000 | May 19 05:54 PM | | TABAKIN SCOTT M | Director | May 17 '23 | Buy | 19.07 | 12,000 | 228,840 | 72,894 | May 19 11:33 AM |
|
|
|
