 |
| Market Cap | 968.14M | EPS (ttm) | -0.24 |
| P/E | - | EPS this Y | 100.80% |
| Forward P/E | 464.00 | EPS next Y | 733.33% |
| PEG | - | EPS past 5Y | -57.58% |
| P/S | 2.63 | EPS next 5Y | 2.00% |
| P/B | 3.28 | EPS Q/Q | 152.94% |
| Dividend | - | Sales Q/Q | 17.06% |
| Insider Own | 6.20% | Inst Own | 86.85% |
| Insider Trans | -8.15% | Inst Trans | 4.30% |
| Short Float | 7.11% | Earnings | May 06/a |
| Analyst Recom | 1.00 | Target Price | 26.75 |
| Avg Volume | 224.38K | 52W Range | 12.16 - 25.51 |
|
|
|
|
Artivion, Inc. engages in the research and development of solutions which address cardiac and vascular surgeons' clinical challenges in treating patients with aortic diseases. Its products include aortic stents and stent grafts, prosthetic heart valves, cryopreserved cardiac and vascular allografts, and surgical sealants. It operates through the Medical Devices and Preservation Services segments. The Medical Devices segment includes aortic stents and stent grafts, surgical sealants, and On-X products. The Preservation Services segment offers cardiac and vascular tissue preservation services. The company was founded on January 19, 1984, and is headquartered in Kennesaw, GA. |
| Insider Trading |
Relationship |
Date |
Transaction |
Cost |
#Shares |
Value ($) |
#Shares Total |
SEC Form 4 |
| Holloway Jean F | SVP, General Counsel | May 10 '24 | Sale | 23.42 | 1,250 | 29,275 | 167,482 | May 13 06:05 PM | | Holloway Jean F | SVP, General Counsel | May 09 '24 | Sale | 23.79 | 979 | 23,286 | 168,732 | May 10 05:12 PM | | Stanton Marshall S. | SVP, Clinical & MD Affair | Mar 20 '24 | Sale | 20.39 | 2,183 | 44,511 | 83,296 | Mar 21 05:14 PM | | GREEN ANDREW M | VP Regulatory | Mar 15 '24 | Sale | 20.00 | 1,462 | 29,240 | 41,121 | Mar 18 06:09 PM | | GREEN ANDREW M | VP Regulatory | Mar 14 '24 | Sale | 20.00 | 3,994 | 79,880 | 42,583 | Mar 15 05:20 PM |
|
|
 |
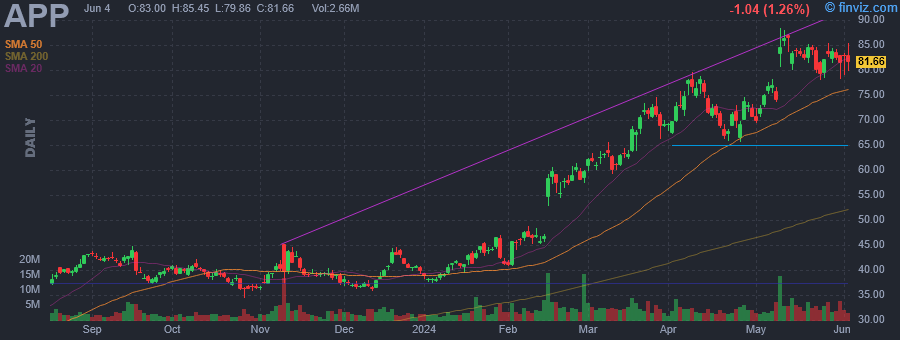 |
| Market Cap | 28.41B | EPS (ttm) | 1.69 |
| P/E | 51.17 | EPS this Y | 192.70% |
| Forward P/E | 23.77 | EPS next Y | 26.69% |
| PEG | 2.56 | EPS past 5Y | 46.35% |
| P/S | 7.84 | EPS next 5Y | 20.00% |
| P/B | 37.37 | EPS Q/Q | 5666.12% |
| Dividend | - | Sales Q/Q | 47.90% |
| Insider Own | 48.90% | Inst Own | 45.76% |
| Insider Trans | -20.68% | Inst Trans | -1.00% |
| Short Float | 11.71% | Earnings | May 08/a |
| Analyst Recom | 1.91 | Target Price | 88.06 |
| Avg Volume | 4.66M | 52W Range | 20.90 - 88.50 |
|
|
|
Today 06:20AM
|
AppLovin Shares Soar as Artificial Intelligence (AI) Drives Huge Revenue Surge. Up Nearly 400% in the Past Year, Is It Too Late to Buy the Stock?
(Motley Fool) |
|
03:33AM
|
AppLovin Insider Sold Shares Worth $12,177,316, According to a Recent SEC Filing
(MT Newswires) |
|
May-13-24 12:20PM
|
Why AppLovin (APP) Might be Well Poised for a Surge
(Zacks) |
|
09:40AM
|
Is AppLovin (APP) Stock Outpacing Its Business Services Peers This Year?
(Zacks) |
|
09:30AM
|
Wall Street Analysts See AppLovin (APP) as a Buy: Should You Invest?
(Zacks) |
|
May-10-24 10:46AM
|
UBS Ups Price Target on AppLovin to $100 From $55, Keeps Neutral Rating
(MT Newswires) |
|
May-09-24 04:26PM
|
These Stocks Moved Most Today: Roblox, Duolingo, AppLovin, Exact Sciences, AMC, and More
(Barrons.com) +14.45% |
|
03:18PM
|
These Stocks Are Moving the Most Today: Roblox, Duolingo, AppLovin, Exact Sciences, AMC, and More
(Barrons.com) |
|
01:51PM
|
Why AppLovin (APP) Stock Is Trading Up Today
(StockStory) |
|
12:39PM
|
Airbnb, Topgolf Callaway fall; AppLovin, Cheesecake Factory rise, Thursday, 5/9/2024
(Associated Press Finance) |
|
AppLovin Corp. engages in the development and operation of a mobile marketing platform. It offers AppDiscovery, MAX, Adjust, and SparkLabs. Its software-based platform caters to mobile application developers to improve the marketing and monetization of applications. The company was founded by Andrew Karam, John Krystynak, and Adam Foroughi in 2011 and is headquartered in Palo Alto, CA. |
| Insider Trading |
Relationship |
Date |
Transaction |
Cost |
#Shares |
Value ($) |
#Shares Total |
SEC Form 4 |
| Billings Craig Scott | Director | May 13 '24 | Sale | 84.97 | 5,620 | 477,531 | 1,780 | May 13 06:04 PM | | Jansen Katie Kihorany | Chief Marketing Officer | May 09 '24 | Sale | 82.29 | 147,984 | 12,177,316 | 0 | May 13 06:03 PM | | Valenzuela Victoria | CLO & Corp. Secretary | Apr 04 '24 | Sale | 75.01 | 50,000 | 3,750,500 | 471,560 | Apr 08 05:11 PM | | Stumpf Matthew | Chief Financial Officer (CFO) | Mar 14 '24 | Option Exercise | 5.05 | 4,686 | 23,664 | 365,039 | Mar 18 05:23 PM | | Chen Herald Y | President & CFO | Mar 14 '24 | Sale | 63.04 | 150,000 | 9,456,604 | 62,418 | Mar 18 05:23 PM |
|
|
|
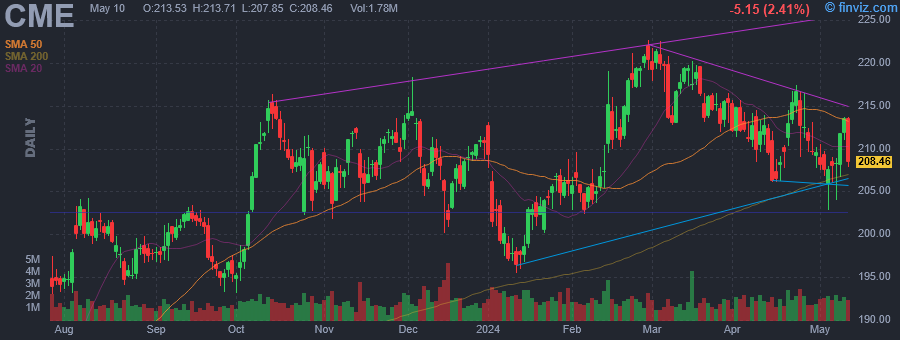 |
| Market Cap | 75.58B | EPS (ttm) | 8.78 |
| P/E | 23.91 | EPS this Y | 4.14% |
| Forward P/E | 21.13 | EPS next Y | 2.15% |
| PEG | 7.74 | EPS past 5Y | 9.19% |
| P/S | 13.44 | EPS next 5Y | 3.09% |
| P/B | 2.78 | EPS Q/Q | -3.38% |
| Dividend | 4.66% | Sales Q/Q | 3.21% |
| Insider Own | 0.34% | Inst Own | 89.88% |
| Insider Trans | -5.10% | Inst Trans | 0.50% |
| Short Float | 0.93% | Earnings | Apr 24/b |
| Analyst Recom | 2.53 | Target Price | 222.60 |
| Avg Volume | 1.71M | 52W Range | 171.43 - 222.63 |
|
|
|
|
CME Group, Inc. operates a derivatives marketplace, which offers a range of futures and options products for risk management. Its exchanges offer a range of global benchmark products across all major asset classes based on interest rates, equity indexes, foreign exchange (FX), energy, agricultural commodities and metals. It offers futures and options on futures trading across asset classes through the CME Globex platform, fixed income trading via BrokerTec and FX trading on the EBS platform. In addition, it also operates CME Clearing, a central counterparty clearing provider. The company was founded in 1898 and is headquartered in Chicago, IL. |
| Insider Trading |
Relationship |
Date |
Transaction |
Cost |
#Shares |
Value ($) |
#Shares Total |
SEC Form 4 |
| SAVAGE TERRY L | Director | May 13 '24 | Sale | 210.65 | 2,500 | 526,620 | 17,441 | May 13 06:00 PM | | Piell Hilda Harris | Sr MD & Chief HR Officer | May 08 '24 | Sale | 210.35 | 7,140 | 1,501,876 | 29,256 | May 09 01:29 PM | | DUFFY TERRENCE A | Chairman and CEO | Apr 29 '24 | Sale | 210.91 | 40,000 | 8,436,496 | 67,455 | May 01 05:06 PM | | SHEPARD WILLIAM R | Director | Mar 26 '24 | Buy | 214.71 | 282 | 60,561 | 253,343 | Mar 27 12:49 PM | | SHEPARD WILLIAM R | Director | Mar 26 '24 | Buy | 214.71 | 12 | 2,670 | 2,334 | Mar 27 12:49 PM |
|
|
| |
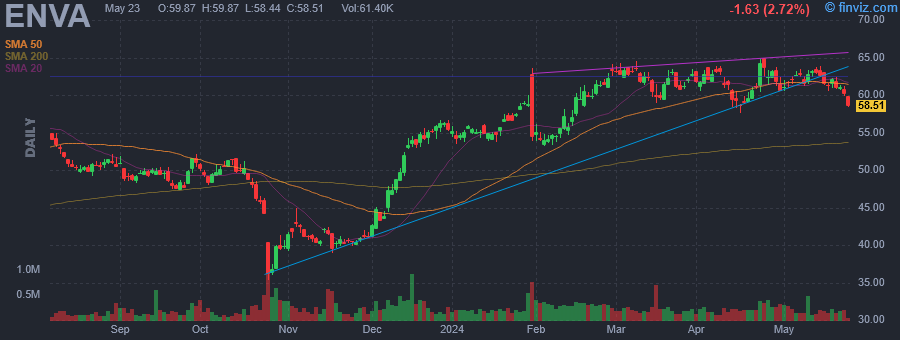 |
| Market Cap | 1.71B | EPS (ttm) | 5.56 |
| P/E | 11.32 | EPS this Y | 19.60% |
| Forward P/E | 6.42 | EPS next Y | 19.51% |
| PEG | - | EPS past 5Y | 22.45% |
| P/S | 0.76 | EPS next 5Y | - |
| P/B | 1.50 | EPS Q/Q | 5.44% |
| Dividend | - | Sales Q/Q | 26.20% |
| Insider Own | 4.49% | Inst Own | 98.46% |
| Insider Trans | -6.99% | Inst Trans | -2.09% |
| Short Float | 5.15% | Earnings | Apr 23/a |
| Analyst Recom | 1.67 | Target Price | 72.33 |
| Avg Volume | 255.42K | 52W Range | 35.30 - 65.00 |
|
|
|
|
Enova International, Inc. engages in the provision of online financial services. Its products and services include short-term consumer loan, line of credit accounts, instalment loans, receivables purchase agreements, credit services organization program, bank program, and decision management platform-as-a-service & analytics-as-a-service. It caters non-prime credit consumers and small businesses in the United States and Brazil. The company was founded by Albert Goldstein and Alexander Goldstein in 2003 and is headquartered in Chicago, IL. |
| Insider Trading |
Relationship |
Date |
Transaction |
Cost |
#Shares |
Value ($) |
#Shares Total |
SEC Form 4 |
| Fisher David | Chief Executive Officer | May 09 '24 | Option Exercise | 23.96 | 10,000 | 239,600 | 471,439 | May 13 06:00 PM | | Fisher David | Chief Executive Officer | May 09 '24 | Sale | 62.88 | 10,000 | 628,794 | 461,439 | May 13 06:00 PM | | Fisher David | Chief Executive Officer | May 07 '24 | Option Exercise | 22.70 | 20,000 | 453,934 | 473,315 | May 09 04:41 PM | | Fisher David | Chief Executive Officer | May 07 '24 | Sale | 62.72 | 20,000 | 1,254,395 | 461,439 | May 09 04:41 PM | | Cunningham Steven E | Chief Financial Officer | Apr 26 '24 | Option Exercise | 20.85 | 22,278 | 464,496 | 163,991 | Apr 30 04:05 PM |
|
|
|
 |
| Market Cap | 22.66B | EPS (ttm) | 3.42 |
| P/E | 87.71 | EPS this Y | 9.10% |
| Forward P/E | 52.43 | EPS next Y | 26.77% |
| PEG | 4.82 | EPS past 5Y | 35.57% |
| P/S | 13.48 | EPS next 5Y | 18.20% |
| P/B | 12.46 | EPS Q/Q | 182.67% |
| Dividend | - | Sales Q/Q | 34.31% |
| Insider Own | 5.43% | Inst Own | 80.07% |
| Insider Trans | -3.73% | Inst Trans | 2.57% |
| Short Float | 3.23% | Earnings | May 06/a |
| Analyst Recom | 1.38 | Target Price | 367.27 |
| Avg Volume | 532.79K | 52W Range | 175.37 - 329.87 |
|
|
|
|
Axon Enterprise, Inc. engages in the development, manufacture, and sale of conducted electrical weapons for personal defense. It operates through the TASER segment and Software and Sensors segment. The TASER segment sells conducted electrical weapons, accessories, and other related products and services. The Software and Sensors segment includes devices, wearables, applications, cloud, and mobile products. The company was founded by Patrick W. Smith and Thomas P. Smith on September 7, 1993 and is headquartered in Scottsdale, AZ. |
| Insider Trading |
Relationship |
Date |
Transaction |
Cost |
#Shares |
Value ($) |
#Shares Total |
SEC Form 4 |
| Isner Joshua | PRESIDENT | May 09 '24 | Sale | 309.96 | 44,000 | 13,638,357 | 275,843 | May 13 05:45 PM | | Kunins Jeffrey C | CPO & CTO | May 09 '24 | Sale | 309.94 | 43,668 | 13,534,282 | 189,719 | May 13 05:48 PM | | Williams Jeri | Director | May 09 '24 | Sale | 310.07 | 308 | 95,501 | 1,607 | May 13 05:51 PM | | Isner Joshua | PRESIDENT | Jan 02 '24 | Sale | 251.68 | 35,400 | 8,909,327 | 309,564 | Jan 04 04:36 PM | | Kunins Jeffrey C | CPO & CTO | Dec 19 '23 | Sale | 256.95 | 2,722 | 699,410 | 226,083 | Dec 20 06:48 PM |
|
|
| |
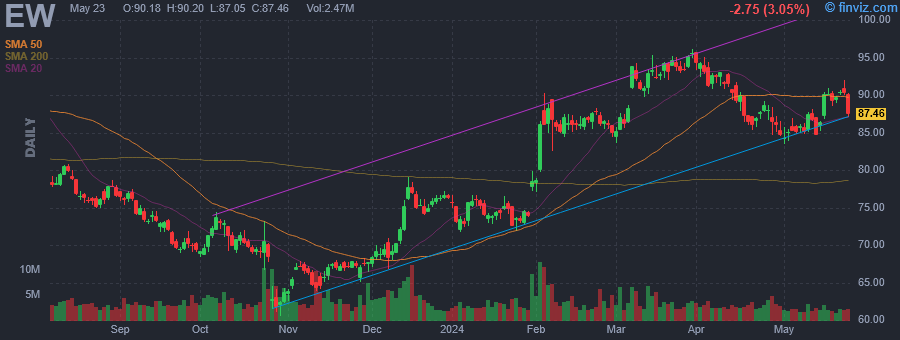 |
| Market Cap | 51.04B | EPS (ttm) | 2.33 |
| P/E | 36.40 | EPS this Y | 10.42% |
| Forward P/E | 27.19 | EPS next Y | 12.39% |
| PEG | 3.86 | EPS past 5Y | 15.35% |
| P/S | 8.31 | EPS next 5Y | 9.44% |
| P/B | 7.17 | EPS Q/Q | 4.50% |
| Dividend | - | Sales Q/Q | 9.50% |
| Insider Own | 1.58% | Inst Own | 82.92% |
| Insider Trans | -4.26% | Inst Trans | -0.08% |
| Short Float | 1.62% | Earnings | Apr 25/a |
| Analyst Recom | 2.09 | Target Price | 95.94 |
| Avg Volume | 3.38M | 52W Range | 60.57 - 96.12 |
|
|
|
|
Edwards Lifesciences Corp. engages in patient-focused medical innovations for heart disease and critical care monitoring. Its products are categorized into four main areas: Transcatheter Aortic Valve Replacement, Transcatheter Mitral and Tricuspid Therapies, Surgical Structural Heart, and Critical Care. It operates through the following geographical segments: United States, Europe, Japan, and Rest of World. The company was founded by Miles Lowell Edwards in 1958 and is headquartered in Irvine, CA. |
| Insider Trading |
Relationship |
Date |
Transaction |
Cost |
#Shares |
Value ($) |
#Shares Total |
SEC Form 4 |
| BOBO DONALD E JR | CVP,Strategy/Corp Development | May 10 '24 | Option Exercise | 45.28 | 5,000 | 226,384 | 52,750 | May 13 05:45 PM | | BOBO DONALD E JR | CVP,Strategy/Corp Development | May 10 '24 | Sale | 87.81 | 5,000 | 439,038 | 47,750 | May 13 05:45 PM | | Lippis Daniel J. | CVP, JAPAC | May 07 '24 | Option Exercise | 36.75 | 857 | 31,495 | 25,333 | May 09 07:40 PM | | Lippis Daniel J. | CVP, JAPAC | May 07 '24 | Sale | 85.60 | 857 | 73,359 | 23,890 | May 09 07:40 PM | | Zovighian Bernard J | CEO | May 06 '24 | Buy | 85.74 | 580 | 49,753 | 3,268 | May 07 05:53 PM |
|
|
|
 |
| Market Cap | 74.75B | EPS (ttm) | 1.14 |
| P/E | 45.74 | EPS this Y | 2.27% |
| Forward P/E | 24.27 | EPS next Y | 36.16% |
| PEG | 1.72 | EPS past 5Y | -6.56% |
| P/S | 3.14 | EPS next 5Y | 26.54% |
| P/B | 4.40 | EPS Q/Q | -28.93% |
| Dividend | 1.16% | Sales Q/Q | 21.57% |
| Insider Own | 1.67% | Inst Own | 79.94% |
| Insider Trans | -1.84% | Inst Trans | -0.48% |
| Short Float | 1.71% | Earnings | Apr 23/b |
| Analyst Recom | 1.91 | Target Price | 53.93 |
| Avg Volume | 14.84M | 52W Range | 32.72 - 52.52 |
|
|
|
|
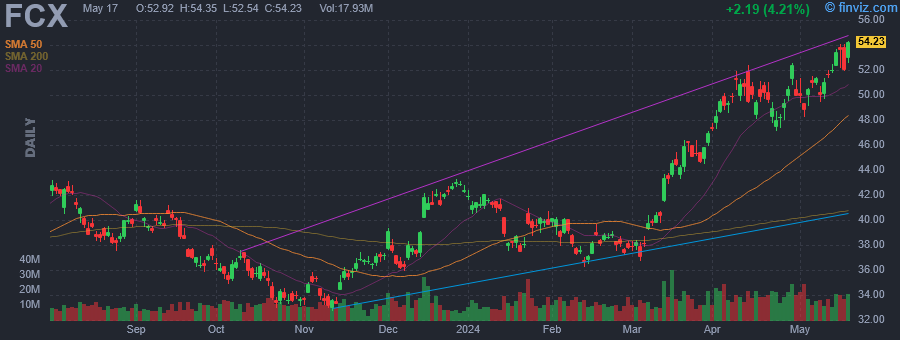
Freeport-McMoRan, Inc. engages in the mining of copper, gold, and molybdenum. It operates through the following segments: North America Copper Mines, South America Mining, Indonesia Mining, Molybdenum Mines, Rod and Refining, Atlantic Copper Smelting and Refining, and Corporate and Other. The North America Copper Mines segment operates open-pit copper mines in Morenci, Bagdad, Safford, Sierrita, Miami in Arizona and Chino, and Tyrone in New Mexico. The South America Mining segment includes Cerro Verde in Peru and El Abra in Chile. The Indonesia Mining segment handles the operations of the Grasberg minerals district that produce copper concentrate containing significant quantities of gold and silver. The Molybdenum Mines segment includes the Henderson underground mine and Climax open pit mine, both in Colorado. The Rod and Refining segment consists of copper conversion facilities located in North America and includes a refinery, and rod mills. The Atlantic Copper Smelting and Refining segment smelts and refines copper concentrate and markets refined copper and precious metals in slimes. The Corporate and Other segment offers other mining and eliminations, oil and gas operations, and other corporate and elimination items. The company was founded by James R. Moffett on November 10, 1987 and is headquartered in Phoenix, AZ. |
| Insider Trading |
Relationship |
Date |
Transaction |
Cost |
#Shares |
Value ($) |
#Shares Total |
SEC Form 4 |
| Higgins Stephen T. | Senior VP & CAO | May 13 '24 | Option Exercise | 15.06 | 80,000 | 1,204,700 | 184,377 | May 13 05:45 PM | | Higgins Stephen T. | Senior VP & CAO | May 13 '24 | Sale | 52.03 | 80,000 | 4,162,512 | 104,377 | May 13 05:45 PM | | ADKERSON RICHARD C | Chairman of the Board & CEO | May 06 '24 | Sale | 50.78 | 54,771 | 2,781,118 | 3,652,478 | May 07 05:56 PM | | Higgins Stephen T. | Senior VP & CAO | May 03 '24 | Option Exercise | 11.91 | 42,767 | 509,355 | 147,144 | May 03 05:30 PM | | Higgins Stephen T. | Senior VP & CAO | May 03 '24 | Sale | 50.35 | 42,767 | 2,153,259 | 104,377 | May 03 05:30 PM |
|
|
| |
 |
| Market Cap | 3.05B | EPS (ttm) | 10.70 |
| P/E | 5.76 | EPS this Y | -8.30% |
| Forward P/E | 7.23 | EPS next Y | -12.35% |
| PEG | - | EPS past 5Y | - |
| P/S | 2.88 | EPS next 5Y | -3.71% |
| P/B | 1.68 | EPS Q/Q | -15.85% |
| Dividend | 10.97% | Sales Q/Q | -4.43% |
| Insider Own | 30.92% | Inst Own | 65.80% |
| Insider Trans | -0.62% | Inst Trans | -12.99% |
| Short Float | 3.87% | Earnings | May 08/b |
| Analyst Recom | 1.00 | Target Price | 70.50 |
| Avg Volume | 571.68K | 52W Range | 30.99 - 62.92 |
|
|
|
|
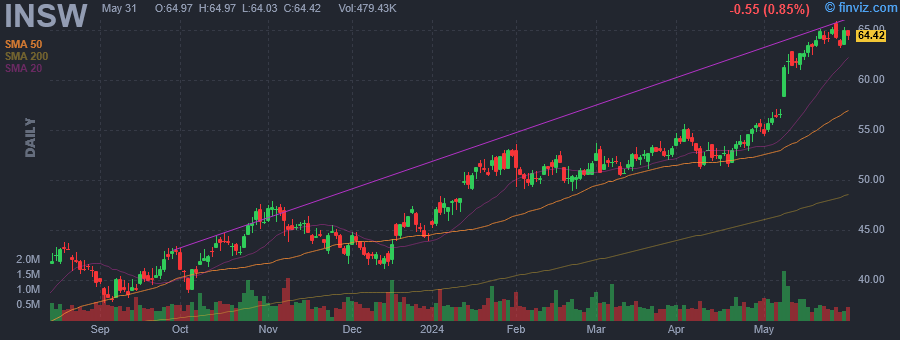
International Seaways, Inc. engages in the transportation of crude oil and petroleum products. It operates through the following segments: Crude Tankers and Product Carriers. The Crude Tankers segment consists of a fleet of vessels that transport unrefined petroleum. The Product Carriers segment focuses on crude and refined petroleum products. The company was founded on December 6, 1999 and is headquartered in New York, NY. |
| Insider Trading |
Relationship |
Date |
Transaction |
Cost |
#Shares |
Value ($) |
#Shares Total |
SEC Form 4 |
| Oshodi Adewale | Vice President & Controller | May 10 '24 | Sale | 62.06 | 6,212 | 385,486 | 6,326 | May 13 05:34 PM | | Solon Derek G. | Senior Vice President | May 10 '24 | Sale | 62.92 | 1,500 | 94,380 | 48,887 | May 13 05:31 PM | | Nugent William F. | Senior Vice President | May 08 '24 | Option Exercise | 21.58 | 4,662 | 100,606 | 60,913 | May 10 04:31 PM | | Zabrocky Lois K | President & CEO | May 01 '24 | Sale | 54.88 | 1,000 | 54,884 | 159,475 | May 03 09:37 AM | | Pribor Jeffrey | SVP,Chief Financial Officer &T | May 01 '24 | Sale | 54.87 | 1,000 | 54,872 | 76,849 | May 03 09:39 AM |
|
|
|
 |
| Market Cap | 1.04B | EPS (ttm) | 5.69 |
| P/E | 9.33 | EPS this Y | 5.07% |
| Forward P/E | 7.44 | EPS next Y | 12.56% |
| PEG | 1.03 | EPS past 5Y | 14.89% |
| P/S | 0.63 | EPS next 5Y | 9.08% |
| P/B | - | EPS Q/Q | -23.92% |
| Dividend | 3.32% | Sales Q/Q | -7.51% |
| Insider Own | 2.30% | Inst Own | 104.78% |
| Insider Trans | -5.37% | Inst Trans | -2.17% |
| Short Float | 6.46% | Earnings | May 14/b |
| Analyst Recom | 2.37 | Target Price | 77.50 |
| Avg Volume | 486.07K | 52W Range | 52.63 - 99.56 |
|
|
|
|
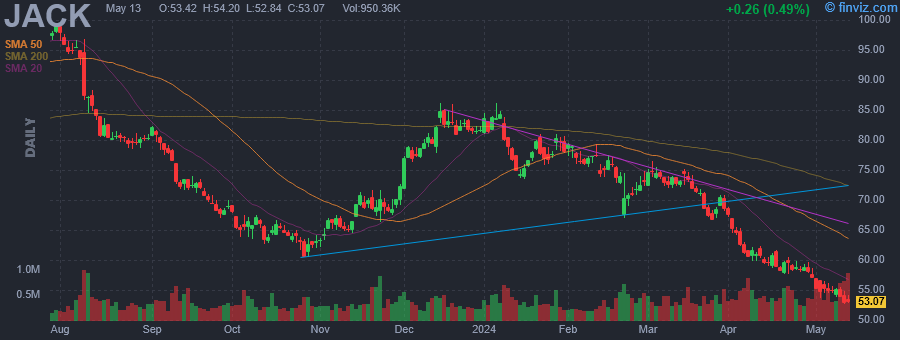
Jack in the Box, Inc. engages in developing, operating, and franchising a chain of quick-service and fast-casual restaurants. It operates through the Jack in the Box and Del Taco segments. The Jack in the Box segment offers a selection of distinctive products including classic burgers and other product lines such as Buttery Jack Burgers. The Del Taco segment focuses on both Mexican and American favorites such as burritos and fries. The company was founded by Robert Oscar Peterson in 1951 and is headquartered in San Diego, CA. |
| Insider Trading |
Relationship |
Date |
Transaction |
Cost |
#Shares |
Value ($) |
#Shares Total |
SEC Form 4 |
| Piano Steven | SVP, CHIEF PEOPLE OFFICER | May 13 '24 | Sale | 53.42 | 148 | 7,906 | 9,112 | May 13 05:33 PM | | MURPHY MICHAEL W | Director | Mar 13 '24 | Sale | 72.58 | 1,332 | 96,677 | 71,035 | Mar 13 06:38 PM | | Ostrom Ryan Lee | EVP, Chief Mktng&Digtl Officer | Feb 16 '24 | Sale | 76.06 | 328 | 24,948 | 17,946 | Feb 16 06:10 PM | | HOOPER DAWN E | SVP, Controller | Feb 06 '24 | Sale | 76.53 | 223 | 17,066 | 6,149 | Feb 06 07:04 PM | | HARRIS DARIN S | DIRECTOR & CEO | Dec 21 '23 | Sale | 81.56 | 3,823 | 311,804 | 91,485 | Dec 21 06:35 PM |
|
|
|
 |
| Market Cap | 23.39B | EPS (ttm) | 1.88 |
| P/E | 58.28 | EPS this Y | 21.12% |
| Forward P/E | 35.28 | EPS next Y | 13.64% |
| PEG | 3.51 | EPS past 5Y | 8.96% |
| P/S | 16.50 | EPS next 5Y | 16.60% |
| P/B | 4.25 | EPS Q/Q | 40.65% |
| Dividend | 0.37% | Sales Q/Q | 24.14% |
| Insider Own | 45.92% | Inst Own | 54.79% |
| Insider Trans | -0.26% | Inst Trans | -4.11% |
| Short Float | 1.92% | Earnings | Apr 25/b |
| Analyst Recom | 1.76 | Target Price | 115.33 |
| Avg Volume | 845.62K | 52W Range | 64.83 - 114.07 |
|
|
|
|
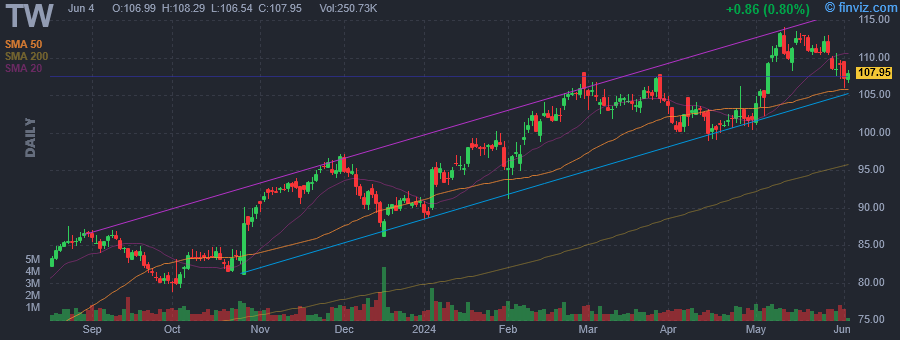
Tradeweb Markets, Inc. engages in the operation of electronic marketplaces for the trading of products across the rates, credit, money markets, and equities asset classes. It also provides related pre-trade pricing and post-trade processing services. Its network comprises clients across the institutional, wholesale, and retail client sectors, including global asset managers, hedge funds, insurance companies, central banks, banks and dealers, proprietary trading firms and retail brokerage and financial advisory firms, as well as regional dealers. The company was founded by Lee Olesky in 1996 and is headquartered in New York, NY. |
| Insider Trading |
Relationship |
Date |
Transaction |
Cost |
#Shares |
Value ($) |
#Shares Total |
SEC Form 4 |
| Hult William | Chief Executive Officer | May 10 '24 | Option Exercise | 20.59 | 47,000 | 967,730 | 276,191 | May 13 05:32 PM | | Hult William | Chief Executive Officer | May 10 '24 | Sale | 111.63 | 47,000 | 5,246,638 | 229,191 | May 13 05:32 PM | | Hult William | Chief Executive Officer | May 09 '24 | Option Exercise | 20.59 | 51,000 | 1,050,090 | 280,191 | May 13 05:32 PM | | Hult William | Chief Executive Officer | May 09 '24 | Sale | 112.57 | 51,000 | 5,740,978 | 229,191 | May 13 05:32 PM | | Zucker Scott | Chief Admin. and Risk Officer | May 07 '24 | Sale | 110.56 | 2,517 | 278,269 | 28,833 | May 08 06:55 PM |
|
|
|
