 |
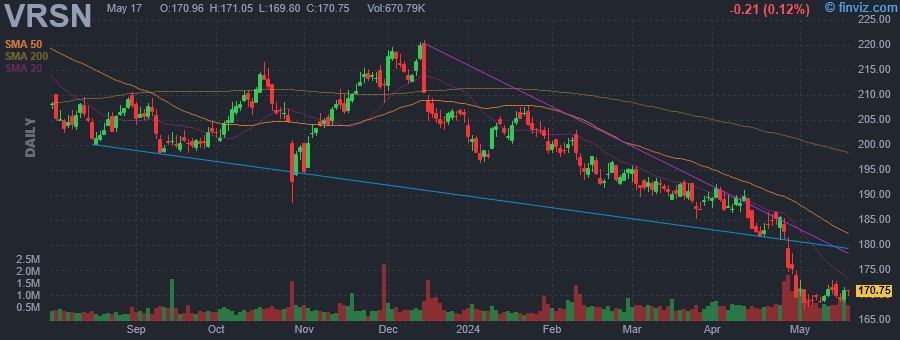
| Market Cap | 17.04B | EPS (ttm) | 8.13 |
| P/E | 21.03 | EPS this Y | -0.04% |
| Forward P/E | 19.79 | EPS next Y | 9.49% |
| PEG | 2.63 | EPS past 5Y | 10.71% |
| P/S | 11.26 | EPS next 5Y | 8.00% |
| P/B | - | EPS Q/Q | 13.03% |
| Dividend | - | Sales Q/Q | 5.46% |
| Insider Own | 0.89% | Inst Own | 93.28% |
| Insider Trans | -8.64% | Inst Trans | -2.24% |
| Short Float | 1.76% | Earnings | Apr 25/a |
| Analyst Recom | 2.60 | Target Price | 204.33 |
| Avg Volume | 691.12K | 52W Range | 167.04 - 229.72 |
|
|
|
|
VeriSign, Inc. provides domain name registry services and Internet infrastructure, which enables Internet navigation for many of the world's most recognized domain names. It enables the security, stability, and resiliency of key Internet infrastructure and services, including providing root zone maintainer services. The company was founded by D. James Bidzos in 1995, and is headquartered in Reston, VA. |
| Insider Trading |
Relationship |
Date |
Transaction |
Cost |
#Shares |
Value ($) |
#Shares Total |
SEC Form 4 |
| Buchalter Yehuda Ari | Director | May 10 '24 | Sale | 170.01 | 734 | 124,791 | 2,927 | May 13 04:40 PM | | Buchalter Yehuda Ari | Director | May 09 '24 | Sale | 170.01 | 866 | 147,232 | 3,661 | May 13 04:40 PM | | Buchalter Yehuda Ari | Director | May 07 '24 | Sale | 170.00 | 1 | 170 | 4,527 | May 09 04:43 PM | | Indelicarto Thomas C | EVP, Gen Counsel & Secretary | Apr 11 '24 | Sale | 190.00 | 614 | 116,660 | 41,955 | Apr 12 04:32 PM | | Indelicarto Thomas C | EVP, Gen Counsel & Secretary | Apr 02 '24 | Sale | 190.00 | 614 | 116,660 | 42,569 | Apr 03 05:50 PM |
|
|
 |
 |
| Market Cap | 3.05B | EPS (ttm) | 3.43 |
| P/E | 8.20 | EPS this Y | -0.37% |
| Forward P/E | 8.11 | EPS next Y | 12.81% |
| PEG | 0.82 | EPS past 5Y | - |
| P/S | 0.70 | EPS next 5Y | 10.00% |
| P/B | 1.29 | EPS Q/Q | 14572.86% |
| Dividend | 2.17% | Sales Q/Q | 18.06% |
| Insider Own | 2.60% | Inst Own | 95.65% |
| Insider Trans | -8.09% | Inst Trans | -1.34% |
| Short Float | 2.25% | Earnings | Apr 29/a |
| Analyst Recom | 2.71 | Target Price | 29.00 |
| Avg Volume | 773.97K | 52W Range | 20.78 - 28.43 |
|
|
|
|
CNO Financial Group, Inc. is an insurance holding company, which engages in developing, marketing, and administering health insurance, annuity, individual life insurance and other insurance products. It operates through the following segments: Bankers Life, Washington National, and Colonial Penn. The Bankers Life segment markets and distributes medicare supplement insurance, interest-sensitive life insurance, traditional life insurance, fixed annuities and long-term care insurance products to the middle-income senior market through a dedicated field force of career agents and sales managers supported by a network of community-based sales offices. The Washington National segment markets and distributes supplemental health including specified disease, accident and hospital indemnity insurance products and life insurance to middle-income consumers at home and at the worksite. The Colonial Penn segment markets primarily graded benefit and simplified issue life insurance directly to customers in the senior middle-income market through television advertising, direct mail, the Internet and telemarketing. The company was founded in 1979 and is headquartered in Carmel, IN. |
| Insider Trading |
Relationship |
Date |
Transaction |
Cost |
#Shares |
Value ($) |
#Shares Total |
SEC Form 4 |
| TARASI ROCCO F III | Chief Marketing Officer | May 13 '24 | Sale | 28.50 | 3,500 | 99,750 | 81,380 | May 13 04:39 PM | | Franzese Yvonne K | CHRO | May 09 '24 | Sale | 28.25 | 15,021 | 424,343 | 31,611 | May 13 04:39 PM | | TARASI ROCCO F III | Chief Marketing Officer | May 09 '24 | Sale | 28.00 | 3,197 | 89,516 | 84,880 | May 13 04:39 PM | | DeToro Karen | President, Worksite Division | Apr 09 '24 | Sale | 27.10 | 2,778 | 75,284 | 69,605 | Apr 09 04:28 PM | | DeToro Karen | President, Worksite Division | Apr 02 '24 | Sale | 27.12 | 2,666 | 72,302 | 72,383 | Apr 02 05:25 PM |
|
|
|
 |
| Market Cap | 12.17B | EPS (ttm) | 4.87 |
| P/E | 24.48 | EPS this Y | 3.81% |
| Forward P/E | 20.81 | EPS next Y | 13.81% |
| PEG | 8.16 | EPS past 5Y | 9.54% |
| P/S | 5.69 | EPS next 5Y | 3.00% |
| P/B | 10.31 | EPS Q/Q | 2.39% |
| Dividend | 4.43% | Sales Q/Q | 5.69% |
| Insider Own | 14.87% | Inst Own | 83.16% |
| Insider Trans | -0.14% | Inst Trans | 0.33% |
| Short Float | 2.50% | Earnings | May 02/b |
| Analyst Recom | 2.60 | Target Price | 119.67 |
| Avg Volume | 446.17K | 52W Range | 77.21 - 121.99 |
|
|
|
|
Lamar Advertising Co. engages in advertising services. The firm rents advertising space on billboards, buses, shelters, benches, logo plates, and in airport terminals. The company was founded in 1902 and is headquartered in Baton Rouge, LA. |
| Insider Trading |
Relationship |
Date |
Transaction |
Cost |
#Shares |
Value ($) |
#Shares Total |
SEC Form 4 |
| KOERNER JOHN E III | Director | May 10 '24 | Sale | 120.05 | 17,000 | 2,040,866 | 32,178 | May 13 04:39 PM | | Johnson Jay LeCoryelle | CFO, Treasurer, EVP | Mar 07 '24 | Sale | 118.97 | 5,000 | 594,862 | 10,000 | Mar 08 04:03 PM | | Johnson Jay LeCoryelle | CFO, Treasurer, EVP | Sep 05 '23 | Sale | 89.50 | 5,000 | 447,496 | 15,000 | Sep 06 04:07 PM | | Fletcher Nancy | Director | Sep 01 '23 | Buy | 91.94 | 100 | 9,194 | 4,825 | Sep 05 04:02 PM |
|
|
| |
 |
| Market Cap | 3.19B | EPS (ttm) | 1.33 |
| P/E | 16.49 | EPS this Y | 21.20% |
| Forward P/E | 10.68 | EPS next Y | 6.92% |
| PEG | - | EPS past 5Y | -15.55% |
| P/S | 0.52 | EPS next 5Y | - |
| P/B | 1.15 | EPS Q/Q | -24.07% |
| Dividend | - | Sales Q/Q | -4.07% |
| Insider Own | 1.16% | Inst Own | 95.26% |
| Insider Trans | -1.68% | Inst Trans | -0.84% |
| Short Float | 1.74% | Earnings | May 02/a |
| Analyst Recom | 2.50 | Target Price | 24.47 |
| Avg Volume | 1.06M | 52W Range | 14.19 - 23.21 |
|
|
|
|
Resideo Technologies, Inc. operates as a manufacturer and developer of technology-driven products and components that provide critical comfort, energy management, and safety and security solutions. It operates through the Products and Solutions and ADI Global Distribution segments. The Products and Solutions segment includes temperature and humidity control, energy products and solutions, water and air solutions, smoke and carbon monoxide detection home safety products, security panels, sensors, peripherals, wire and cable, communications devices, video cameras, other home-related lifestyle convenience solutions, cloud infrastructure, installation and maintenance tools, and related software. The ADI Global Distribution segment provides low-voltage security products including access control, fire detection, security, and video products and participates significantly in the broader related markets of audio, communications, data communications, networking, power, ProAV, smart home, and wire and cable. The company was founded on April 24, 2018 and is headquartered in Scottsdale, AZ. |
| Insider Trading |
Relationship |
Date |
Transaction |
Cost |
#Shares |
Value ($) |
#Shares Total |
SEC Form 4 |
| Richardson Nina | Director | May 09 '24 | Sale | 21.33 | 5,578 | 118,979 | 51,311 | May 13 04:38 PM | | Beskid Tina M | Chief Accounting Officer | May 09 '24 | Sale | 21.46 | 3,310 | 71,026 | 64,960 | May 13 04:38 PM | | Theodore Phillip L. | President Products & Solutions | Nov 16 '23 | Sale | 16.45 | 20,000 | 329,000 | 149,855 | Nov 20 04:35 PM | | Beskid Tina M | Chief Accounting Officer | Jun 07 '23 | Sale | 17.25 | 13,543 | 233,617 | 41,259 | Jun 09 05:19 PM |
|
|
|
 |
| Market Cap | 2.48B | EPS (ttm) | 1.59 |
| P/E | 14.24 | EPS this Y | 25.97% |
| Forward P/E | 5.95 | EPS next Y | 81.62% |
| PEG | - | EPS past 5Y | - |
| P/S | 3.80 | EPS next 5Y | -0.30% |
| P/B | 2.60 | EPS Q/Q | 758.09% |
| Dividend | 3.55% | Sales Q/Q | 25.58% |
| Insider Own | 45.34% | Inst Own | 33.91% |
| Insider Trans | -1.37% | Inst Trans | - |
| Short Float | 10.22% | Earnings | May 06/b |
| Analyst Recom | 1.27 | Target Price | 26.00 |
| Avg Volume | 851.99K | 52W Range | 15.16 - 24.56 |
|
|
|
|
Atlas Energy Solutions, Inc. operates as a proppant and proppant logistics company. It offers services to the oil and gas industry. The company was founded by Ben M. Brigham in 2017 and is headquartered in Austin, TX. |
| Insider Trading |
Relationship |
Date |
Transaction |
Cost |
#Shares |
Value ($) |
#Shares Total |
SEC Form 4 |
| Schmidt Richard W | Member of 10% Owner Group | May 10 '24 | Sale | 22.80 | 22,400 | 510,720 | 1,029,263 | May 13 04:38 PM | | Schmidt Richard W | Member of 10% Owner Group | May 09 '24 | Sale | 22.98 | 51,150 | 1,175,427 | 1,051,663 | May 13 04:38 PM | | Schmidt Richard W | Member of 10% Owner Group | Mar 26 '24 | Sale | 22.21 | 16,740 | 371,795 | 1,102,813 | Mar 27 01:25 PM | | Schmidt Richard W | Member of 10% Owner Group | Mar 25 '24 | Sale | 22.44 | 21,043 | 472,205 | 1,119,553 | Mar 27 01:25 PM | | Ginn Kirk Edwards | Member of 10% Owner Group | Mar 18 '24 | Sale | 21.73 | 1,562 | 33,950 | 479,525 | Mar 19 05:57 PM |
|
|
| |
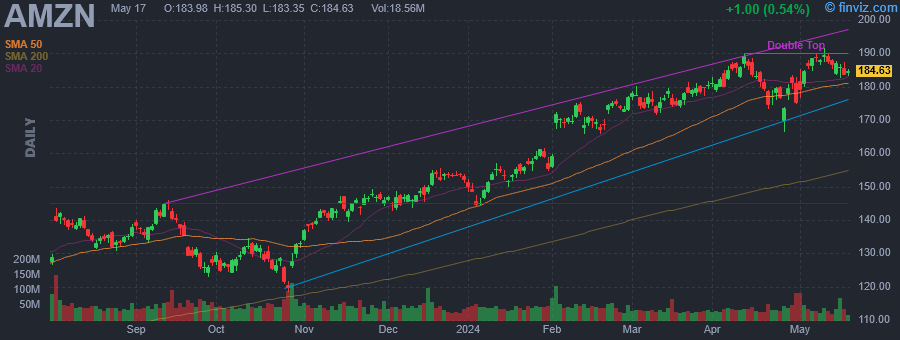 |
| Market Cap | 1941.56B | EPS (ttm) | 3.56 |
| P/E | 52.40 | EPS this Y | 56.81% |
| Forward P/E | 32.09 | EPS next Y | 27.87% |
| PEG | 1.72 | EPS past 5Y | 23.55% |
| P/S | 3.29 | EPS next 5Y | 30.50% |
| P/B | 8.96 | EPS Q/Q | 218.85% |
| Dividend | - | Sales Q/Q | 12.53% |
| Insider Own | 11.09% | Inst Own | 62.22% |
| Insider Trans | -4.18% | Inst Trans | 0.60% |
| Short Float | 0.70% | Earnings | Apr 30/a |
| Analyst Recom | 1.22 | Target Price | 222.26 |
| Avg Volume | 41.07M | 52W Range | 109.25 - 191.70 |
|
|
|
|
Amazon.com, Inc. is a multinational technology company, which engages in providing online retail shopping services. It operates through the following segments: North America, International, and Amazon Web Services (AWS). The North America segment is involved in the retail sales of consumer products including from sellers and subscriptions through North America-focused online and physical stores. The International segment focuses on the amounts earned from retail sales of consumer products including from sellers and subscriptions through internationally focused online stores. The AWS segment includes global sales of computer, storage, database, and other services for start-ups, enterprises, government agencies, and academic institutions. The company was founded by Jeffrey P. Bezos in July 1994 and is headquartered in Seattle, WA. |
| Insider Trading |
Relationship |
Date |
Transaction |
Cost |
#Shares |
Value ($) |
#Shares Total |
SEC Form 4 |
| RUBINSTEIN JONATHAN | Director | May 09 '24 | Sale | 190.00 | 5,264 | 1,000,160 | 104,400 | May 13 04:37 PM | | Alexander Keith Brian | Director | May 06 '24 | Sale | 186.22 | 1,000 | 186,220 | 4,760 | May 08 04:42 PM | | Herrington Douglas J | CEO Worldwide Amazon Stores | May 01 '24 | Sale | 180.29 | 3,500 | 631,012 | 509,358 | May 03 05:16 PM | | Selipsky Adam | CEO Amazon Web Services | Apr 19 '24 | Sale | 179.00 | 500 | 89,500 | 130,100 | Apr 22 04:25 PM | | Selipsky Adam | CEO Amazon Web Services | Apr 18 '24 | Sale | 181.38 | 500 | 90,690 | 130,600 | Apr 22 04:25 PM |
|
|
|
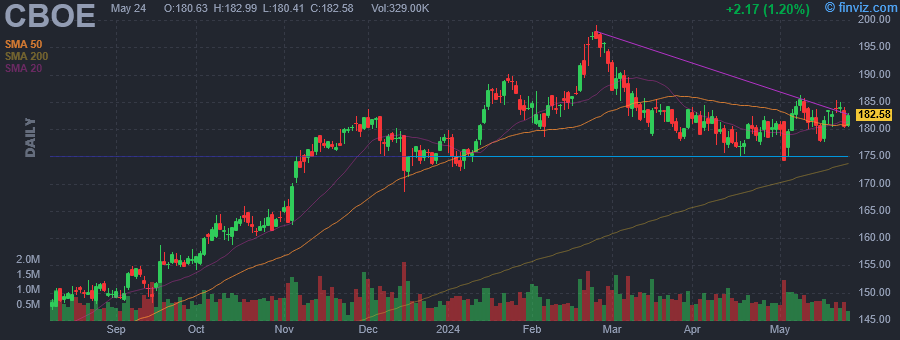 |
| Market Cap | 19.15B | EPS (ttm) | 7.47 |
| P/E | 24.37 | EPS this Y | 9.36% |
| Forward P/E | 20.11 | EPS next Y | 6.16% |
| PEG | 2.72 | EPS past 5Y | 13.65% |
| P/S | 5.12 | EPS next 5Y | 8.96% |
| P/B | 4.77 | EPS Q/Q | 20.80% |
| Dividend | 1.28% | Sales Q/Q | -3.14% |
| Insider Own | 0.42% | Inst Own | 86.51% |
| Insider Trans | -5.79% | Inst Trans | -3.05% |
| Short Float | 2.02% | Earnings | May 03/b |
| Analyst Recom | 2.39 | Target Price | 193.93 |
| Avg Volume | 825.96K | 52W Range | 130.91 - 199.00 |
|
|
|
|
Cboe Global Markets, Inc. engages in the provision of trading and investment solutions to investors. It operates through the following business segments: Options, North American Equities, Futures, Europe and Asia Pacific, Global FX, and Digital. The Options segment includes the options exchange business, which lists trading options on market indexes and on non-exclusive multiply listed options. The North American Equities segment covers listed cash equities and ETP transaction services that occur on BZX, BYX, EDGX, and EDGA. The Futures segment refers to the business of futures exchange, CFE, which includes offering for trading futures on the VIX Index and bitcoin and other futures products. The Europe and Asia Pacific segment relates to the pan-European listed cash equities transaction services, ETPs, exchange-traded commodities, and international depository receipts that occur on the RIE, operated by Cboe Europe Equities. The Global FX segment represents the institutional FX trading services that occur on the Cboe FX platform. The Digital segment focuses on Cboe Digital, which operates a digital asset spot market and a regulated futures exchange. The company was founded in 1973 and is headquartered in Chicago, IL. |
| Insider Trading |
Relationship |
Date |
Transaction |
Cost |
#Shares |
Value ($) |
#Shares Total |
SEC Form 4 |
| Clay Catherine R | EVP, GLOBAL DERIVATIVES | May 09 '24 | Sale | 185.06 | 1,100 | 203,566 | 4,656 | May 13 04:37 PM | | Sexton John P | EVP, GC AND CORP SEC | Mar 11 '24 | Sale | 185.00 | 6,968 | 1,289,080 | 16,569 | Mar 13 04:32 PM | | Wilkinson Allen | SVP, CHIEF ACCOUNTING OFFICER | Mar 11 '24 | Sale | 184.94 | 275 | 50,858 | 83 | Mar 13 04:33 PM | | Howson Dave | EVP, GLOBAL PRESIDENT | Feb 20 '24 | Sale | 186.96 | 5,322 | 995,001 | 17,573 | Feb 22 04:48 PM | | Howson Dave | EVP, GLOBAL PRESIDENT | Feb 19 '24 | Option Exercise | 186.69 | 9,734 | 1,817,240 | 24,519 | Feb 22 04:48 PM |
|
|
| |
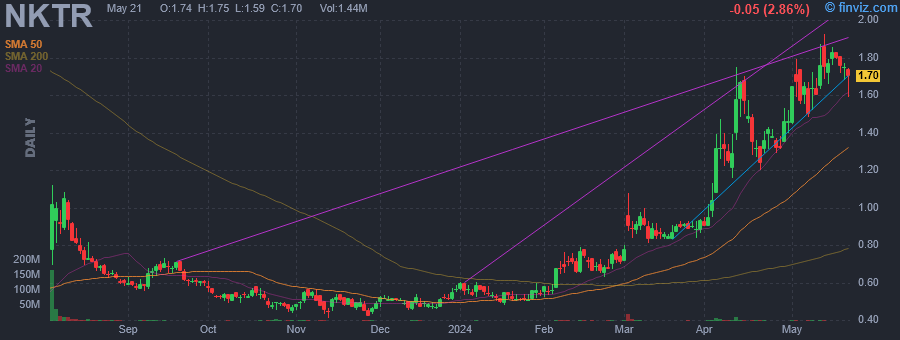 |
| Market Cap | 321.34M | EPS (ttm) | -0.92 |
| P/E | - | EPS this Y | 44.31% |
| Forward P/E | - | EPS next Y | 5.57% |
| PEG | - | EPS past 5Y | - |
| P/S | 3.56 | EPS next 5Y | -7.30% |
| P/B | 2.54 | EPS Q/Q | 73.95% |
| Dividend | - | Sales Q/Q | 0.21% |
| Insider Own | 3.09% | Inst Own | 62.88% |
| Insider Trans | -2.23% | Inst Trans | -4.28% |
| Short Float | 1.99% | Earnings | May 09/a |
| Analyst Recom | 3.00 | Target Price | 3.30 |
| Avg Volume | 2.56M | 52W Range | 0.41 - 1.87 |
|
|
|
|
Nektar Therapeutics is a research-based biopharmaceutical company which engages in discovering and developing medicines in areas of unmet medical need. Its research and development pipeline of new investigational drugs includes therapies for oncology, immunology and virology. The firm focuses on using new chemistry approaches to make medicines to treat cancer and autoimmune diseases. The company was founded in 1990 and is headquartered in San Francisco, CA. |
| Insider Trading |
Relationship |
Date |
Transaction |
Cost |
#Shares |
Value ($) |
#Shares Total |
SEC Form 4 |
| Deep Track Capital, LP | 10% Owner | May 10 '24 | Sale | 1.78 | 56,000 | 99,630 | 18,344,000 | May 13 04:36 PM | | ROBIN HOWARD W | President & CEO | Feb 20 '24 | Sale | 0.68 | 20,033 | 13,622 | 879,889 | Feb 22 08:16 PM | | Zalevsky Jonathan | Chief R&D Officer | Feb 20 '24 | Sale | 0.68 | 9,014 | 6,130 | 265,025 | Feb 22 08:19 PM | | Wilson Mark Andrew | Chief Legal Officer | Feb 20 '24 | Sale | 0.68 | 7,606 | 5,172 | 236,674 | Feb 22 08:17 PM | | ROBIN HOWARD W | President & CEO | Nov 17 '23 | Sale | 0.49 | 19,877 | 9,740 | 899,922 | Nov 20 08:58 PM |
|
|
|
 |
| Market Cap | 2.07B | EPS (ttm) | 6.18 |
| P/E | 28.32 | EPS this Y | 3.01% |
| Forward P/E | 22.09 | EPS next Y | 14.84% |
| PEG | 2.02 | EPS past 5Y | 32.24% |
| P/S | 2.85 | EPS next 5Y | 14.00% |
| P/B | 3.33 | EPS Q/Q | -80.30% |
| Dividend | 0.67% | Sales Q/Q | -3.83% |
| Insider Own | 1.92% | Inst Own | 93.50% |
| Insider Trans | -10.13% | Inst Trans | -1.04% |
| Short Float | 1.60% | Earnings | May 02/a |
| Analyst Recom | 1.00 | Target Price | 188.25 |
| Avg Volume | 70.66K | 52W Range | 130.04 - 184.18 |
|
|
|
|
Standex International Corp. engages in the provision of products and services for commercial and industrial markets. It operates through the following segments: Electronics, Engraving, Scientific, Engineering Technologies, and Specialty Solutions. The Electronics segment is involved in the manufacturing and selling of electronic components for applications throughout the end-user market spectrum. The Engraving segment provides mold texturizing, slush molding tools, project management and design services, roll engraving, hygiene product tooling, low observation vents for stealth aircraft, and process machinery. The Scientific segment includes temperature-controlled equipment for the medical, scientific, pharmaceutical, biotech and industrial markets. The Engineering Technologies segment offers net and near net formed single-source customized solutions in the manufacture of engineered components for the aviation, aerospace, defense, energy, industrial, medical, marine, oil and gas, and manned and unmanned space markets. The Specialty Solutions segment refers to the manufacture and sale of refrigerated, heated and dry merchandizing display cases, custom fluid pump solutions, and single and double acting telescopic and piston rod hydraulic cylinders. The company was founded by John Bolten in 1955 and is headquartered in Salem, NH. |
| Insider Trading |
Relationship |
Date |
Transaction |
Cost |
#Shares |
Value ($) |
#Shares Total |
SEC Form 4 |
| CANNON CHARLES H JR | Director | May 09 '24 | Sale | 178.02 | 2,460 | 437,937 | 862 | May 13 04:35 PM | | Dunbar David A. | President/CEO/Chairman | Mar 07 '24 | Sale | 180.00 | 3,099 | 557,820 | 54,233 | Mar 08 09:51 AM | | Dunbar David A. | President/CEO/Chairman | Mar 06 '24 | Sale | 180.00 | 4,901 | 882,180 | 57,332 | Mar 07 01:37 PM | | HANSEN THOMAS J | Director | Feb 20 '24 | Sale | 161.04 | 2,200 | 354,299 | 11,370 | Feb 22 09:16 AM | | Dunbar David A. | President/CEO/Chairman | Feb 15 '24 | Sale | 165.00 | 5,000 | 825,000 | 62,233 | Feb 16 02:49 PM |
|
|
|
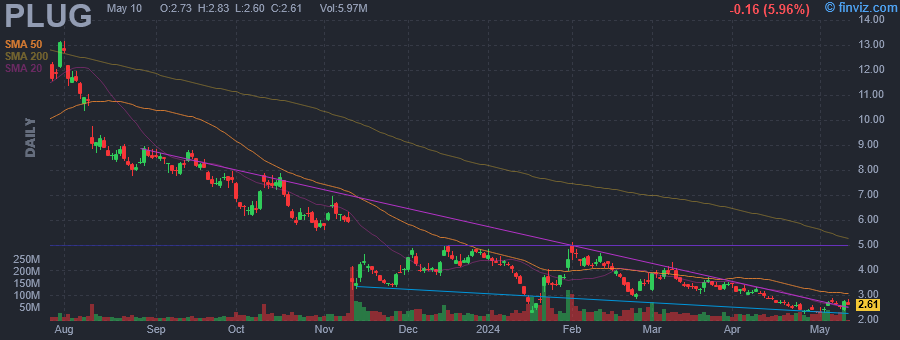 |
| Market Cap | 2.01B | EPS (ttm) | -2.39 |
| P/E | - | EPS this Y | 49.25% |
| Forward P/E | - | EPS next Y | 52.37% |
| PEG | - | EPS past 5Y | -45.13% |
| P/S | 2.51 | EPS next 5Y | - |
| P/B | 0.68 | EPS Q/Q | -31.55% |
| Dividend | - | Sales Q/Q | -42.81% |
| Insider Own | 8.80% | Inst Own | 43.04% |
| Insider Trans | -0.02% | Inst Trans | 6.97% |
| Short Float | 30.14% | Earnings | May 09/b |
| Analyst Recom | 2.70 | Target Price | 4.82 |
| Avg Volume | 33.01M | 52W Range | 2.25 - 13.44 |
|
|
|
|
Plug Power, Inc. provides alternative energy technology, which focuses on the design, development, commercialization, and manufacture of hydrogen and fuel cell systems used primarily for the material handling and stationary power markets. Its fuel cell system solution is designed to replace lead-acid batteries in electric material handling vehicles and industrial trucks for some distribution and manufacturing businesses. The company was founded by George C. McNamee and Larry G. Garberding on June 27, 1997, and is headquartered in Latham, NY. |
| Insider Trading |
Relationship |
Date |
Transaction |
Cost |
#Shares |
Value ($) |
#Shares Total |
SEC Form 4 |
| MCNAMEE GEORGE C | Director | May 10 '24 | Sale | 2.56 | 10,000 | 25,576 | 639,572 | May 13 04:34 PM | | Kenausis Gregory | Director | Oct 23 '23 | Option Exercise | 1.41 | 143,964 | 203,651 | 265,900 | Nov 03 04:15 PM | | Crespo Jose Luis | GM, MATL Handling, Key Accts | Oct 02 '23 | Sale | 7.20 | 31,958 | 230,098 | 250,609 | Oct 04 04:16 PM | | Schmid Keith | GM New Mkts & Pres New Prd Dv | Sep 15 '23 | Option Exercise | 0.57 | 100,000 | 57,000 | 517,971 | Sep 21 04:16 PM |
|
|
|
