 |
| Market Cap | 1.38B | EPS (ttm) | -0.05 |
| P/E | - | EPS this Y | -87.34% |
| Forward P/E | 18.38 | EPS next Y | 679.68% |
| PEG | - | EPS past 5Y | - |
| P/S | 2.45 | EPS next 5Y | - |
| P/B | 1.59 | EPS Q/Q | -195.36% |
| Dividend | - | Sales Q/Q | -40.00% |
| Insider Own | 2.42% | Inst Own | 90.26% |
| Insider Trans | -0.95% | Inst Trans | -0.25% |
| Short Float | 2.54% | Earnings | May 02/a |
| Analyst Recom | 1.86 | Target Price | 34.71 |
| Avg Volume | 301.96K | 52W Range | 28.57 - 43.99 |
|
|
|
|
Cohu, Inc. engages in the provision of back-end semiconductor equipment and services. It offers test and handling capital equipment, interface products, and related services to the semiconductor and electronics manufacturing industries. The company was founded in 1947 and is headquartered in Poway, CA. |
| Insider Trading |
Relationship |
Date |
Transaction |
Cost |
#Shares |
Value ($) |
#Shares Total |
SEC Form 4 |
| BILODEAU STEVEN J | Director | May 10 '24 | Sale | 29.24 | 1,126 | 32,924 | 57,055 | May 13 03:49 PM | | BILODEAU STEVEN J | Director | May 09 '24 | Sale | 29.05 | 6,854 | 199,109 | 58,181 | May 13 03:49 PM | | KAMPFER THOMAS D | VP Corp Dev, GC & Sec | Nov 15 '23 | Sale | 32.82 | 3,000 | 98,460 | 54,482 | Nov 16 03:18 PM | | LAWEE IAN P | Sr. VP & GM | Aug 31 '23 | Sale | 37.55 | 2,000 | 75,100 | 53,139 | Sep 05 11:00 AM | | Jones Jeffrey D | Sr. VP Finance & CFO | Jun 14 '23 | Sale | 40.00 | 10,000 | 400,000 | 258,990 | Jun 16 05:29 PM |
|
|
 |
 |
| Market Cap | 848.19M | EPS (ttm) | 3.26 |
| P/E | 11.39 | EPS this Y | -67.45% |
| Forward P/E | 7.46 | EPS next Y | 74.47% |
| PEG | - | EPS past 5Y | - |
| P/S | 0.08 | EPS next 5Y | - |
| P/B | 1.46 | EPS Q/Q | -85.56% |
| Dividend | 2.14% | Sales Q/Q | 13.42% |
| Insider Own | 23.22% | Inst Own | 69.50% |
| Insider Trans | -2.64% | Inst Trans | -3.94% |
| Short Float | 23.44% | Earnings | May 07/a |
| Analyst Recom | 1.50 | Target Price | 38.75 |
| Avg Volume | 446.75K | 52W Range | 23.14 - 42.48 |
|
|
|
|
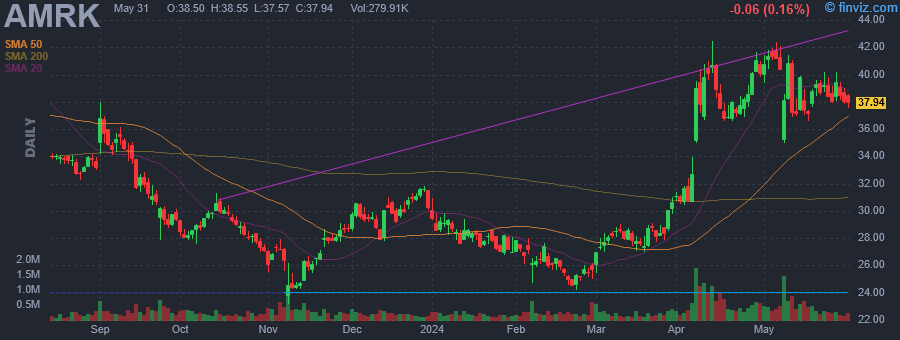
A-Mark Precious Metals, Inc. engages in the trading of gold, silver, platinum, and palladium bullion numismatic coins, and related products. It operates through the following segments: Wholesale Trading and Ancillary Services, Direct-to-Consumer, and Secured Lending. The Wholesale Trading and Ancillary Services segment is involved in the distribution and purchasing of metal products from sovereign and private mints. The Direct-to-Consumer segment provides access to a multitude of products through its wholly owned subsidiaries. The Secured Lending segment includes coin and precious metal dealers, investors, and collectors. The company was founded by Steven C. Markoff on April 9, 1965 and is headquartered in El Segundo, CA. |
| Insider Trading |
Relationship |
Date |
Transaction |
Cost |
#Shares |
Value ($) |
#Shares Total |
SEC Form 4 |
| ROBERTS GREGORY N | Chief Executive Officer | May 10 '24 | Option Exercise | 8.40 | 10,000 | 84,000 | 38,202 | May 13 11:55 AM | | Wittmeyer Michael R. | Director | May 10 '24 | Sale | 38.15 | 44,585 | 1,700,848 | 350,432 | May 13 03:46 PM | | ROBERTS GREGORY N | Chief Executive Officer | May 10 '24 | Sale | 38.53 | 10,000 | 385,335 | 28,202 | May 13 11:55 AM | | ROBERTS GREGORY N | Chief Executive Officer | Mar 01 '24 | Option Exercise | 6.40 | 3,904 | 24,986 | 32,106 | Mar 05 11:34 AM | | ROBERTS GREGORY N | Chief Executive Officer | Mar 01 '24 | Sale | 26.15 | 3,904 | 102,099 | 28,202 | Mar 05 11:34 AM |
|
|
|
 |
| Market Cap | 2.17B | EPS (ttm) | 1.35 |
| P/E | 33.99 | EPS this Y | 16.60% |
| Forward P/E | 13.02 | EPS next Y | 13.83% |
| PEG | 3.40 | EPS past 5Y | -12.45% |
| P/S | 0.85 | EPS next 5Y | 10.00% |
| P/B | 2.81 | EPS Q/Q | 868.42% |
| Dividend | 2.79% | Sales Q/Q | 22.73% |
| Insider Own | 2.10% | Inst Own | 79.81% |
| Insider Trans | -9.44% | Inst Trans | -0.88% |
| Short Float | 1.13% | Earnings | Apr 29/b |
| Analyst Recom | 1.00 | Target Price | 55.33 |
| Avg Volume | 266.23K | 52W Range | 25.06 - 46.02 |
|
|
|
|
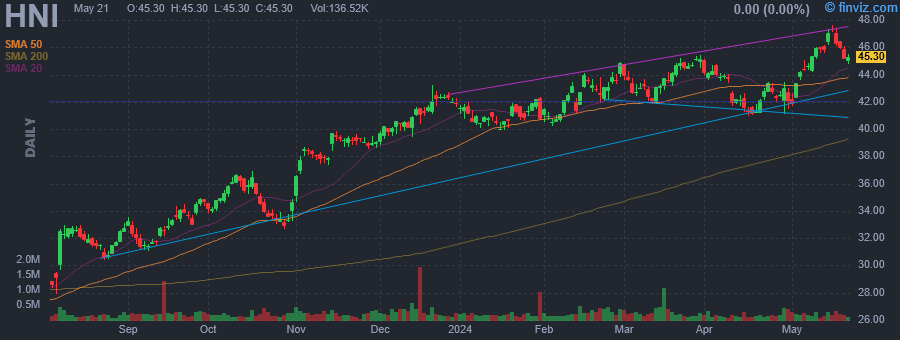
HNI Corp. engages in the provision of workplace furnishings and residential building products. It operates through the Workplace Furnishing and Residential Building Products segments. The Workplace Furnishings segment manufactures and markets a broad line of commercial and home office furniture, which includes panel-based and freestanding furniture systems, seating, storage, tables, and architectural products. The Residential Building Products segment manufactures and markets a full array of gas, wood, electric, and pellet fueled fireplaces, inserts, stoves, facings, and accessories. The company was founded by C. Maxwell Stanley, Clem Hanson, and H. Wood Miller in 1944 and is headquartered in Muscatine, IA. |
| Insider Trading |
Relationship |
Date |
Transaction |
Cost |
#Shares |
Value ($) |
#Shares Total |
SEC Form 4 |
| Porcellato Larry B | Director | May 10 '24 | Sale | 46.00 | 202 | 9,292 | 38,898 | May 13 02:56 PM | | Porcellato Larry B | Director | May 09 '24 | Sale | 46.00 | 1,796 | 82,616 | 39,100 | May 10 12:59 PM | | CALADO MIGUEL M | Director | May 09 '24 | Sale | 46.00 | 1,706 | 78,476 | 33,783 | May 10 12:56 PM | | Porcellato Larry B | Director | Mar 18 '24 | Sale | 44.00 | 2,000 | 88,000 | 40,718 | Mar 19 12:00 PM | | CALADO MIGUEL M | Director | Mar 18 '24 | Sale | 44.00 | 1,500 | 66,000 | 35,489 | Mar 19 01:34 PM |
|
|
| |
 |
| Market Cap | 10.78B | EPS (ttm) | 5.73 |
| P/E | 30.89 | EPS this Y | 42.08% |
| Forward P/E | 27.92 | EPS next Y | 5.91% |
| PEG | 1.40 | EPS past 5Y | 6.00% |
| P/S | 3.37 | EPS next 5Y | 22.01% |
| P/B | 4.61 | EPS Q/Q | 169.71% |
| Dividend | 0.55% | Sales Q/Q | 16.31% |
| Insider Own | 6.65% | Inst Own | 81.04% |
| Insider Trans | -1.64% | Inst Trans | -2.99% |
| Short Float | 2.52% | Earnings | Apr 29/a |
| Analyst Recom | 2.27 | Target Price | 182.44 |
| Avg Volume | 437.73K | 52W Range | 105.18 - 180.35 |
|
|
|
|
Woodward, Inc. engages in the provision of control system solutions and components for the aerospace and industrial markets. It operates through the Aerospace and Industrial segments. The Aerospace segment involves the design, manufacture, services systems, and products for the management of fuel, air, combustion, and motion control. The Industrial segment includes the management of fuel, air, fluids, gases, electricity, motion, and combustion. The company was founded by Amos W. Woodward in 1870 and is headquartered in Fort Collins, CO. |
| Insider Trading |
Relationship |
Date |
Transaction |
Cost |
#Shares |
Value ($) |
#Shares Total |
SEC Form 4 |
| Cromwell Thomas G | EVP and COO | May 10 '24 | Option Exercise | 104.77 | 1,899 | 198,958 | 13,732 | May 13 02:53 PM | | Cromwell Thomas G | EVP and COO | May 10 '24 | Sale | 179.50 | 1,899 | 340,870 | 11,833 | May 13 02:53 PM | | Cromwell Thomas G | EVP and COO | May 09 '24 | Option Exercise | 104.77 | 3,260 | 341,550 | 15,093 | May 13 02:53 PM | | Cromwell Thomas G | EVP and COO | May 09 '24 | Sale | 179.58 | 3,260 | 585,424 | 11,833 | May 13 02:53 PM | | SENGSTACK GREGG C | Director | May 02 '24 | Option Exercise | 46.55 | 6,000 | 279,300 | 23,450 | May 06 11:36 AM |
|
|
|
 |
| Market Cap | 2.05B | EPS (ttm) | 1.35 |
| P/E | 19.14 | EPS this Y | -3.54% |
| Forward P/E | 15.75 | EPS next Y | 11.74% |
| PEG | 1.97 | EPS past 5Y | -9.66% |
| P/S | 1.00 | EPS next 5Y | 9.70% |
| P/B | 1.60 | EPS Q/Q | -39.53% |
| Dividend | 3.10% | Sales Q/Q | -3.78% |
| Insider Own | 4.36% | Inst Own | 103.67% |
| Insider Trans | -0.10% | Inst Trans | 0.80% |
| Short Float | 5.24% | Earnings | May 08/b |
| Analyst Recom | 3.44 | Target Price | 25.50 |
| Avg Volume | 639.32K | 52W Range | 22.08 - 30.60 |
|
|
|
|
Kennametal, Inc. engages in the manufacturing of tungsten carbide metal cutting tooling. It operates through the Metal Cutting and Infrastructure segments. The Metal Cutting segment develops and manufactures tooling and metal cutting products and services. The Infrastructure segment produces engineered tungsten carbide and ceramic components, earth-cutting tools, and advanced metallurgical powders. The company was founded by Philip M. McKenna in 1938 and is headquartered in Pittsburgh, PA. |
| Insider Trading |
Relationship |
Date |
Transaction |
Cost |
#Shares |
Value ($) |
#Shares Total |
SEC Form 4 |
| Chowbey Sanjay | Vice President | May 10 '24 | Buy | 26.00 | 10,000 | 260,000 | 44,270 | May 13 02:45 PM | | Keating Michelle R | Vice President | May 09 '24 | Sale | 26.09 | 12,000 | 313,140 | 33,008 | May 13 02:50 PM | | Witt John Wayne | Vice President | Mar 07 '24 | Sale | 25.55 | 1,000 | 25,550 | 1,343 | Mar 08 07:10 AM | | Sternlieb Paul | Director | Jan 15 '24 | Option Exercise | 24.35 | 884 | 21,525 | 884 | Jan 16 02:17 PM | | Witt John Wayne | Vice President | Dec 04 '23 | Sale | 24.24 | 450 | 10,908 | 2,343 | Dec 05 11:57 AM |
|
|
| |
 |
| Market Cap | 2.98B | EPS (ttm) | 2.72 |
| P/E | 12.28 | EPS this Y | -2.51% |
| Forward P/E | 10.15 | EPS next Y | 14.33% |
| PEG | 1.53 | EPS past 5Y | 2.69% |
| P/S | 2.69 | EPS next 5Y | 8.00% |
| P/B | 0.99 | EPS Q/Q | 42.49% |
| Dividend | 3.77% | Sales Q/Q | 26.98% |
| Insider Own | 1.46% | Inst Own | 66.98% |
| Insider Trans | 0.37% | Inst Trans | 0.37% |
| Short Float | 2.35% | Earnings | Apr 23/b |
| Analyst Recom | 1.60 | Target Price | 38.40 |
| Avg Volume | 439.50K | 52W Range | 23.32 - 37.86 |
|
|
|
|
Atlantic Union Bankshares Corp. is a bank holding company, which engages in the provision of financial services. It specializes in offering community banking services. Its services include checking, savings, lending, credit cards, online and mobile banking, treasury management, business eBanking, and wealth management. The company was founded in July 1993 and is headquartered in Glen Allen, VA. |
| Insider Trading |
Relationship |
Date |
Transaction |
Cost |
#Shares |
Value ($) |
#Shares Total |
SEC Form 4 |
| Miller Clare | EVP & CHRO | May 10 '24 | Sale | 34.12 | 2,188 | 74,655 | 9,090 | May 13 02:43 PM | | KIMBLE DONALD R | Director | Mar 08 '24 | Buy | 35.13 | 7,000 | 245,910 | 7,582 | Mar 11 03:12 PM |
|
|
|
 |
| Market Cap | 100.94M | EPS (ttm) | 2.33 |
| P/E | 16.91 | EPS this Y | - |
| Forward P/E | - | EPS next Y | - |
| PEG | - | EPS past 5Y | 0.87% |
| P/S | 1.76 | EPS next 5Y | - |
| P/B | 1.00 | EPS Q/Q | -63.73% |
| Dividend | 1.93% | Sales Q/Q | 13.71% |
| Insider Own | 16.78% | Inst Own | 42.52% |
| Insider Trans | 2.71% | Inst Trans | -0.64% |
| Short Float | 0.08% | Earnings | - |
| Analyst Recom | - | Target Price | - |
| Avg Volume | 0.73K | 52W Range | 33.27 - 41.41 |
|
|
|
|
Sound Financial Bancorp, Inc. is a bank holding company, which engages in the provision of traditional banking and other financial services. It involves attracting retail and commercial deposits from the general public and local governments and investing those funds, along with borrowed funds, in loans secured by first and second mortgages on one- to four-family residences, commercial and multifamily real estate, construction and land, consumer, and commercial business loans. The company was founded in 2008 and is headquartered in Seattle, WA. |
| Insider Trading |
Relationship |
Date |
Transaction |
Cost |
#Shares |
Value ($) |
#Shares Total |
SEC Form 4 |
| Haddad David S Jr | Director | May 09 '24 | Sale | 39.70 | 236 | 9,368 | 4,492 | May 13 02:38 PM | | STILWELL JOSEPH | 10% Owner | Feb 01 '24 | Buy | 39.00 | 1,303 | 50,817 | 216,625 | Feb 02 03:22 PM | | STILWELL JOSEPH | 10% Owner | Jan 03 '24 | Buy | 39.43 | 500 | 19,717 | 215,322 | Jan 04 03:11 PM | | Carney Robert F | Director | Jan 02 '24 | Option Exercise | 16.80 | 925 | 15,540 | 7,609 | Jan 03 02:59 PM | | STILWELL JOSEPH | 10% Owner | Jan 02 '24 | Buy | 39.00 | 238 | 9,282 | 214,822 | Jan 03 02:23 PM |
|
|
| |
 |
| Market Cap | 1.64B | EPS (ttm) | -0.02 |
| P/E | - | EPS this Y | -41.50% |
| Forward P/E | 15.75 | EPS next Y | 44.91% |
| PEG | - | EPS past 5Y | - |
| P/S | 1.62 | EPS next 5Y | 15.00% |
| P/B | 2.32 | EPS Q/Q | -60.55% |
| Dividend | - | Sales Q/Q | -0.73% |
| Insider Own | 1.43% | Inst Own | 95.83% |
| Insider Trans | -1.44% | Inst Trans | -1.60% |
| Short Float | 2.06% | Earnings | May 02/a |
| Analyst Recom | 2.00 | Target Price | 10.33 |
| Avg Volume | 1.99M | 52W Range | 7.10 - 11.65 |
|
|
|
|
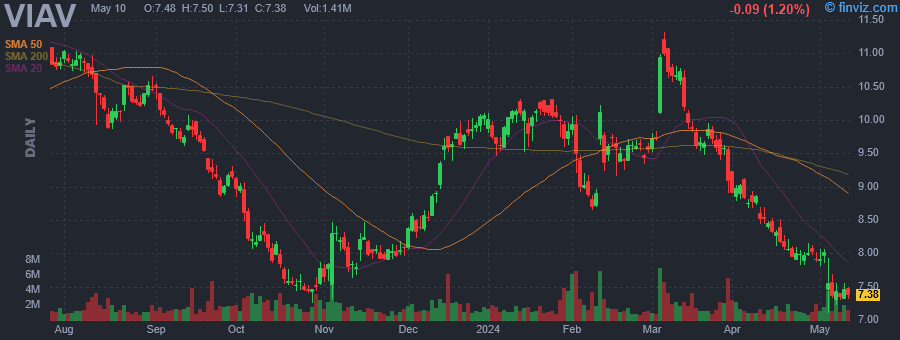
Viavi Solutions, Inc. engages in the provision of network test, monitoring, and assurance solutions for communications service providers, enterprises, network equipment manufacturers, government and avionics. It operates through the following segments: Network Enablement, Service Enablement, and Optical Security and Performance. The Network Enablement segment offers an integrated portfolio of testing solutions that access the network to perform build-out and maintenance tasks. The Service Enablement segment covers solutions and services primarily for communication service providers, and enterprises that deliver and/or operate broadband and IP networks (fixed and mobile) supporting voice, video, and data services as well as a wide range of applications. The Optical Security and Performance segment leverages its core optical coating technologies and volume manufacturing capability to design, manufacture, and sell products targeting anti-counterfeiting, consumer and industrial, government, healthcare, and other markets. The company was founded in 1979 and is headquartered in Chandler, AZ. |
| Insider Trading |
Relationship |
Date |
Transaction |
Cost |
#Shares |
Value ($) |
#Shares Total |
SEC Form 4 |
| McNab Paul | EVP, Chief Mktg & Stgy Officer | May 10 '24 | Sale | 7.35 | 4,762 | 35,001 | 49,777 | May 13 02:23 PM | | McNab Paul | EVP, Chief Mktg & Stgy Officer | May 07 '24 | Sale | 7.34 | 3,401 | 24,963 | 54,539 | May 08 11:47 AM | | McNab Paul | EVP, Chief Mktg & Stgy Officer | Mar 12 '24 | Sale | 10.62 | 15,004 | 159,342 | 57,940 | Mar 13 02:00 PM | | Siebert Kevin Christopher | SVP Gen. Counsel & Secretary | Mar 11 '24 | Sale | 10.70 | 13,967 | 149,447 | 47,097 | Mar 12 03:05 PM | | KHAYKIN OLEG | President & CEO | Feb 14 '24 | Option Exercise | 5.95 | 1,180,257 | 7,022,529 | 2,329,612 | Feb 15 11:56 AM |
|
|
|
 |
| Market Cap | 224.40M | EPS (ttm) | 1.64 |
| P/E | 16.79 | EPS this Y | 5.42% |
| Forward P/E | 7.53 | EPS next Y | 108.57% |
| PEG | 2.10 | EPS past 5Y | -10.42% |
| P/S | 1.13 | EPS next 5Y | 8.00% |
| P/B | 0.71 | EPS Q/Q | -7.25% |
| Dividend | - | Sales Q/Q | 26.39% |
| Insider Own | 6.73% | Inst Own | 79.01% |
| Insider Trans | -2.24% | Inst Trans | -6.10% |
| Short Float | 1.48% | Earnings | Apr 18/a |
| Analyst Recom | 2.00 | Target Price | 34.00 |
| Avg Volume | 17.64K | 52W Range | 21.66 - 39.36 |
|
|
|
|
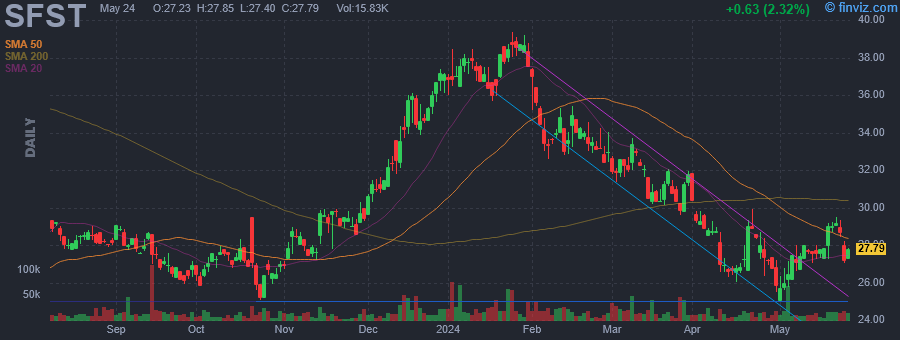
Southern First Bancshares, Inc. is a bank holding company, which engages in the business of accepting demand deposits and savings deposits insured by the Federal Deposit Insurance Corporation (FDIC), and the provision of commercial, consumer, and mortgage loans to the general public. The company was founded in March 1999 and is headquartered in Greenville, SC. |
| Insider Trading |
Relationship |
Date |
Transaction |
Cost |
#Shares |
Value ($) |
#Shares Total |
SEC Form 4 |
| CUBBAGE LEIGHTON M | Director | May 10 '24 | Sale | 27.61 | 1,717 | 47,407 | 64,435 | May 13 02:10 PM | | CUBBAGE LEIGHTON M | Director | May 09 '24 | Sale | 27.50 | 780 | 21,450 | 66,152 | May 13 02:10 PM | | ELLEFSON ANNE S | Director | Apr 24 '24 | Sale | 28.00 | 600 | 16,800 | 6,712 | Apr 25 03:14 PM | | SEAVER R ARTHUR JR | CEO | Mar 21 '24 | Sale | 31.25 | 996 | 31,125 | 83,470 | Mar 21 04:41 PM | | SEAVER R ARTHUR JR | CEO | Mar 20 '24 | Sale | 31.21 | 4,267 | 133,172 | 84,466 | Mar 21 04:41 PM |
|
|
|
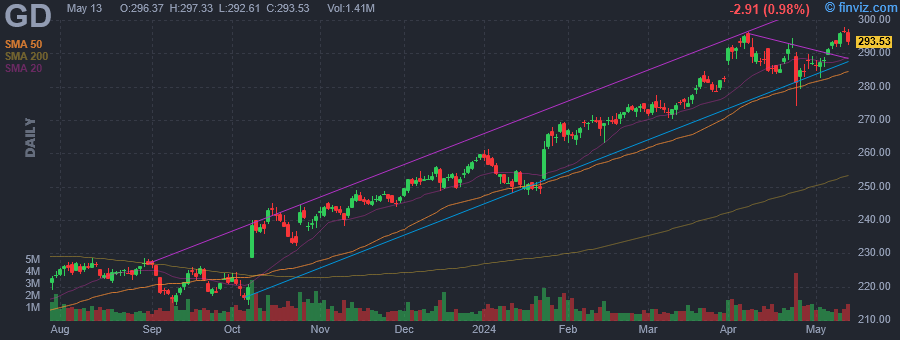 |
| Market Cap | 80.53B | EPS (ttm) | 12.27 |
| P/E | 23.91 | EPS this Y | 21.18% |
| Forward P/E | 17.97 | EPS next Y | 12.16% |
| PEG | 1.83 | EPS past 5Y | 1.46% |
| P/S | 1.87 | EPS next 5Y | 13.04% |
| P/B | 3.75 | EPS Q/Q | 9.31% |
| Dividend | 1.90% | Sales Q/Q | 8.60% |
| Insider Own | 0.63% | Inst Own | 88.37% |
| Insider Trans | -9.75% | Inst Trans | -0.93% |
| Short Float | 0.74% | Earnings | Apr 24/b |
| Analyst Recom | 1.62 | Target Price | 313.86 |
| Avg Volume | 990.94K | 52W Range | 202.35 - 297.88 |
|
|
|
|
General Dynamics Corp. is a global aerospace and defense company, which engages in design, engineering, and manufacturing to deliver solutions. It operates through the following business segments: Aerospace, Marine Systems, Combat Systems, and Technologies. The Aerospace segment includes the production of business jets, technology aircraft, repair, support and completion services. The Marine Systems segment involves the design and building of nuclear-powered submarines, surface combatant, and auxiliary ship design and construction. The Combat Systems segment focuses on manufacturing and integrating land combat solutions, wheeled and tracked combat vehicles, weapons systems and munitions. The Technologies segment consists of services, technologies, and products for electronic hardware with its software. The company was founded on February 21, 1952 and is headquartered in Reston, VA. |
| Insider Trading |
Relationship |
Date |
Transaction |
Cost |
#Shares |
Value ($) |
#Shares Total |
SEC Form 4 |
| Burns Mark Lagrand | Vice President | May 10 '24 | Sale | 296.58 | 6,016 | 1,784,225 | 76,221 | May 13 02:07 PM | | Burns Mark Lagrand | Vice President | May 09 '24 | Option Exercise | 191.71 | 31,590 | 6,056,119 | 107,811 | May 13 02:07 PM | | DE LEON RUDY F | Director | May 03 '24 | Option Exercise | 136.78 | 2,570 | 351,525 | 8,088 | May 07 11:05 AM | | DE LEON RUDY F | Director | May 03 '24 | Sale | 288.00 | 2,570 | 740,160 | 5,518 | May 07 11:05 AM | | Gilliland Marguerite Amy | Senior Vice President | May 02 '24 | Sale | 286.04 | 5,116 | 1,463,381 | 43,772 | May 03 04:30 PM |
|
|
|
