 |
| Market Cap | 247.28B | EPS (ttm) | 6.64 |
| P/E | 27.07 | EPS this Y | 7.20% |
| Forward P/E | 20.35 | EPS next Y | 8.23% |
| PEG | 3.78 | EPS past 5Y | -5.66% |
| P/S | 2.69 | EPS next 5Y | 7.16% |
| P/B | 12.98 | EPS Q/Q | 6.00% |
| Dividend | 2.96% | Sales Q/Q | 2.28% |
| Insider Own | 0.34% | Inst Own | 75.41% |
| Insider Trans | -1.54% | Inst Trans | -0.02% |
| Short Float | 1.14% | Earnings | Apr 23/b |
| Analyst Recom | 2.25 | Target Price | 187.83 |
| Avg Volume | 5.52M | 52W Range | 155.83 - 196.88 |
|
|
|
|
PepsiCo, Inc. engages in the manufacture, marketing, distribution, and sale of beverages, food, and snacks. It operates through the following business segments: Frito-Lay North America (FLNA), Quaker Foods North America (QFNA), PepsiCo Beverages North America (PBNA), Latin America (LatAm), Europe, Africa, Middle East, and South Asia (AMESA), and Asia Pacific, Australia and New Zealand, and China Region (APAC). The FLNA segment consists of branded convenient food businesses in the United States and Canada. The QFNA segment includes cereals, rice, and pasta under the Quaker, Pearl Milling Company, Quaker Chewy, Cap'n Crunch, Life, and Rice-A-Roni brands. The PBNA segment is composed of beverage concentrates, fountain syrups, and finished goods under various beverage brands such as Pepsi, Gatorade, Mountain Dew, Diet Pepsi, Aquafina, Diet Mountain Dew, Sierra Mist, and Mug. The LatAm segment covers beverage, food, and snack businesses in the Latin American region. The Europe segment offers beverage, food, and snack goods in Europe and Sub-Saharan Africa regions. The AMESA segment deals with all beverage and convenient food businesses in Africa, the Middle East, and South Asia. The APAC segment refers to all business operations in the Asia Pacific, Australia and New Zealand, and China region. The company was founded by Donald M. Kendall, Sr. and Herman W. Lay in 1965 and is headquartered in Purchase, NY. |
| Insider Trading |
Relationship |
Date |
Transaction |
Cost |
#Shares |
Value ($) |
#Shares Total |
SEC Form 4 |
| Flavell David | EVP, Gen Counsel & Corp Sec | May 10 '24 | Sale | 179.86 | 6,628 | 1,192,131 | 36,264 | May 14 04:04 PM | | Krishnan Ramkumar | CEO, PBNA | May 09 '24 | Sale | 178.00 | 5,620 | 1,000,360 | 53,953 | May 13 04:04 PM | | Krishnan Ramkumar | CEO, PBNA | Mar 11 '24 | Sale | 164.44 | 4,563 | 750,340 | 59,573 | Mar 13 04:21 PM | | Willemsen Eugene | CEO, AMESA & Intl Beverages | Feb 23 '24 | Sale | 169.74 | 7,700 | 1,306,999 | 16,715 | Feb 27 04:10 PM | | Johnston Hugh F | Vice Chairman, EVP & CFO | Nov 10 '23 | Sale | 166.65 | 48,388 | 8,064,067 | 96,627 | Nov 14 04:13 PM |
|
|
 |
 |
| Market Cap | 60.22B | EPS (ttm) | 8.09 |
| P/E | 44.65 | EPS this Y | 9.45% |
| Forward P/E | 25.62 | EPS next Y | 7.75% |
| PEG | 4.60 | EPS past 5Y | 12.07% |
| P/S | 5.91 | EPS next 5Y | 9.71% |
| P/B | 115.59 | EPS Q/Q | -114.56% |
| Dividend | 1.02% | Sales Q/Q | 10.04% |
| Insider Own | 0.42% | Inst Own | 85.90% |
| Insider Trans | -17.93% | Inst Trans | 0.36% |
| Short Float | 1.02% | Earnings | May 02/a |
| Analyst Recom | 1.93 | Target Price | 372.13 |
| Avg Volume | 674.61K | 52W Range | 269.64 - 364.47 |
|
|
|
|
Motorola Solutions, Inc. engages in the provision of communication infrastructure, devices, accessories, software, and services. It operates through the following segments: Products and Systems Integration, and Software and Services. The Products and Systems Integration segment includes a portfolio of infrastructure, devices, accessories, and video security devices, and the implementation and integration of such systems, devices, and applications. The Software and Services segment includes the provision of public safety and enterprise Command Center Software, unified communications applications, and video software solutions. The company was founded on September 25, 1928 and is headquartered in Chicago, IL. |
| Insider Trading |
Relationship |
Date |
Transaction |
Cost |
#Shares |
Value ($) |
#Shares Total |
SEC Form 4 |
| MOLLOY JOHN P | EVP and COO | May 10 '24 | Option Exercise | 138.64 | 31,599 | 4,380,885 | 78,447 | May 14 04:04 PM | | WINKLER JASON J | EVP and CFO | May 10 '24 | Option Exercise | 120.47 | 6,191 | 745,823 | 21,569 | May 14 04:04 PM | | MOLLOY JOHN P | EVP and COO | May 10 '24 | Sale | 361.68 | 31,599 | 11,428,744 | 46,848 | May 14 04:04 PM | | WINKLER JASON J | EVP and CFO | May 10 '24 | Sale | 361.89 | 7,364 | 2,665,050 | 16,629 | May 14 04:04 PM | | NIEWIARA JAMES A | SVP, GENERAL COUNSEL | May 08 '24 | Option Exercise | 108.84 | 2,800 | 304,739 | 15,786 | May 09 04:14 PM |
|
|
|
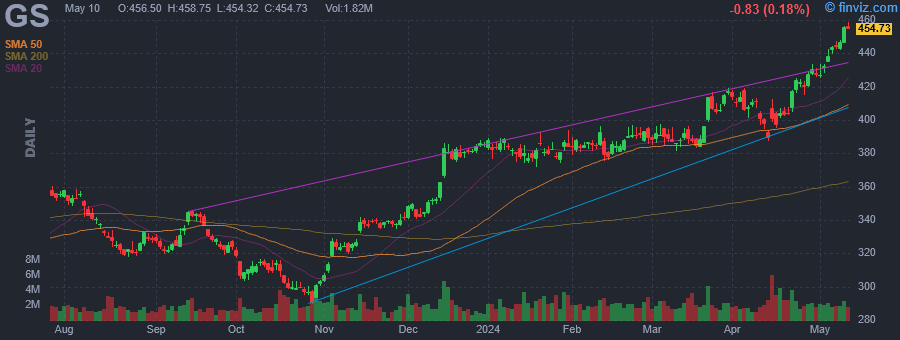 |
| Market Cap | 147.84B | EPS (ttm) | 25.61 |
| P/E | 17.90 | EPS this Y | 61.62% |
| Forward P/E | 11.24 | EPS next Y | 10.31% |
| PEG | 0.99 | EPS past 5Y | -1.98% |
| P/S | 1.27 | EPS next 5Y | 18.15% |
| P/B | 1.38 | EPS Q/Q | 31.77% |
| Dividend | 2.48% | Sales Q/Q | 26.08% |
| Insider Own | 0.51% | Inst Own | 73.52% |
| Insider Trans | -3.43% | Inst Trans | -0.22% |
| Short Float | 1.83% | Earnings | Apr 15/b |
| Analyst Recom | 1.77 | Target Price | 450.87 |
| Avg Volume | 2.32M | 52W Range | 289.36 - 458.75 |
|
|
|
|
Provides investment banking, securities and asset management services |
| Insider Trading |
Relationship |
Date |
Transaction |
Cost |
#Shares |
Value ($) |
#Shares Total |
SEC Form 4 |
| SOLOMON DAVID M | Chairman of the Board and CEO | May 10 '24 | Sale | 457.32 | 6,600 | 3,018,312 | 130,433 | May 14 04:03 PM | | VINIAR DAVID A | Director | Apr 29 '24 | Sale | 432.25 | 5,000 | 2,161,234 | 623,425 | May 01 04:24 PM | | COLEMAN DENIS P. | Chief Financial Officer | Feb 23 '24 | Sale | 394.43 | 12,680 | 5,001,372 | 29,417 | Feb 26 04:07 PM | | BERLINSKI PHILIP R. | Global Treasurer | Feb 22 '24 | Sale | 390.64 | 11,650 | 4,550,948 | 18,408 | Feb 26 04:09 PM | | Ruemmler Kathryn H. | Chief Legal Officer, GC | Jan 23 '24 | Sale | 379.81 | 7,277 | 2,763,877 | 6,501 | Jan 25 04:07 PM |
|
|
| |
 |
| Market Cap | 4.40B | EPS (ttm) | 2.12 |
| P/E | 19.96 | EPS this Y | 9.70% |
| Forward P/E | 9.46 | EPS next Y | 12.61% |
| PEG | 1.17 | EPS past 5Y | -1.62% |
| P/S | 1.05 | EPS next 5Y | 17.10% |
| P/B | 2.22 | EPS Q/Q | -105.95% |
| Dividend | - | Sales Q/Q | 23.77% |
| Insider Own | 30.47% | Inst Own | 73.65% |
| Insider Trans | -0.48% | Inst Trans | -2.56% |
| Short Float | 6.73% | Earnings | May 09/b |
| Analyst Recom | 1.43 | Target Price | 57.29 |
| Avg Volume | 721.74K | 52W Range | 33.13 - 49.02 |
|
|
|
|
Hilton Grand Vacations, Inc. is a global timeshare company, which engages in developing, marketing, selling, managing, and operating timeshare resorts, timeshare plans, and ancillary reservation services, primarily under the Hilton Grand Vacations brand. It operates through the Real Estate Sales and Financing and Resort Operations and Club Management segments. The Real Estate Sales and Financing segment refers to the sale of vacation ownership intervals on behalf of third-party developers using the Hilton Grand Vacations brand in exchange for sales, marketing and brand fees, and financing solutions. The Resort Operations and Club Management segment manages the club, receives activation fees, annual dues, and transaction fees from member exchanges for other vacation products. The company was founded in 1992 and is headquartered in Orlando, FL. |
| Insider Trading |
Relationship |
Date |
Transaction |
Cost |
#Shares |
Value ($) |
#Shares Total |
SEC Form 4 |
| Johnson David William | Director | May 13 '24 | Sale | 42.19 | 23,000 | 970,420 | 52,355 | May 14 04:03 PM | | Brizi Jorge Pablo | See Remarks | Mar 28 '24 | Sale | 47.00 | 28,000 | 1,315,915 | 51,855 | Apr 01 04:34 PM | | Corbin Charles R. Jr. | See Remarks | Mar 12 '24 | Sale | 45.49 | 23,000 | 1,046,270 | 140,618 | Mar 13 07:40 PM | | Wang Mark D | See Remarks | Mar 07 '24 | Option Exercise | 26.17 | 46,388 | 1,213,974 | 776,295 | Mar 08 04:10 PM | | Wang Mark D | See Remarks | Mar 07 '24 | Sale | 45.59 | 46,388 | 2,114,975 | 729,907 | Mar 08 04:10 PM |
|
|
|
 |
| Market Cap | 23.06B | EPS (ttm) | 5.35 |
| P/E | 14.31 | EPS this Y | 3.06% |
| Forward P/E | 8.74 | EPS next Y | 11.00% |
| PEG | 2.04 | EPS past 5Y | -2.67% |
| P/S | 1.23 | EPS next 5Y | 7.00% |
| P/B | 1.05 | EPS Q/Q | -10.09% |
| Dividend | 3.76% | Sales Q/Q | 23.49% |
| Insider Own | 0.49% | Inst Own | 91.08% |
| Insider Trans | -1.74% | Inst Trans | -0.65% |
| Short Float | 1.03% | Earnings | Apr 12/b |
| Analyst Recom | 2.53 | Target Price | 86.90 |
| Avg Volume | 2.39M | 52W Range | 62.78 - 79.90 |
|
|
|
|
State Street Corp. engages in the provision of financial services to institutional investors. It operates through the Commercial and Financial Loans, and Commercial Real Estate Loans segments. The company was founded in 1792 and is headquartered in Boston, MA. |
| Insider Trading |
Relationship |
Date |
Transaction |
Cost |
#Shares |
Value ($) |
#Shares Total |
SEC Form 4 |
| AMBROSIUS JOERG | Executive Vice President | May 10 '24 | Sale | 76.74 | 4,000 | 306,960 | 48,397 | May 14 04:02 PM | | Bisegna Anthony | Executive Vice President | Mar 01 '24 | Sale | 73.64 | 4,258 | 313,559 | 23,328 | Mar 04 06:27 PM | | Aboaf Eric W. | Vice Chairman and CFO | Feb 29 '24 | Sale | 73.90 | 12,000 | 886,800 | 149,063 | Mar 04 06:27 PM | | Milrod Donna M | Executive Vice President | Feb 22 '24 | Sale | 72.33 | 3,200 | 231,456 | 35,159 | Feb 26 04:05 PM | | Bisegna Anthony | Executive Vice President | Feb 16 '24 | Sale | 73.00 | 2,606 | 190,238 | 17,737 | Feb 20 06:42 PM |
|
|
| |
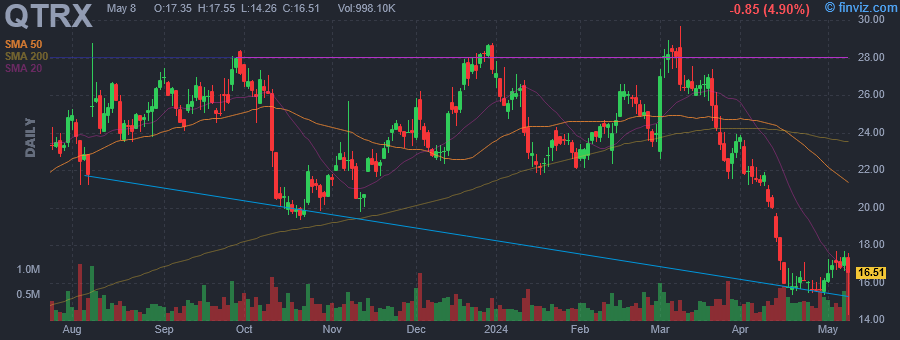 |
| Market Cap | 643.70M | EPS (ttm) | -0.96 |
| P/E | - | EPS this Y | -10.57% |
| Forward P/E | - | EPS next Y | 11.06% |
| PEG | - | EPS past 5Y | 9.72% |
| P/S | 5.11 | EPS next 5Y | - |
| P/B | 1.89 | EPS Q/Q | -61.59% |
| Dividend | - | Sales Q/Q | 12.69% |
| Insider Own | 9.51% | Inst Own | 84.07% |
| Insider Trans | -0.14% | Inst Trans | -7.34% |
| Short Float | 3.85% | Earnings | May 07/a |
| Analyst Recom | 1.40 | Target Price | 28.40 |
| Avg Volume | 398.94K | 52W Range | 14.26 - 29.70 |
|
|
|
|
Quanterix Corp. engages in the development of ultra-sensitive digital immunoassay platform that advances precision health for life sciences research and diagnostics. Its products and services include Simoa Assay Kits, HD-X analyzer, SR-X Biomarker Detection System, SP-X Imaging and Analysis System, 2470 Arrayer, Simoa Accelerator Laboratory, Uman NF-Light, and Homebrew -Custom Assay Development. The company was founded by Nicholas J. Naclerio and David R. Walt in April 2007 and is headquartered in Billerica, MA. |
| Insider Trading |
Relationship |
Date |
Transaction |
Cost |
#Shares |
Value ($) |
#Shares Total |
SEC Form 4 |
| OLSON LAURIE J | Director | May 14 '24 | Sale | 16.98 | 1,500 | 25,470 | 13,738 | May 14 04:02 PM | | OLSON LAURIE J | Director | Apr 01 '24 | Option Exercise | 12.86 | 1,000 | 12,860 | 16,238 | Apr 02 04:00 PM | | OLSON LAURIE J | Director | Apr 01 '24 | Sale | 23.50 | 1,000 | 23,500 | 15,238 | Apr 02 04:00 PM | | OLSON LAURIE J | Director | Feb 14 '24 | Sale | 24.35 | 1,500 | 36,525 | 15,238 | Feb 15 05:52 PM | | OLSON LAURIE J | Director | Jan 02 '24 | Option Exercise | 12.86 | 1,000 | 12,860 | 17,738 | Jan 04 04:09 PM |
|
|
|
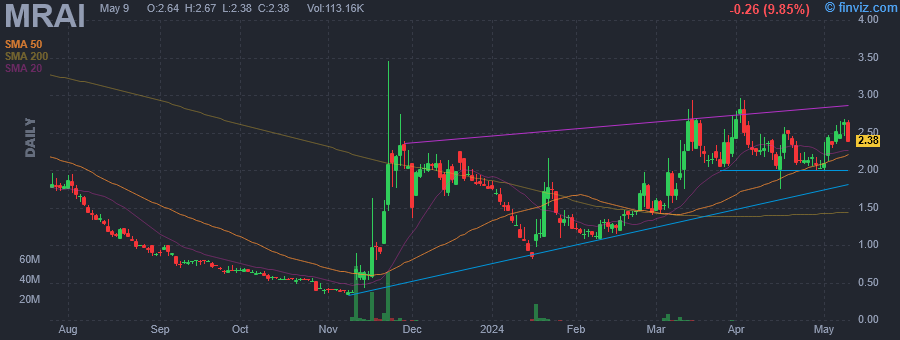 |
| Market Cap | 22.79M | EPS (ttm) | -3.19 |
| P/E | - | EPS this Y | 64.73% |
| Forward P/E | - | EPS next Y | 73.97% |
| PEG | - | EPS past 5Y | -87.80% |
| P/S | 0.65 | EPS next 5Y | - |
| P/B | - | EPS Q/Q | 72.45% |
| Dividend | - | Sales Q/Q | -23.65% |
| Insider Own | 50.15% | Inst Own | 2.41% |
| Insider Trans | 110.72% | Inst Trans | -10.68% |
| Short Float | 1.46% | Earnings | May 09/a |
| Analyst Recom | 1.00 | Target Price | 6.00 |
| Avg Volume | 419.52K | 52W Range | 0.33 - 3.46 |
|
|
|
|
Marpai, Inc. offers a SMART health plan services system that transforms health plan into a health empowerment tool. It provides health plan services system addresses the problems of healthcare. The firm uses deep learning, artificial intelligence, to empower people to live better, stay strong and spend less on healthcare. Its SMART health plan services enables companies to provide better healthcare to employees and significantly reduce administration, reinsurance and care costs. The company was founded in January 2021 and is headquartered in Tampa, FL. |
| Insider Trading |
Relationship |
Date |
Transaction |
Cost |
#Shares |
Value ($) |
#Shares Total |
SEC Form 4 |
| Lamendola Damien | Chief Executive Officer | May 10 '24 | Buy | 2.49 | 10,000 | 24,899 | 210,000 | May 14 04:01 PM | | EITAN YARON | Director | May 10 '24 | Buy | 2.66 | 5,000 | 13,300 | 606,454 | May 14 04:01 PM | | Dendy Michael Charles | Director | May 10 '24 | Sale | 2.32 | 42,752 | 99,065 | 61,098 | May 14 04:01 PM | | Dendy Michael Charles | Director | May 10 '24 | Sale | 2.40 | 2,371 | 5,701 | 17,629 | May 14 04:01 PM | | Lamendola Damien | Chief Executive Officer | Mar 07 '24 | Buy | 1.65 | 910,000 | 1,501,500 | 2,861,306 | Mar 08 04:01 PM |
|
|
| |
 |
| Market Cap | 37.68M | EPS (ttm) | 0.25 |
| P/E | 5.02 | EPS this Y | - |
| Forward P/E | - | EPS next Y | - |
| PEG | - | EPS past 5Y | - |
| P/S | 1.80 | EPS next 5Y | - |
| P/B | 2.26 | EPS Q/Q | 1512.28% |
| Dividend | - | Sales Q/Q | -18.68% |
| Insider Own | 64.77% | Inst Own | 5.25% |
| Insider Trans | -0.20% | Inst Trans | -3.19% |
| Short Float | 0.17% | Earnings | May 14/b |
| Analyst Recom | 1.00 | Target Price | 1.75 |
| Avg Volume | 149.01K | 52W Range | 0.58 - 2.21 |
|
|
|
|
Superior Drilling Products, Inc. engages in the manufacture, repair, sale and rental of drilling tools for the oil and natural gas drilling industry. Its drilling solutions include the patented Drill-N-Ream well bore conditioning tool, Strider oscillation system technology, completion tools, V-Stream, DR Stringer, and PDC Bit Repair. The firm also produces and refurbishes polycrystalline diamond compact drill bits for oil field service firms. The company was founded by Annette Deuel Meier and Gilbert Troy Meier in 1993 and is headquartered in Vernal, UT. |
| Insider Trading |
Relationship |
Date |
Transaction |
Cost |
#Shares |
Value ($) |
#Shares Total |
SEC Form 4 |
| Eberwein Jeffrey E. | 10% Owner | May 14 '24 | Sale | 1.23 | 17,706 | 21,778 | 1,040,985 | May 14 03:32 PM | | Eberwein Jeffrey E. | 10% Owner | May 13 '24 | Sale | 1.25 | 16,618 | 20,772 | 1,058,691 | May 14 03:32 PM | | Eberwein Jeffrey E. | 10% Owner | May 10 '24 | Sale | 1.25 | 5,676 | 7,095 | 1,075,309 | May 14 03:32 PM | | Eberwein Jeffrey E. | 10% Owner | Aug 11 '23 | Sale | 1.34 | 5,262 | 7,051 | 1,983,027 | Aug 15 06:22 PM | | Eberwein Jeffrey E. | 10% Owner | Aug 11 '23 | Sale | 1.34 | 2,834 | 3,798 | 1,080,985 | Aug 15 06:22 PM |
|
|
|
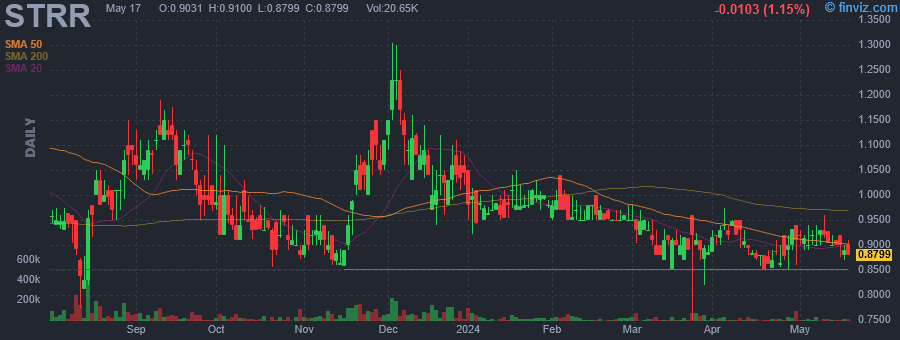 |
| Market Cap | 14.26M | EPS (ttm) | 1.47 |
| P/E | 0.61 | EPS this Y | -35.00% |
| Forward P/E | - | EPS next Y | 48.15% |
| PEG | 0.04 | EPS past 5Y | 39.31% |
| P/S | 0.24 | EPS next 5Y | 16.00% |
| P/B | 0.31 | EPS Q/Q | -14.27% |
| Dividend | - | Sales Q/Q | -56.10% |
| Insider Own | 31.33% | Inst Own | 3.83% |
| Insider Trans | 18.76% | Inst Trans | -5.80% |
| Short Float | 2.44% | Earnings | Mar 22/b |
| Analyst Recom | 1.00 | Target Price | 5.00 |
| Avg Volume | 23.91K | 52W Range | 0.75 - 1.59 |
|
|
|
|
Star Equity Holdings, Inc. is a holding company. It operates under the Construction and Investments segments. The Construction segment is involved in manufacturing modular housing units and providing other building components for commercial and residential real estate projects. The Investments segment focuses on managing and financing the company's real estate assets as well as its investment positions in private and public companies. The company was founded in 1997 and is headquartered in Old Greenwich, CT. |
| Insider Trading |
Relationship |
Date |
Transaction |
Cost |
#Shares |
Value ($) |
#Shares Total |
SEC Form 4 |
| Eberwein Jeffrey E. | 10% Owner | May 14 '24 | Sale | 1.23 | 17,706 | 21,778 | 1,040,985 | May 14 03:32 PM | | Eberwein Jeffrey E. | 10% Owner | May 13 '24 | Sale | 1.25 | 16,618 | 20,772 | 1,058,691 | May 14 03:32 PM | | Eberwein Jeffrey E. | 10% Owner | May 10 '24 | Sale | 1.25 | 5,676 | 7,095 | 1,075,309 | May 14 03:32 PM | | Star Equity Fund, LP | 10% Owner | May 08 '24 | Buy | 0.24 | 24,733 | 5,817 | 2,029,829 | May 08 05:08 PM | | Star Equity Fund, LP | 10% Owner | May 07 '24 | Buy | 0.20 | 800 | 161 | 2,005,096 | May 08 05:08 PM |
|
|
|
 |
| Market Cap | 647.94M | EPS (ttm) | 2.64 |
| P/E | 13.37 | EPS this Y | -14.80% |
| Forward P/E | 14.65 | EPS next Y | -6.95% |
| PEG | 2.67 | EPS past 5Y | 4.09% |
| P/S | 3.58 | EPS next 5Y | 5.00% |
| P/B | 1.28 | EPS Q/Q | -3.88% |
| Dividend | 3.29% | Sales Q/Q | 16.81% |
| Insider Own | 15.59% | Inst Own | 36.08% |
| Insider Trans | -0.04% | Inst Trans | -1.42% |
| Short Float | 0.93% | Earnings | Apr 23/a |
| Analyst Recom | 5.00 | Target Price | 34.00 |
| Avg Volume | 29.80K | 52W Range | 23.79 - 39.23 |
|
|
|
|
First Community Bancshares, Inc. operates as a financial holding company, which engages in the provision of banking products and services to individual and commercial customers. The firm offers demand deposit accounts, savings and money market accounts, certificates of deposit, individual retirement arrangements, commercial, consumer, and real estate mortgage loans, lines of credit, various credit card, debit card, automated teller machine card services, corporate and personal trust services, investment management services, and life, health, and property and casualty insurance products. It offers its services and products to individuals and businesses that includes industries such as education, government, health services, retail trade, construction, manufacturing, tourism, coal mining and gas extraction, and transportation. The company was founded in 1989 and is headquartered in Bluefield, VA. |
| Insider Trading |
Relationship |
Date |
Transaction |
Cost |
#Shares |
Value ($) |
#Shares Total |
SEC Form 4 |
| Brown David D | Chief Financial Officer | May 13 '24 | Sale | 35.25 | 1,017 | 35,849 | 14,026 | May 14 03:30 PM | | Brown David D | Chief Financial Officer | Sep 01 '23 | Buy | 31.45 | 100 | 3,145 | 1,650 | Sep 06 01:40 PM | | Brown David D | Chief Financial Officer | Aug 25 '23 | Sale | 31.32 | 1,000 | 31,320 | 15,043 | Aug 29 04:38 PM | | Price Harriet B | Director | Jun 02 '23 | Buy | 27.73 | 176 | 4,880 | 500 | Jun 02 01:02 PM |
|
|
|
