 |
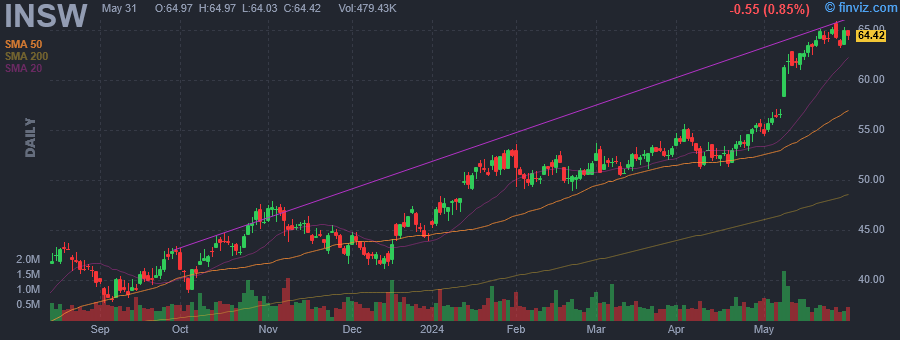
| Market Cap | 3.08B | EPS (ttm) | 10.70 |
| P/E | 5.83 | EPS this Y | -8.30% |
| Forward P/E | 7.31 | EPS next Y | -12.35% |
| PEG | - | EPS past 5Y | - |
| P/S | 2.91 | EPS next 5Y | -3.71% |
| P/B | 1.70 | EPS Q/Q | -15.85% |
| Dividend | 10.84% | Sales Q/Q | -4.43% |
| Insider Own | 30.92% | Inst Own | 65.80% |
| Insider Trans | -0.62% | Inst Trans | -12.99% |
| Short Float | 3.87% | Earnings | May 08/b |
| Analyst Recom | 1.00 | Target Price | 70.50 |
| Avg Volume | 571.68K | 52W Range | 30.99 - 62.92 |
|
|
|
|
International Seaways, Inc. engages in the transportation of crude oil and petroleum products. It operates through the following segments: Crude Tankers and Product Carriers. The Crude Tankers segment consists of a fleet of vessels that transport unrefined petroleum. The Product Carriers segment focuses on crude and refined petroleum products. The company was founded on December 6, 1999 and is headquartered in New York, NY. |
| Insider Trading |
Relationship |
Date |
Transaction |
Cost |
#Shares |
Value ($) |
#Shares Total |
SEC Form 4 |
| Oshodi Adewale | Vice President & Controller | May 10 '24 | Sale | 62.06 | 6,212 | 385,486 | 6,326 | May 13 05:34 PM | | Solon Derek G. | Senior Vice President | May 10 '24 | Sale | 62.92 | 1,500 | 94,380 | 48,887 | May 13 05:31 PM | | Nugent William F. | Senior Vice President | May 08 '24 | Option Exercise | 21.58 | 4,662 | 100,606 | 60,913 | May 10 04:31 PM | | Zabrocky Lois K | President & CEO | May 01 '24 | Sale | 54.88 | 1,000 | 54,884 | 159,475 | May 03 09:37 AM | | Pribor Jeffrey | SVP,Chief Financial Officer &T | May 01 '24 | Sale | 54.87 | 1,000 | 54,872 | 76,849 | May 03 09:39 AM |
|
|
 |
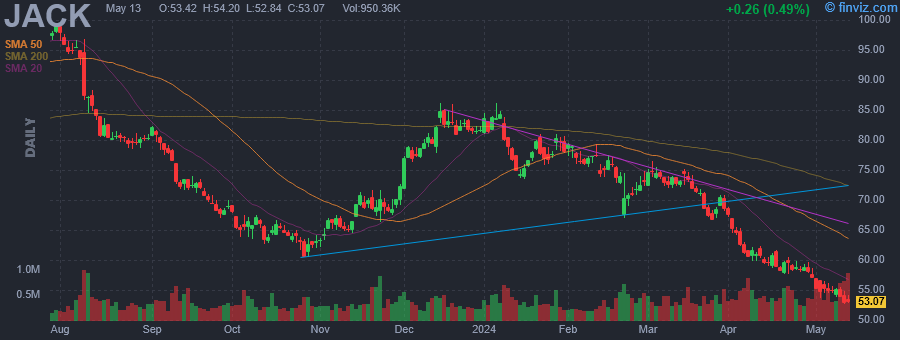 |
| Market Cap | 1.04B | EPS (ttm) | 5.69 |
| P/E | 9.34 | EPS this Y | 5.07% |
| Forward P/E | 7.45 | EPS next Y | 12.56% |
| PEG | 1.03 | EPS past 5Y | 14.89% |
| P/S | 0.63 | EPS next 5Y | 9.08% |
| P/B | - | EPS Q/Q | -23.92% |
| Dividend | 3.31% | Sales Q/Q | -7.51% |
| Insider Own | 2.30% | Inst Own | 104.78% |
| Insider Trans | -5.37% | Inst Trans | -2.17% |
| Short Float | 6.46% | Earnings | May 14/b |
| Analyst Recom | 2.37 | Target Price | 77.50 |
| Avg Volume | 486.07K | 52W Range | 52.63 - 99.56 |
|
|
|
|
Jack in the Box, Inc. engages in developing, operating, and franchising a chain of quick-service and fast-casual restaurants. It operates through the Jack in the Box and Del Taco segments. The Jack in the Box segment offers a selection of distinctive products including classic burgers and other product lines such as Buttery Jack Burgers. The Del Taco segment focuses on both Mexican and American favorites such as burritos and fries. The company was founded by Robert Oscar Peterson in 1951 and is headquartered in San Diego, CA. |
| Insider Trading |
Relationship |
Date |
Transaction |
Cost |
#Shares |
Value ($) |
#Shares Total |
SEC Form 4 |
| Piano Steven | SVP, CHIEF PEOPLE OFFICER | May 13 '24 | Sale | 53.42 | 148 | 7,906 | 9,112 | May 13 05:33 PM | | MURPHY MICHAEL W | Director | Mar 13 '24 | Sale | 72.58 | 1,332 | 96,677 | 71,035 | Mar 13 06:38 PM | | Ostrom Ryan Lee | EVP, Chief Mktng&Digtl Officer | Feb 16 '24 | Sale | 76.06 | 328 | 24,948 | 17,946 | Feb 16 06:10 PM | | HOOPER DAWN E | SVP, Controller | Feb 06 '24 | Sale | 76.53 | 223 | 17,066 | 6,149 | Feb 06 07:04 PM | | HARRIS DARIN S | DIRECTOR & CEO | Dec 21 '23 | Sale | 81.56 | 3,823 | 311,804 | 91,485 | Dec 21 06:35 PM |
|
|
|
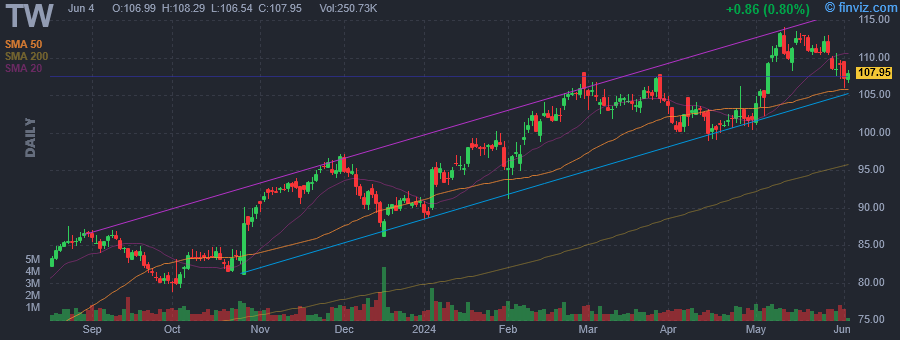 |
| Market Cap | 23.50B | EPS (ttm) | 1.88 |
| P/E | 58.57 | EPS this Y | 21.12% |
| Forward P/E | 35.46 | EPS next Y | 13.64% |
| PEG | 3.53 | EPS past 5Y | 8.96% |
| P/S | 16.58 | EPS next 5Y | 16.60% |
| P/B | 4.27 | EPS Q/Q | 40.65% |
| Dividend | 0.36% | Sales Q/Q | 24.14% |
| Insider Own | 45.92% | Inst Own | 54.79% |
| Insider Trans | -0.26% | Inst Trans | -4.11% |
| Short Float | 1.92% | Earnings | Apr 25/b |
| Analyst Recom | 1.76 | Target Price | 115.33 |
| Avg Volume | 845.62K | 52W Range | 64.83 - 114.07 |
|
|
|
|
Tradeweb Markets, Inc. engages in the operation of electronic marketplaces for the trading of products across the rates, credit, money markets, and equities asset classes. It also provides related pre-trade pricing and post-trade processing services. Its network comprises clients across the institutional, wholesale, and retail client sectors, including global asset managers, hedge funds, insurance companies, central banks, banks and dealers, proprietary trading firms and retail brokerage and financial advisory firms, as well as regional dealers. The company was founded by Lee Olesky in 1996 and is headquartered in New York, NY. |
| Insider Trading |
Relationship |
Date |
Transaction |
Cost |
#Shares |
Value ($) |
#Shares Total |
SEC Form 4 |
| Hult William | Chief Executive Officer | May 10 '24 | Option Exercise | 20.59 | 47,000 | 967,730 | 276,191 | May 13 05:32 PM | | Hult William | Chief Executive Officer | May 10 '24 | Sale | 111.63 | 47,000 | 5,246,638 | 229,191 | May 13 05:32 PM | | Hult William | Chief Executive Officer | May 09 '24 | Option Exercise | 20.59 | 51,000 | 1,050,090 | 280,191 | May 13 05:32 PM | | Hult William | Chief Executive Officer | May 09 '24 | Sale | 112.57 | 51,000 | 5,740,978 | 229,191 | May 13 05:32 PM | | Zucker Scott | Chief Admin. and Risk Officer | May 07 '24 | Sale | 110.56 | 2,517 | 278,269 | 28,833 | May 08 06:55 PM |
|
|
| |
 |
| Market Cap | 1.53B | EPS (ttm) | 5.32 |
| P/E | 16.04 | EPS this Y | -24.43% |
| Forward P/E | 15.39 | EPS next Y | 20.44% |
| PEG | 0.80 | EPS past 5Y | -13.18% |
| P/S | 12.95 | EPS next 5Y | 20.00% |
| P/B | 1.90 | EPS Q/Q | 103.66% |
| Dividend | - | Sales Q/Q | -29.56% |
| Insider Own | 2.21% | Inst Own | 90.13% |
| Insider Trans | -2.94% | Inst Trans | -0.32% |
| Short Float | 4.53% | Earnings | May 07/a |
| Analyst Recom | 1.20 | Target Price | 116.80 |
| Avg Volume | 187.75K | 52W Range | 49.24 - 94.57 |
|
|
|
|
Ligand Pharmaceuticals, Inc. is a biopharmaceutical company, which engages in the development and acquisition of technologies that help pharmaceutical companies to discover and develop medicines. Its products include evomela, IV voriconazole, duavee, viviant/conbriza, nexterone, and noxafil-IV. The company was founded by Ronald M. Evans in 1987 and is headquartered in Jupiter, FL. |
| Insider Trading |
Relationship |
Date |
Transaction |
Cost |
#Shares |
Value ($) |
#Shares Total |
SEC Form 4 |
| Reardon Andrew | Chief Legal Officer & | May 09 '24 | Option Exercise | 52.27 | 10,000 | 522,700 | 32,205 | May 13 05:32 PM | | Reardon Andrew | Chief Legal Officer & | May 09 '24 | Sale | 83.04 | 10,000 | 830,449 | 22,205 | May 13 05:32 PM | | Aryeh Jason | Director | Apr 30 '24 | Option Exercise | 52.30 | 2,406 | 125,834 | 76,828 | May 02 06:07 PM | | KOZARICH JOHN W | Director | Apr 24 '24 | Option Exercise | 39.35 | 2,893 | 113,840 | 42,523 | Apr 26 06:35 PM | | Davis Todd C | Chief Executive Officer | Mar 25 '24 | Option Exercise | 57.39 | 16,015 | 919,147 | 120,160 | Mar 27 05:47 PM |
|
|
|
 |
| Market Cap | 199.58M | EPS (ttm) | 0.24 |
| P/E | 46.34 | EPS this Y | 0.56% |
| Forward P/E | 9.91 | EPS next Y | 24.31% |
| PEG | - | EPS past 5Y | -20.93% |
| P/S | 2.31 | EPS next 5Y | - |
| P/B | 0.90 | EPS Q/Q | 106.49% |
| Dividend | - | Sales Q/Q | -37.74% |
| Insider Own | 19.87% | Inst Own | 43.51% |
| Insider Trans | -3.43% | Inst Trans | 2.31% |
| Short Float | 0.88% | Earnings | Apr 23/a |
| Analyst Recom | 2.00 | Target Price | 13.25 |
| Avg Volume | 18.73K | 52W Range | 8.49 - 15.39 |
|
|
|
|
FVCBankcorp, Inc. operates as a bank holding company, which engages in the provision of commercial banking services. It operates through the following segments: Commercial Real Estate, Commercial and Industrial, Commercial Construction, Consumer Residential, and Consumer Non-Residential. The Commercial Real Estate segment includes loans secured by both owners occupied and investor-owned commercial properties, including multi-family residential real estate. The Commercial and Industrial segment offers commercial loans to qualified businesses within its market area. The Commercial Construction segment focuses on a loan portfolio consisting of acquisition, development, and construction of commercial real estate, including multi-family properties. The Consumer Residential segment consists of home equity lines of credit (HELOCs) that originates in the market area. The Consumer Non-Residential segment is involved in installment loans made to individuals for personal, family and household purposes. The company was founded in November 2007 and is headquartered in Fairfax, VA. |
| Insider Trading |
Relationship |
Date |
Transaction |
Cost |
#Shares |
Value ($) |
#Shares Total |
SEC Form 4 |
| Wills Phillip R. III | Director | May 09 '24 | Sale | 11.22 | 10,170 | 114,102 | 58,884 | May 13 05:32 PM | | Nassy Michael G. | Chief Credit Officer | Apr 22 '24 | Option Exercise | 5.56 | 7,823 | 43,498 | 45,342 | Apr 24 04:31 PM | | Simmonds Sidney G | Director | Apr 18 '24 | Option Exercise | 5.56 | 24,413 | 135,744 | 56,537 | Apr 19 04:10 PM | | PIJOR DAVID W | Chairman/Chief Executive Offic | Mar 21 '24 | Sale | 11.99 | 1,273 | 15,268 | 441,010 | Mar 21 04:18 PM | | PIJOR DAVID W | Chairman/Chief Executive Offic | Mar 20 '24 | Sale | 11.85 | 3,727 | 44,177 | 442,283 | Mar 21 04:18 PM |
|
|
| |
 |
| Market Cap | 590.59M | EPS (ttm) | -1.12 |
| P/E | - | EPS this Y | 46.85% |
| Forward P/E | 14.84 | EPS next Y | 21.06% |
| PEG | - | EPS past 5Y | - |
| P/S | 0.93 | EPS next 5Y | 26.80% |
| P/B | 1.98 | EPS Q/Q | -382.41% |
| Dividend | - | Sales Q/Q | 24.08% |
| Insider Own | 11.69% | Inst Own | 67.09% |
| Insider Trans | -3.49% | Inst Trans | -4.12% |
| Short Float | 5.06% | Earnings | May 07/b |
| Analyst Recom | 2.00 | Target Price | 28.43 |
| Avg Volume | 404.08K | 52W Range | 9.34 - 25.02 |
|
|
|
|
Bandwidth, Inc. engages in the provision of cloud communications software services. The firm is also involved in delivering experiences through voice calling, text messaging, and emergency services applications. The company was founded by Henry Kaestner and David A. Morken in July 2000 and is headquartered in Raleigh, NC. |
| Insider Trading |
Relationship |
Date |
Transaction |
Cost |
#Shares |
Value ($) |
#Shares Total |
SEC Form 4 |
| Krupka Devin M | Controller, PAO | May 10 '24 | Sale | 21.61 | 2,500 | 54,012 | 7,262 | May 13 05:29 PM | | Krupka Devin M | Controller, PAO | Apr 15 '24 | Sale | 16.96 | 25 | 424 | 9,762 | Apr 16 04:26 PM | | Krupka Devin M | Controller, PAO | Apr 14 '24 | Option Exercise | 0.00 | 80 | 0 | 9,787 | Apr 16 04:26 PM | | Ross Kade | Chief Information Officer | Apr 01 '24 | Sale | 17.84 | 3,500 | 62,449 | 25,365 | Apr 03 04:16 PM | | Bartolo Anthony | Chief Operating Officer | Mar 22 '24 | Sale | 18.75 | 7,798 | 146,234 | 76,469 | Mar 25 05:38 PM |
|
|
|
 |
| Market Cap | 1.39B | EPS (ttm) | 1.69 |
| P/E | 39.10 | EPS this Y | -4.76% |
| Forward P/E | 13.24 | EPS next Y | 11.19% |
| PEG | 17.77 | EPS past 5Y | -6.27% |
| P/S | 2.68 | EPS next 5Y | 2.20% |
| P/B | 3.07 | EPS Q/Q | 1220.00% |
| Dividend | - | Sales Q/Q | 28.70% |
| Insider Own | 18.15% | Inst Own | 67.42% |
| Insider Trans | -9.56% | Inst Trans | 2.76% |
| Short Float | 1.34% | Earnings | May 10/b |
| Analyst Recom | 1.40 | Target Price | 81.60 |
| Avg Volume | 156.69K | 52W Range | 40.00 - 70.81 |
|
|
|
|
ANI Pharmaceuticals, Inc. is a bio-pharmaceutical company, which engages in the development, manufacture, and marketing of branded and generic prescription pharmaceuticals. It operates through the Generics, Established Brands, and Other, and Rare Disease segments. The Generics, Established Brands, and Other segment consists of contract manufactured products, development services, royalties, and other. The Rare Disease segment involves the operations related to Cortrophin Gel. The company was founded on August 29, 1996 and is headquartered in Baudette, MN. |
| Insider Trading |
Relationship |
Date |
Transaction |
Cost |
#Shares |
Value ($) |
#Shares Total |
SEC Form 4 |
| Cook Meredith | SR. VP, GENERAL COUNSEL & SEC. | May 13 '24 | Sale | 67.69 | 250 | 16,922 | 59,481 | May 13 05:25 PM | | Gassert Chad | SVP - CORP. DEV. & STRATEGY | May 01 '24 | Sale | 66.62 | 20,000 | 1,332,400 | 233,226 | May 03 05:48 PM | | Shanmugam Muthusamy | HEAD OF R&D, COO-NOVITIUM OPS | Apr 19 '24 | Sale | 65.17 | 16,809 | 1,095,443 | 782,620 | Apr 22 06:26 PM | | Shanmugam Muthusamy | HEAD OF R&D, COO-NOVITIUM OPS | Apr 18 '24 | Sale | 64.98 | 10,423 | 677,287 | 799,429 | Apr 22 06:26 PM | | Shanmugam Muthusamy | HEAD OF R&D, COO-NOVITIUM OPS | Apr 17 '24 | Sale | 65.40 | 9,520 | 622,608 | 809,852 | Apr 17 04:33 PM |
|
|
| |
 |
| Market Cap | 50.77B | EPS (ttm) | 20.20 |
| P/E | 7.69 | EPS this Y | -31.89% |
| Forward P/E | 10.64 | EPS next Y | -13.95% |
| PEG | - | EPS past 5Y | 27.90% |
| P/S | 0.36 | EPS next 5Y | -10.10% |
| P/B | 1.95 | EPS Q/Q | -54.71% |
| Dividend | 2.77% | Sales Q/Q | -12.82% |
| Insider Own | 0.51% | Inst Own | 81.79% |
| Insider Trans | -0.04% | Inst Trans | -1.61% |
| Short Float | 3.59% | Earnings | Apr 25/b |
| Analyst Recom | 1.85 | Target Price | 184.85 |
| Avg Volume | 3.10M | 52W Range | 105.66 - 184.79 |
|
|
|
|
Valero Energy Corp. engages in the manufacture and marketing of transportation fuels and other petrochemical products. It operates through the following business segments: Refining, Ethanol and Renewable Diesel. The Refining segment consists of refining operations, associated marketing activities, and logistics assets that support its refining operations. The Ethanol segment includes its ethanol operations, associated marketing activities, and logistics assets that support its ethanol operations. The Renewable Diesel covers the operations of Diamond Green Diesel Holdings LLC. The company was founded in 1980 and is headquartered in San Antonio, TX. |
| Insider Trading |
Relationship |
Date |
Transaction |
Cost |
#Shares |
Value ($) |
#Shares Total |
SEC Form 4 |
| Greene Kimberly S, | Director | May 09 '24 | Sale | 158.12 | 720 | 113,850 | 13,314 | May 13 05:25 PM | | Walsh Richard Joe | SVP, GC & Secretary | Jan 18 '24 | Option Exercise | 0.00 | 9,660 | 0 | 84,890 | Jan 22 05:45 PM | | Riggs R. Lane | CEO & President | Jan 18 '24 | Option Exercise | 0.00 | 36,239 | 0 | 303,647 | Jan 22 06:03 PM | | Gorder Joseph W | Director | Jan 18 '24 | Option Exercise | 0.00 | 78,441 | 0 | 656,313 | Jan 22 05:55 PM | | Simmons Gary K. | EVP & COO | Jan 18 '24 | Option Exercise | 0.00 | 17,149 | 0 | 196,823 | Jan 22 05:49 PM |
|
|
|
 |
| Market Cap | 9.84B | EPS (ttm) | 1.56 |
| P/E | 45.76 | EPS this Y | -41.36% |
| Forward P/E | 42.52 | EPS next Y | 42.73% |
| PEG | 6.77 | EPS past 5Y | - |
| P/S | 14.18 | EPS next 5Y | 6.76% |
| P/B | 14.41 | EPS Q/Q | -73.30% |
| Dividend | - | Sales Q/Q | -23.60% |
| Insider Own | 1.20% | Inst Own | 110.46% |
| Insider Trans | -14.47% | Inst Trans | -3.11% |
| Short Float | 9.50% | Earnings | Apr 29/a |
| Analyst Recom | 1.71 | Target Price | 80.97 |
| Avg Volume | 1.88M | 52W Range | 51.96 - 98.30 |
|
|
|
|
Lattice Semiconductor Corp. engages in the business of developing technologies that are monetized through differentiated programmable logic semiconductor products, system solutions, design services, and licenses. The firm also offers silicon-based and silicon-enabling products, evaluation boards, development hardware, and related intellectual property licensing, services, and sales. The company was founded in 1983 and is headquartered in Hillsboro, OR. |
| Insider Trading |
Relationship |
Date |
Transaction |
Cost |
#Shares |
Value ($) |
#Shares Total |
SEC Form 4 |
| Schwarting Elizabeth M | Director | May 10 '24 | Sale | 69.20 | 650 | 44,980 | 1,920 | May 13 05:25 PM | | Jensen Mark Edwin | Director | May 08 '24 | Option Exercise | 0.00 | 2,246 | 0 | 40,923 | May 09 06:55 PM | | Forsyth John | Director | May 08 '24 | Option Exercise | 0.00 | 1,621 | 0 | 1,621 | May 09 06:56 PM | | Dallara Que | Director | May 08 '24 | Option Exercise | 0.00 | 1,621 | 0 | 1,621 | May 09 06:57 PM | | Schwarting Elizabeth M | Director | May 08 '24 | Option Exercise | 0.00 | 2,246 | 0 | 2,570 | May 09 06:58 PM |
|
|
|
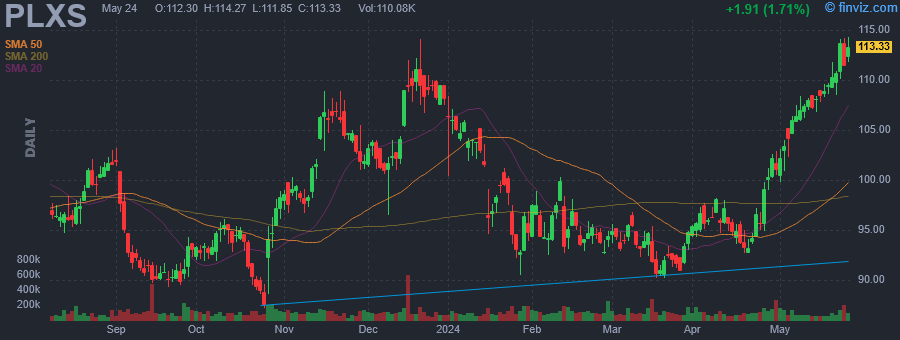 |
| Market Cap | 2.96B | EPS (ttm) | 3.63 |
| P/E | 29.77 | EPS this Y | -23.95% |
| Forward P/E | 17.21 | EPS next Y | 44.79% |
| PEG | 3.66 | EPS past 5Y | 66.69% |
| P/S | 0.74 | EPS next 5Y | 8.13% |
| P/B | 2.36 | EPS Q/Q | -59.88% |
| Dividend | - | Sales Q/Q | -9.70% |
| Insider Own | 2.09% | Inst Own | 96.46% |
| Insider Trans | -13.80% | Inst Trans | -1.38% |
| Short Float | 2.19% | Earnings | Apr 24/a |
| Analyst Recom | 2.17 | Target Price | 104.80 |
| Avg Volume | 119.18K | 52W Range | 85.59 - 114.06 |
|
|
|
|
Plexus Corp. engages in the provision of electronic manufacturing services. The company operates through the following geographical segments: Americas (AMER), Europe, Middle East, and Africa (EMEA), and Asia-Pacific (APAC). The company was founded by Peter Strandwitz, Shirani Ramin and John L. Nussbaum in 1979 and is headquartered in Neenah, WI. |
| Insider Trading |
Relationship |
Date |
Transaction |
Cost |
#Shares |
Value ($) |
#Shares Total |
SEC Form 4 |
| Frisch Steven J. | President & Chief Strategy Off | May 10 '24 | Sale | 107.55 | 4,005 | 430,753 | 49,308 | May 13 05:24 PM | | Frisch Steven J. | President & Chief Strategy Off | May 09 '24 | Sale | 106.81 | 2,800 | 299,078 | 53,313 | May 13 05:24 PM | | Frisch Steven J. | President & Chief Strategy Off | May 08 '24 | Sale | 108.19 | 700 | 75,736 | 56,113 | May 08 06:02 PM | | Frisch Steven J. | President & Chief Strategy Off | May 07 '24 | Sale | 106.53 | 2,600 | 276,970 | 56,813 | May 08 06:02 PM | | Jermain Patrick John | Exec. VP & CFO | May 07 '24 | Sale | 107.00 | 2,000 | 214,000 | 39,182 | May 09 04:24 PM |
|
|
|
