|
|
|

|
|||||
|
|
|
Newmont Corporation’s NEM shares have rallied 39.2% over the past six months, thanks to a spike in gold prices resulting from trade and geopolitical uncertainties. NEM stock has outperformed the Zacks Mining – Gold industry’s 38.5% rise and the S&P 500’s increase of 3.9%. Among its gold mining peers, Barrick Mining Corporation B, Agnico Eagle Mines Limited AEM and Kinross Gold Corporation KGC have gained 30.1%, 39.5% and 49.7%, respectively, over the same period.

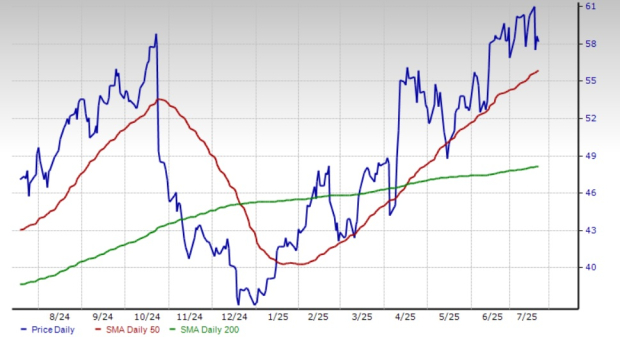
Technical indicators for NEM show bullish momentum. NEM eclipsed its 50-day simple moving average (SMA) on May 19, 2025. The NEM stock is also currently trading above its 200-day SMA, suggesting a long-term uptrend. The 50-day SMA is also reading higher than the 200-day SMA, following a golden crossover on April 16, 2025, indicating a bullish trend.
Let’s take a look at NEM’s fundamentals to better analyze how to play the stock.
Newmont continues to invest in growth projects in a calculated manner. The company is pursuing several projects, including Tanami Expansion 2 in Australia, the Ahafo North expansion in Ghana and Cadia Panel Caves in Australia. These projects should expand production capacity and extend mine life, driving revenues and profits.
The acquisition of Newcrest Mining Limited has also created an industry-leading portfolio with a multi-decade gold and copper production profile in the most favorable mining jurisdictions globally. The combination of Newmont and Newcrest is expected to deliver significant value for its shareholders and generate meaningful synergies. NEM has achieved $500 million in annual run-rate synergies, following the Newcrest buyout.
Newmont has also divested non-core businesses as it shifts its strategic focus to Tier 1 assets. NEM completed its non-core divestiture program in April 2025 with the sale of its Akyem operation in Ghana and its Porcupine operation in Canada. NEM recently executed agreements to sell its shares in Greatland Resources Limited and Discovery Silver Corp, for total cash proceeds of around $470 million after taxes and commissions. Following the sale of these shares, the company anticipates generating $3 billion in after-tax cash proceeds from its 2025 divestiture program. These funds will support Newmont’s capital allocation strategy, which focuses on reinforcing its balance sheet and delivering returns to its shareholders.
Newmont has a strong liquidity position and generates substantial cash flows, which allow it to fund its growth projects, meet short-term debt obligations and drive shareholder value. At the end of the first quarter of 2025, Newmont had liquidity of $8.8 billion, including cash and cash equivalents of around $4.7 billion. Its operating cash flow from continuing operations soared roughly 162% year over year to around $2 billion in the first quarter. NEM also generated a record free cash flow of $1.2 billion in the quarter. NEM delivered $1 billion to its shareholders through dividends and share repurchases and reduced debt by $1 billion since the beginning of 2025. Its long-term debt-to-capitalization is around 20%.
Newmont stands to benefit from the strength in gold prices, which should drive its profitability and cash flow generation. Gold prices have rallied roughly 27% this year, largely attributable to aggressive trade policies, including sweeping new import tariffs announced by President Donald Trump that have intensified global trade tensions and heightened investor anxiety. Also, central banks worldwide have been accumulating gold reserves, led by risks arising from Trump’s policies.
Prices of the yellow metal rocketed to a record high of $3,500 per ounce on April 22. While gold prices have fallen from their April 2025 highs, they remain favorable. The yellow metal is gaining from safe-haven demand triggered by trade and geopolitical uncertainties, and is currently hovering above the $3,300 per ounce level. Increased purchases by central banks, geopolitical tensions, and the threat of additional tariffs are factors expected to support bullion prices.
NEM offers a dividend yield of 1.7% at the current stock price. Its payout ratio is 24% (a ratio below 60% is a good indicator that the dividend will be sustainable). Backed by strong cash flows and sound financial health, the company's dividend is perceived as safe and reliable.
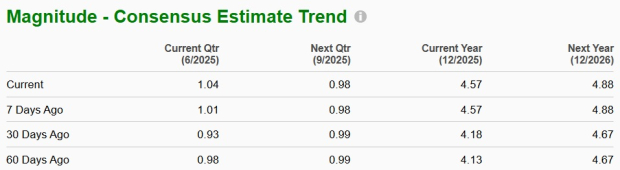
Newmont’s earnings estimates for 2025 have been going up over the past 60 days. The Zacks Consensus Estimate for second-quarter 2025 has also been revised higher over the same time frame.
The Zacks Consensus Estimate for 2025 earnings is currently pegged at $4.57, suggesting year-over-year growth of 31.3%. Earnings are expected to register roughly 44.4% growth in the second quarter.
(Find the latest EPS estimates and surprises on Zacks Earnings Calendar.)
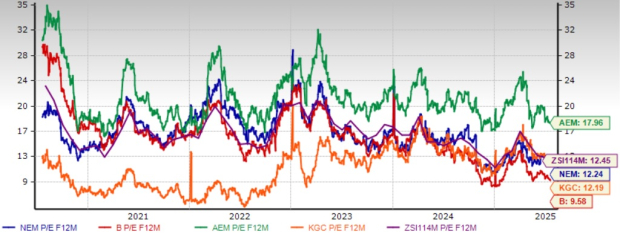
Newmont is currently trading at a forward price/earnings of 12.24X, a roughly 1.7% discount when stacked up with the industry’s average of 12.45X. NEM is trading at a premium to Barrick and Kinross Gold and a discount to Agnico Eagle. Both Newmont and Barrick currently have a Value Score of A. Kinross Gold has a Value Score of B, while Agnico Eagle has a Value Score of C.
Newmont presents a compelling investment case, backed by a robust portfolio of growth projects, the strong performance of its Tier 1 assets, and solid financial health. The asset streamlining rooted in Newmont’s objective to concentrate capital on high-return, long-life assets also underpins its long-term sustainability. Other positives include rising earnings estimates and a healthy growth trajectory. Higher realized gold prices should boost NEM’s profitability and drive cash flow generation. With a positive earnings outlook, Newmont looks poised to deliver attractive returns to its investors, making this Zacks Rank #2 (Buy) stock a prudent choice to bet on for those looking to capitalize on still-favorable gold market conditions.
You can see the complete list of today’s Zacks #1 Rank (Strong Buy) stocks here.
Want the latest recommendations from Zacks Investment Research? Today, you can download 7 Best Stocks for the Next 30 Days. Click to get this free report
This article originally published on Zacks Investment Research (zacks.com).
| 1 hour | |
| 4 hours | |
| 6 hours | |
| 9 hours | |
| 9 hours | |
| 9 hours | |
| 9 hours | |
| 11 hours | |
| Feb-26 | |
| Feb-26 | |
| Feb-26 | |
| Feb-26 | |
| Feb-25 | |
| Feb-25 | |
| Feb-25 |
Join thousands of traders who make more informed decisions with our premium features. Real-time quotes, advanced visualizations, backtesting, and much more.
Learn more about FINVIZ*Elite