|
|
|

|
|||||
|
|
|
Costco Wholesale Corporation’s COST long-term profile is defined by its disciplined global expansion strategy, moving beyond the domestic market to tap into high-potential international regions. COST currently operates 908 warehouses worldwide, with a significant global presence spanning 109 in Canada, 41 in Mexico, 37 in Japan, 29 in the United Kingdom, and notable growth in countries such as Korea (20), Australia (15), Taiwan (14) and China (7). Costco plans to open 27 new warehouses (24 net new) in fiscal 2025, bringing its global count to 914.
This international push is making a substantial contribution to Costco’s top line. In the third quarter, the Other International and Canada segments reported adjusted comparable sales growth of 8.5% and 7.8%, respectively. While foreign exchange fluctuations created a minor 1.2% headwind, Costco continues to leverage its global scale and operational discipline to strategically manage supply-chain dynamics.
Beyond sales figures, global expansion is playing a key role in enhancing Costco’s operational efficiency. The company is localizing supply chains for its Kirkland Signature brand to better serve regional markets. For example, sourcing Kirkland Signature Ultra Clean Laundry products directly from Asia for APAC warehouses has resulted in a 40% reduction in member prices within the region. This localization strategy not only mitigates tariff-related costs but also strengthens Costco’s ability to deliver member value through competitive pricing.
Costco’s global expansion is reshaping it into a more resilient, efficient and member-focused retailer. By blending regional relevance, Costco is driving higher volumes, stronger renewal rates and greater supply-chain agility.
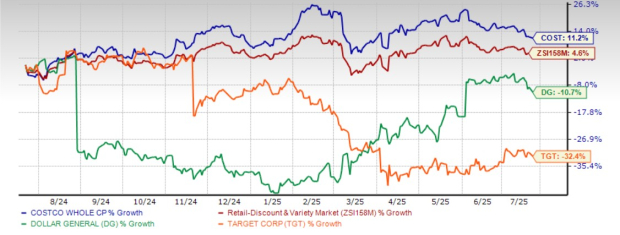
Costco stock has been a standout performer, with shares rallying 11.2% in the past year, outpacing the industry’s growth of 4.6%. The company has also comfortably outperformed key peers, such as Target Corporation TGT and Dollar General Corporation DG. During the same period, Target shares have tumbled 32.4%, while Dollar General has fallen 10.7%.
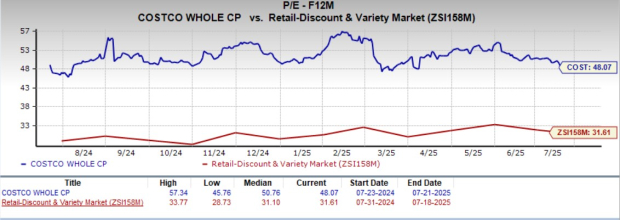
From a valuation standpoint, Costco's forward 12-month price-to-earnings ratio stands at 48.07, higher than the industry’s ratio of 31.61. COST carries a Value Score of D.
Costco is trading at a premium to Dollar General (with a forward 12-month P/E ratio of 17.79), and Target (12.99).
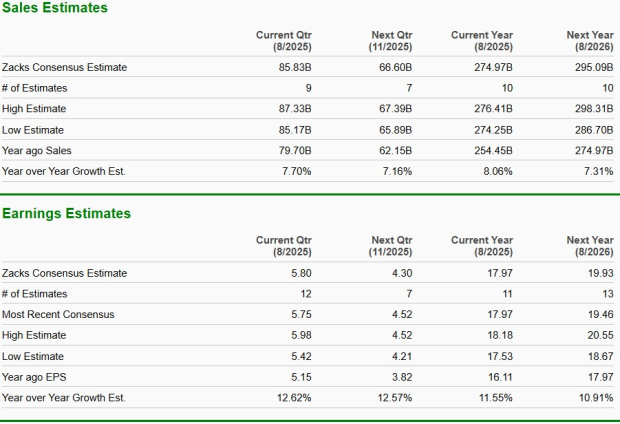
The Zacks Consensus Estimate for Costco’s current financial-year sales and earnings per share implies year-over-year growth of 8.1% and 11.6%, respectively.
Costco currently carries a Zacks Rank #3 (Hold). You can see the complete list of today’s Zacks #1 Rank (Strong Buy) stocks here.
Want the latest recommendations from Zacks Investment Research? Today, you can download 7 Best Stocks for the Next 30 Days. Click to get this free report
This article originally published on Zacks Investment Research (zacks.com).
| Feb-15 | |
| Feb-15 | |
| Feb-14 | |
| Feb-14 | |
| Feb-14 | |
| Feb-14 | |
| Feb-14 | |
| Feb-13 | |
| Feb-13 | |
| Feb-13 | |
| Feb-13 | |
| Feb-13 | |
| Feb-13 | |
| Feb-13 | |
| Feb-13 |
Join thousands of traders who make more informed decisions with our premium features. Real-time quotes, advanced visualizations, backtesting, and much more.
Learn more about FINVIZ*Elite