|
|
|

|
|||||

|
|
“Even as momentum since the June breakout has disappeared, there is not widespread technical damage that might cause an investor to reassess…The market clearly didn’t like the prospect of tariffs in April. With the tariff deadline now done and dusted as of Friday, we will find out soon enough if it was tariffs alone that investors didn’t like, or the higher introductory tariff rates that the President threatened in April that spooked investors.”
-Monday Morning Outlook, August 4, 2025
“For what it’s worth, though, we’re entering a perilous stretch. August and September combined is the only two-month period with negative returns for both the S&P 500 and global stocks over many decades. Post-election years have been especially lousy, according to Carson Investment Research… The U.S. market’s cyclically adjusted price-to-earnings ratio is higher than it has been 98% of the time and approaching its tech-bubble peak… Another risk factor that’s concerning: a rapid runup in margin debt, or borrowed money used to buy stocks. These debts aren't at worrying levels compared to the total value of equities, but the pace of increase is alarming.”
-The Wall Street Journal, August 8, 2025
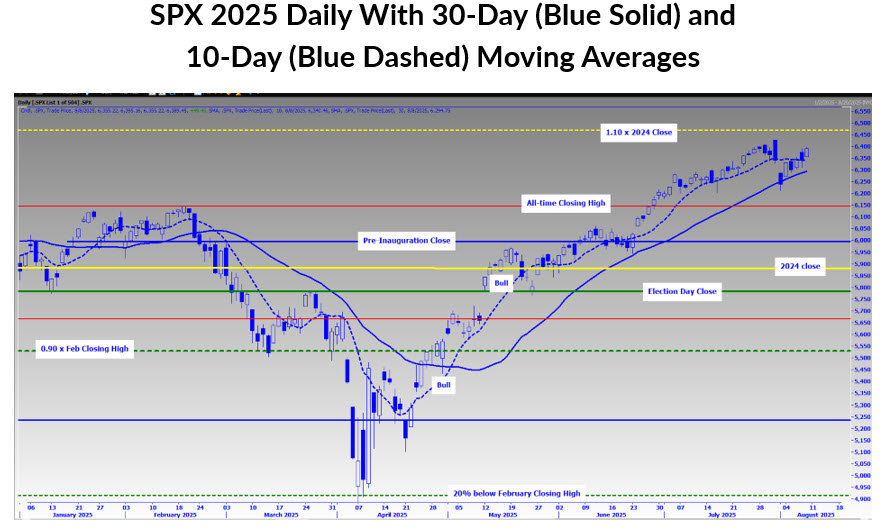
Judging by the stock market’s quick recovery after the prior week’s decline, momentum “disappearing” may have been too strong a word, in retrospect. Yes, the S&P 500 Index (SPX - 6,389.45) has gone six consecutive days without a new all-time intraday high, its longest streak since mid-June. But on Friday, it closed just 0.32 points below last month’s all-time closing high of 6,389.77, defying the broad strokes of caution that range from tariffs, poor seasonality, claims of euphoria (which I dispelled two weeks ago and is further supported by the excerpt above), and valuations.
Momentum had shown signs of slowing two weeks ago, but it wasn’t enough to cause technical damage, as I suggested in last week’s commentary. As such, like June, the area in the vicinity of the SPX’s rising 30-day moving average acted as support ahead of last week’s advance. In fact, the SPX crossed back above its 10-day moving average late last week and comes into this week with its sights on 6,427, the intraday all-time high that occurred on the last day of July.
If the SPX can push above 6,427, just above that level is 6,469, which I have observed in previous commentaries as a potential pause or pivot point, since it is exactly 10% above last year’s close. Those anchoring to the 2024 close may use this area to lighten stock exposure, especially with the abundance of caution swirling among Wall Street strategists and economists.
With active fund managers now fully invested, according to the latest survey from the National Association of Active Investment Managers (NAAIM), and retail investors in retreat, there is the potential of both bulls and bears getting tested. Choppiness between this month’s low in the 6,200 area and highs in the vicinity of 6,450 area are a potential scenario to monitor as we move through August and September.

“Trump’s actions so far have raised the effective average tariff rate on all imported goods to roughly 18%, from 2.3% last year. Those are the highest levels since the 1930s… A trade truce with China is set to expire Aug. 12, and another with Mexico expires in October. Economists expect the higher tariffs to inflict damage by pushing inflation higher and contributing to a slowdown in economic growth. GDP rose at a 1.2% annualized pace in the first half of the year, versus 2.5% last year.”
-The Wall Street Journal, August 6, 2025
“Investors are pulling money from US equities and flocking into cash funds, Bank of America Corp.’s Michael Hartnett said, amid renewed concerns that sweeping tariffs are crimping economic growth. Nearly $28 billion was redeemed from US stocks in the week through Aug. 6, while money market funds attracted about $107 billion, the biggest inflows since January…Investors are also worried about the outlook for corporate earnings as President Donald Trump’s new levies took hold Thursday. The average tariff rate has now risen to 15.2%, well above 2.3% last year and the highest level since the World War II era.”
Market participants appear to be viewing the current level of tariffs as acceptable, whether the effective rates are 15% as reported by Bloomberg or 18% as reported by The Wall Street Journal. But there is still uncertainty with respect to key trading partners, such as China and Mexico, with more clarity on the former expected this week.
Nonetheless, economists are sounding the alarm on higher inflation from tariffs contributing to a slowdown. This could be why SPX component short interest remains high (new short interest data will be released this week) and why some fund investors bailed and sought the safety of money market funds, discounting a gloomy scenario related to tariffs.
The jury is still out on whether the SPX will renew its mid-June through late July momentum or live up to the much-publicized negative August and September seasonality trends. I would like to see both its intraday all-time high at 6,427 and the 6,469 level taken out to be more confident of a shift back to bullish momentum.
Short-term bulls sticking with the trend should look for evidence of a technical breakdown, such as a solid close below the SPX’s 30-day moving average, before acting on the widespread cautionary warnings that have been prevalent in recent weeks. But if the caution is making you lose sleep, a portfolio hedge using options should be considered, with the Cboe Volatility Index (VIX - 15.15) near this year’s low point even amid trade uncertainty with China, Mexico and inflation data due out this week.
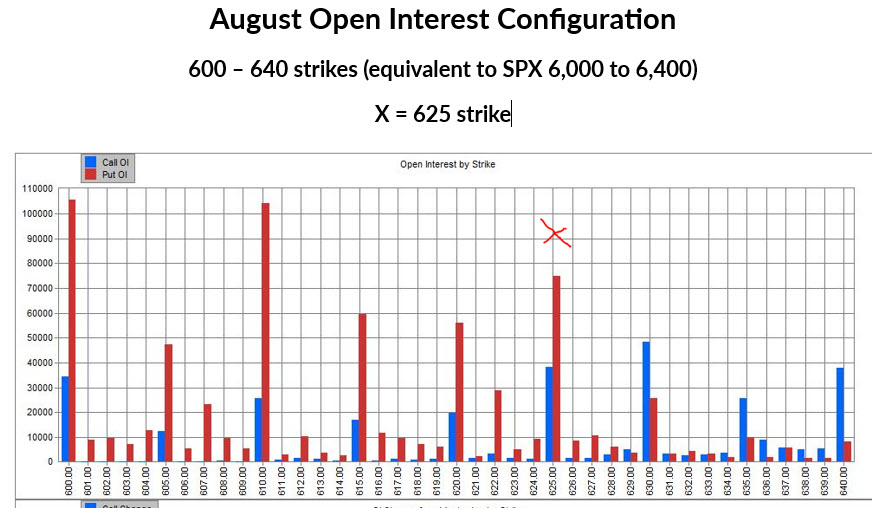
Finally, standard August expiration is this coming Friday. With a trade deal with China set to expire this week and inflation data due to be released, the biggest risk to bulls is macro news that misses expectations, generating a gap lower that pushes the SPDR S&P 500 ETF (SPY - 637.18) into the $625 range.
It is the 625-strike and below where there is a series of heavy put open interest (OI) strikes. Our data suggests that most of these puts were bought-to-open by customers, which means these put-heavy strikes have magnet potential from delta-hedge selling.
Delta-hedge selling could occur if the SPY finds itself in the vicinity of the 625-strike before Friday expiration. The rally last week may have been driven in part by shorts positions related to these strikes being slowly taken off as we progressed through last week. But those shorts may be put back to work if the 625-strike comes back into view this week.

Todd Salamone is Schaeffer's Senior V.P. of Research
Continue Reading:
| Feb-17 | |
| Feb-17 | |
| Feb-17 | |
| Feb-17 | |
| Feb-17 | |
| Feb-17 |
Stock Market Today: Dow Rises, But Tech Stocks Fall; Palantir, Tesla Extend Losses (Live Coverage)
SPY
Investor's Business Daily
|
| Feb-17 | |
| Feb-17 |
Stock Market Today: Dow, Tech Futures Slide; Nvidia, Palantir, Tesla Extend Losses (Live Coverage)
SPY
Investor's Business Daily
|
| Feb-17 | |
| Feb-17 | |
| Feb-17 | |
| Feb-17 | |
| Feb-17 | |
| Feb-16 | |
| Feb-16 |
Join thousands of traders who make more informed decisions with our premium features. Real-time quotes, advanced visualizations, backtesting, and much more.
Learn more about FINVIZ*Elite