|
|
|

|
|||||

|
|
“Correction risk has increased slightly relative to August and September, with the range-bound price action causing short-term traders to grow cautious from a period of an optimistic extreme. But the bulls remain in control with the VIX experiencing a weekly close below important levels, and the SPX closing the week back above its 30-day moving average, without violating its 50-day moving average, which will also be necessary for a correction to unfold.”
-Monday Morning Outlook, October 20, 2025
“Unless and until there is a firm break below the lower boundary of the bull channel, which is currently in the vicinity of the important 30-day and 50-day moving averages, I consider the bulls to be in control.”
-Monday Morning Outlook, November 3, 2025
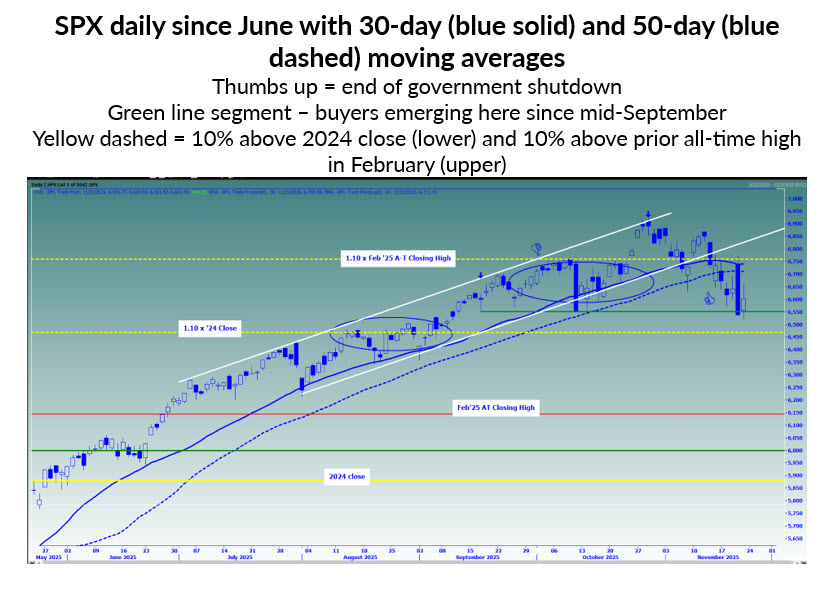
Amid growing calls for a corrective move in the S&P 500 Index (SPX—6,602.99) since early August, I have been giving readers a roadmap that quantifies the uptrend that started in April.
My message was that a corrective move cannot occur unless there is a visible change in the unfolding advance in the market. The key measures I was advising readers to use to quantify the uptrend keyed in on the 30-day and 50-day moving averages, in addition to a bullish channel that had developed in prior months.
Even if such support levels within the uptrend were violated, my takeaway was that such a scenario did not guarantee a correction, but would up the ante on correction risk, which might suggest taking some sort of action such as a hedge or reducing bullish positioning relative to when the market was trading above the quantified measures of an uptrend.
Based on the quantified measures of the SPX uptrend, last Monday's close below the bottom boundary of its bull channel, its 30-day moving average, and its 50-day moving average officially heightened correction risk. After that close, little changed throughout the week, implying correction risk remains elevated despite favorable seasonality for equities.
The implication is that if you are looking ahead to the short term, it might be a good idea to hedge profitable long positions that you you may not want to sell for tax purposes, or lighten up on bullish positioning, if tax consequences are not a factor in your decision-making.
The break of support levels does not mean a correction -- defined as a 10% move below the high -- is a slam dunk. But as I emphasized weeks ago, those risks have risen due to a meaningful change in the uptrend pattern.
The SPX would be in a corrective state if it moves to 6,200, based on the high close of 6,890. A bear might point out that the stock market has not responded well to perceived good news, such as the end of the government shutdown, or a strong earnings report from AI bellwether Nvidia (NVDA) last week.

“For the first time since tariff confusion began to subside in May, the indexes dipped below their 50-day moving averages. Technical stock analysts often consider the benchmarks’ moves above or below those averages as signals for the market’s path forward.”
-The Wall Street Journal, November 17, 2025
“’Ugly’ Technicals Put the U.S. Stock Rally at Risk of Correction”
“The benchmark index closed below its 50-day moving average for the first time in 139 sessions, breaking the second-longest stretch of this century above the closely watched trend line.”
Since the SPX’s move below its 50-day moving average made the front-page of The Wall Street Journal and discussed in other publications, I have my doubts if a serious correction is underway and our quantitative data supports this notion.
In my long time following the market, I have seen front page articles in The Wall Street Journal that featured technical analysts predicting doom after carnage, such as bear markets, mark or nearly mark important bottoms.
Last week’s front-page article was published with the SPX just 4.4% below its closing high in late October. Given the popularity of this moving average and the break of it garnering so much attention, my contrarian ears perk up that a bottom could be imminent that befuddles the technical crowd, even as correction risk has admittedly increased.
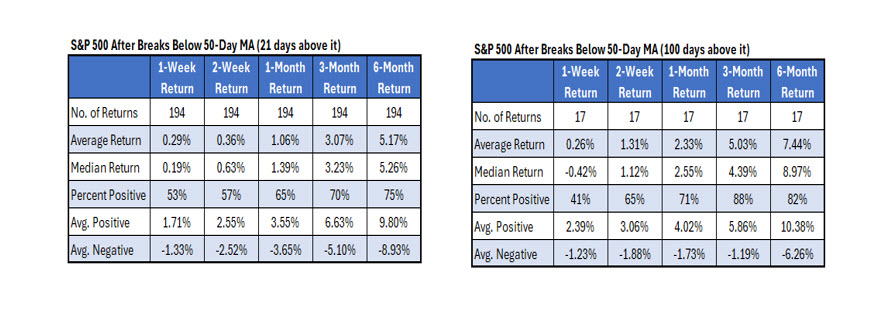
In fact, according to the tables below, note that the longer the SPX is above its 50-day moving average prior to a break below it, the less likely that a continuation move lower occurs.
In fact, of the 17 instances since 1950 that after going 100 or more days above the 50-day moving average before a close below it, the worst returns two weeks later and one month later were -4.4% and -4.6%, respectively, in June 1950.
After 1950, the worst return two weeks later was -2.5% in June 1961 and the worst return one month later was -2.4% in July 1983. There was never such signal in the month of November of the 17 previous occurrences. A takeaway from this might be that correction risk is still higher than normal, but still very low if using the breach of the 50-day moving average last week as a signal.

$SPX (post $NVDA earnings-driven pop) now battling to push above its 30-day moving average - support on multiple pullbacks since April low - and 6,760, which is 10 percent above the prior all-time high in February '25 and where index incurred resistance in Sept. & Oct.
— Todd Salamone (@toddsalamone) November 20, 2025
As I was posting the above comments on X, little did I know that the market was about to make an abrupt and sharp reversal lower. The SPX gapped higher and was trading 1.5% above the Wednesday close at the time that I posted my observation.
However, I flagged that the index was trading at potential resistance from the rolling over 30-day moving average that had proven significant during the advance as support and the 6,760 level, which is 10% above the previous all-time high in February, a level I had keyed on and had acted as resistance in October.
By the end of the day, the SPX closed at 6,538, or 1.5% lower. Sharp reversals lower after major morning upside like Thursday’s session is not an everyday event.
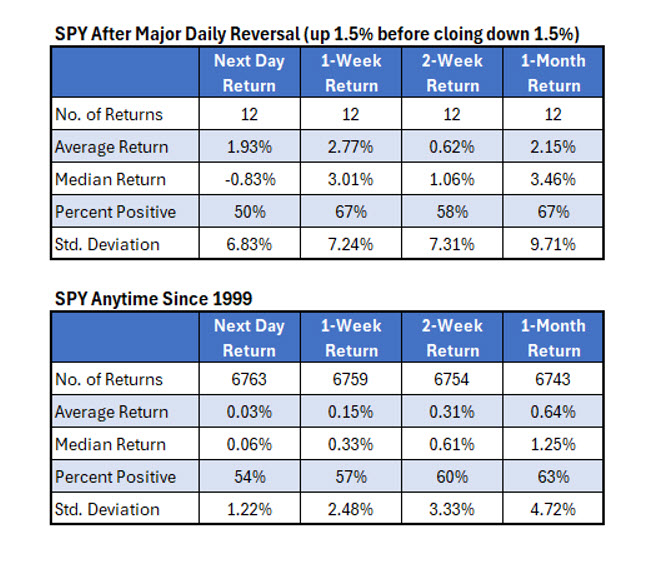
Might an ugly “candle” day like this have bearish implications? I asked Rocky White, our Senior Quantitative Analyst for additional insight. He looked into prior instances the SPDR S&P 500 ETF Trust (SPY) was higher by 1.5% or more and closed 1.5 percent or worse lower. Rocky found that this has happened twelve times since 1999. The next day returns are below the SPY’s average at-any-time return the next day, but the one-week, two-week and one-month later returns are more bullish than the positive at-any-time SPY returns since 1999, with about the same probability of being higher.
In other words, as ugly as this past Thursday’s candle was, history suggests that it is anything but a signal.

I find it interesting that buyers stepped in around the 6,550-level last week, which is where they emerged intraday in mid-September and again after a sharp one-day decline last month, as seen on the SPX graph earlier in the commentary.
Be open to the possibility of market participants hype-focusing on the 50-day moving average that generated a flush that is not as bearish as it appears on the surface. If the 6,550 level does not prove to be a trough, I could see the 6,470 area being supportive, which is 10% above the 2024 close, an area of hesitation in August, and far above the 6,200 level that defines a corrective move.
Amid ‘ugly technicals’ from a breadth and more recently the break below a popular moving average last week, the contrarian trade would be to step in and buy, contrary to the behavior of the typical retail buyer, who is no longer “buying the dip” during this period of favorable seasonality.
Todd Salamone is Schaeffer's Senior V.P. of Research
| 11 min | |
| 14 min | |
| 27 min | |
| 37 min | |
| 46 min | |
| 1 hour | |
| 1 hour |
Stock Market Today: Dow Up 300 Points; Nvidia Jumps, Amer Sports Glows In New Breakout (Live Coverage)
NVDA
Investor's Business Daily
|
| 1 hour | |
| 1 hour | |
| 1 hour | |
| 1 hour | |
| 1 hour | |
| 1 hour | |
| 2 hours | |
| 2 hours |
Join thousands of traders who make more informed decisions with our premium features. Real-time quotes, advanced visualizations, backtesting, and much more.
Learn more about FINVIZ*Elite