|
|
|

|
|||||

|
|
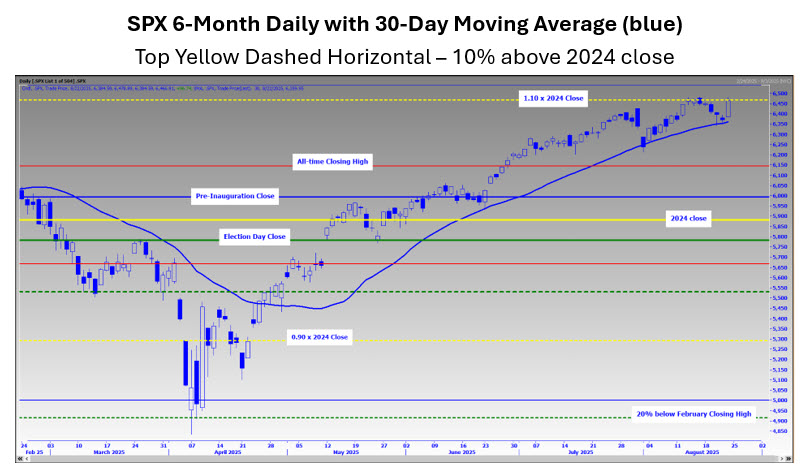
“If you follow what is being said in mainstream and social media, you have seen an abundance of reasons why the stock market is due for a pullback, ranging from indicators meant to be precise in timing (seasonality), to those that have a long history of being imprecise in timing (valuations)…. the SPX looks to be pausing at the level that corresponds with 10% above the 2024 close (6,469)…This is not a big surprise, per comments I made about this level in previous commentaries…It is advised to identify a level that the broad market trades below to validate the caution…While the SPX is stalling …it isn’t cracking. If you are a short-term trader looking for evidence of a crack, you can look for a significant move below the SPX’s 30-day moving average, which was supportive after the cross above in April, and again in June and the first trading day of this month.”
- Monday Morning Outlook, August 18, 2025
$SPX's 30-day moving average, which has had importance as discussed in my weekly commentaries, marked the low in Wednesday's (8/20/25) session https://t.co/yvkuFv0A4J
— Todd Salamone (@toddsalamone) August 21, 2025
The excerpt above from last week’s commentary does an outstanding job of summarizing the cautious sentiment among market participants amid the S&P 500 Index’s (SPX – 6,466.91) bullish technical backdrop, which I have observed in previous weeks.
From a technical perspective, and worthwhile for short-term traders, the SPX’s pause at 6,469 – 10% above its 2024 close -- has not been a major surprise. Moreover, last week’s trough at its 30-day moving average was not a big surprise either, given its recent significance.

A “buy the dip” mentality was evident ahead of Friday’s dovish comments from Federal Reserve Chair Jerome Powell at the Jackson Hole Symposium.
For example, active investment managers, per the National Association of Active Investment Managers (NAAIM) weekly survey, increased their exposure from 85% invested to almost fully invested, with the reading rising from 85.6% to 98.1% (100% is fully invested). As such, while this group played a role in buying the retreat, they are not likely a source of support in the near term since they are fully invested.
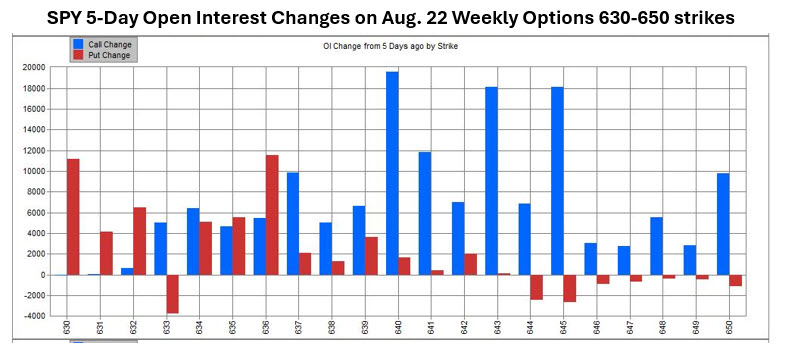
Additional evidence of a “buy the dip” mentality emerged from S&P 500 Index ETF Trust (SPY – 645.31) short-term options traders (not day traders, but traders whose time frame is a few days). In the graph below, note the call open interest change bias on Aug. 22 weekly expiration options in the five days prior to Friday expiration. Such activity may have helped support the broad market during its brief decline and ahead of Powell’s speech.

The potential downside is whether a supportive call bias continues with the SPX back at its recent highs. It is clear SPY option players adopted a “buy the dip” mentality but will this mentality continue with the SPX back to a level that preceded profit-taking last week?
For what it is worth, six of the nine most active SPY weekly 8/29 options were puts on Friday, creating a coincidental headwind for the broad market. Amid this option activity, the SPX went sideways for the final five hours of Friday’s session. The sideways action was at the exact highs of the week of Aug. 11-15, roughly 10% above the 2024 close.
Also of note is the well-publicized J.P. Morgan collar trade that is conducted at the end of each quarter. The sold SPX strike that is part of the collar strategy is at 6,505. With the SPX within “striking” distance of this strike, dealers are long gamma, and this could act as a volatility-dampening speed bump if the levels that corresponds with 10% above the 2024 close is cleared.
While it is possible that option-related headwinds are in store, there are still multiple sources of support for the broad market:
-Corporate buyback activity as earnings seasons wind down (companies usually don’t engage in buyback operations in immediate days and weeks before earnings).
-Retail FOMO buyers - with the American Association of Individual Investors (AAII) survey most recently showing 45% bearish and only 31% bullish.
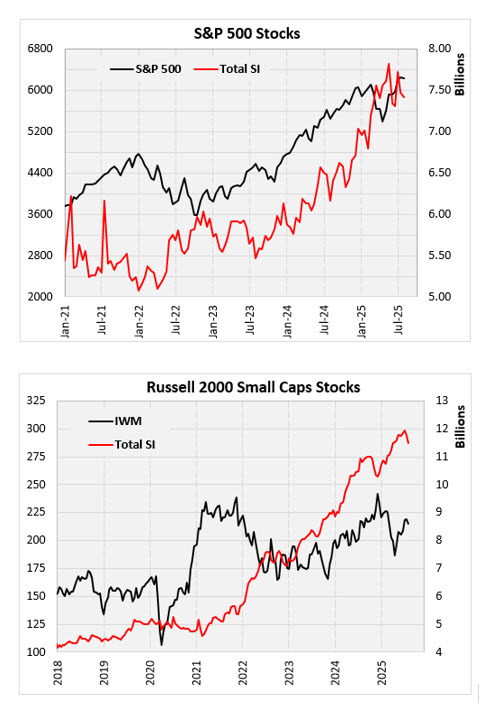
-Short covering – long-time readers are aware that SPX component short interest is rolling over from multi-year highs and short covering potential has been part of our bull case since the start of 2024.
-Not to be lost in the discussion is that the Russell 2000 Index (RUT – 2,1496.53) is not far below its twin-peak all-time highs in the vicinity of 2,450. Short interest on RUT components is also at multi-year highs and could figure into a “broadening out of the rally” theme (see the charts below).

Last week, all eyes were on the central bank meeting. This coming week, Nvidia’s (NVDA) earnings on Wednesday and another inflation reading on Friday will be the focus of investors.
Long-term investors should stay the bullish course. Short-term traders should keep the SPX’s 30-day moving average on their radar to assess whether we are vulnerable to increased correction risk. The known risks are seasonality, valuations, geopolitical tensions, and tariffs – all of which have been ignored to this point.
The technical backdrop is far from validating the caution that we hear and read about each day. A breach of the SPX’s 30-day moving average changes the pattern of support from this trendline that warrants a hedge against the increased possibility of a corrective move. But a break below the 30-day moving average far from guarantees the onset of a corrective shift.
Todd Salamone is Schaeffer's Senior V.P. of Research
Continue Reading:
| 4 hours | |
| 5 hours | |
| 7 hours | |
| 7 hours | |
| 7 hours | |
| 8 hours | |
| 8 hours | |
| 8 hours | |
| 8 hours | |
| 8 hours | |
| 8 hours | |
| 8 hours | |
| 9 hours | |
| 10 hours | |
| 10 hours |
Join thousands of traders who make more informed decisions with our premium features. Real-time quotes, advanced visualizations, backtesting, and much more.
Learn more about FINVIZ*Elite