|
|
|

|
|||||
|
|
|
lululemon athletica inc. LULU has exhibited a consistent downtrend in recent months. The company lost momentum as a weak second quarter and a slashed fiscal 2025 guidance rattled investor sentiment. Management’s caution about the rising import tariffs, potential retaliatory measures and the removal of the de minimis exemption underscores a challenging road ahead.
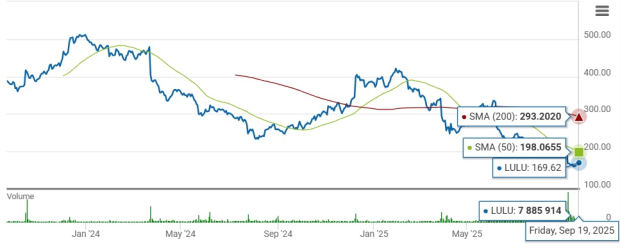
The Vancouver, Canada-based yoga-inspired athletic apparel company hit a 52-week low of $159.25 on Sept. 15, 2025, reflecting a marked slowdown after the company’s results on Sept. 4. Closing trade at $169.62 on Sept. 19, shares had recovered 6.5% to $169.62. However, the stock has been down 59.9% from its 52-week high of $423.32.
lululemon’s second-quarter fiscal 2025 results reflected an EPS beat, while revenues missed estimates. The company’s top line improved year over year, while the bottom line declined, led by soft margins. Although revenues improved year over year, the company’s performance in the Americas, predominantly the U.S. business, reflected soft trends.
LULU lowered its fiscal 2025 guidance due to the expectations of increased tariff-related costs, retaliatory tariff measures and the removal of the de minimis exemption. For fiscal 2025, LULU anticipates net revenues of $10.85-$11 billion, indicating 2-4% year-over-year growth. Excluding the 53rd week in fiscal 2024, revenues are expected to rise 4-6%. The company projects an EPS of $12.77-$12.97, suggesting a sharp decline from the $14.64 reported in fiscal 2024.
For the third quarter of fiscal 2025, management anticipates net revenues of $2.47-$2.5 billion, indicating 3-4% year-over-year growth. EPS for the fiscal third quarter is expected to be $2.18-$2.23, compared with $2.87 in the year-ago period.
Shares of lululemon recorded a decline of 29.1% in the past three months, below the Textile - Apparel industry’s 2.1% fall. The stock has also underperformed the broader Consumer Discretionary sector and the S&P 500’s growth of 5.1% and 12.6%, respectively, in the same period.
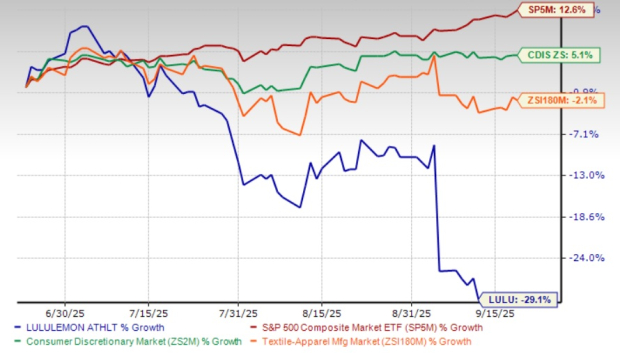
LULU’s performance is significantly weaker than that of G-III Apparel Group GIII, Guess Inc. GES and Hanesbrands Inc. HBI, which have jumped 21.9%, 40.4% and 39.2%, respectively, in the past three months. Moreover, LULU is trading below its 50 and 200-day moving averages, indicating a bearish outlook.
lululemon has been facing a period of meaningful turbulence as several structural challenges weigh on its performance. The most pressing headwind is the erosion of momentum in its largest market, the United States. After years of outsized growth, the company has become overly reliant on a handful of core casual and lounge franchises that have lost its edge with long-time, high-value customers. Shoppers are increasingly demanding fresh styles and innovation, but lululemon’s product cycles in certain categories have grown stale, leaving it vulnerable to changing preferences in a crowded athleisure market.
At the same time, consumer behavior is shifting, with buyers spending less on discretionary apparel and becoming more selective, further amplifying the impacts of weaker product resonance. The company is working to refresh its assortment and speed up go-to-market processes. However, management acknowledged that the benefits of these efforts will not meaningfully show until fiscal 2026, leaving near-term exposure to ongoing softness.
lululemon is also contending with external headwinds like a tougher trade environment. Rising tariffs and the removal of the de minimis exemption are adding significant cost pressures, squeezing margins and forcing management to weigh pricing adjustments against the risk of alienating customers. Management warned of a deeper 300 bps gross margin decline due to tariff-related costs, including the removal of the de minimis exemption. Tariffs are projected to hurt margins by $240 million in fiscal 2025 and $320 million in fiscal 2026. These policy shifts disrupt the efficiency of its cross-border e-commerce model and will require long-term supply-chain adaptation.
While international markets remain a bright spot, the challenges in the Americas, paired with escalating cost burdens, signal a more difficult road ahead. The company’s core strengths in brand loyalty and performance innovation remain intact, but execution missteps and macro pressures are creating a difficult reset period.
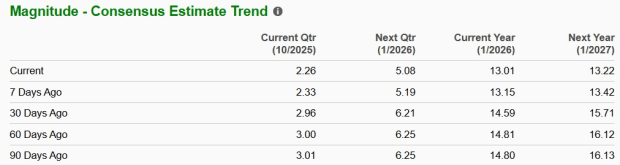
Driven by the subdued outlook, lululemon’s estimates have shown a downtrend in the past seven days. The Zacks Consensus Estimate for LULU’s fiscal 2025 and 2026 earnings per share declined 1.1% and 1.5%, respectively, in the last seven days. The downward revision in earnings estimates indicates that analysts are skeptical about the company’s near-term growth potential.
For fiscal 2025, the Zacks Consensus Estimate for LULU’s sales implies year-over-year growth of 4.1%, while EPS indicates a 11.1% decline. The consensus mark for fiscal 2026 sales and earnings suggests 4.8% and 4.6% year-over-year growth, respectively.
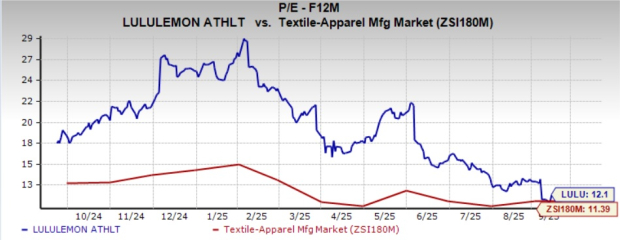
LULU’s current forward 12-month price-to-earnings (P/E) multiple of 12.1X raises concerns about whether the stock's valuation is justified. This multiple is higher than the Zacks Textile - Apparel industry average of 11.39X, making the stock appear relatively expensive.
At 12.1X P/E, lululemon trades at a significant premium to its industry peers. The company’s peers, such as G-III Apparel, Guess and Hanesbrands, are delivering solid growth and trade at more reasonable multiples. G-III Apparel, Guess and Hanesbrands have respective forward 12-month P/E ratios of 9.24X, 9.76X and 9.42X — all significantly lower than LULU. At such levels, lululemon’s valuation seems out of step with its growth trajectory.
lululemon is facing a difficult stretch as weakening U.S. trends, stale casual categories and shifting consumer preferences weigh on performance. The company’s reliance on core franchises has left it vulnerable in a highly competitive market, while tariff headwinds and the removal of the de minimis exemption are set to further pressure margins and disrupt its supply chain. Although global growth and strong brand loyalty provide some support, these positives are overshadowed by execution challenges and a lack of near-term catalysts.
Earnings estimate cuts highlight eroding confidence in lululemon’s growth prospects, while the stock’s slide toward its 52-week low reflects broader investor skepticism. Despite these setbacks, shares continue to trade at a premium to peers, raising concerns about valuation. Taken together, the bleak outlook, estimate revisions, and fragile sentiment suggest caution. At present, this Zacks Rank #5 (Strong Sell) stock carries greater downside risks than recovery potential.
You can see the complete list of today’s Zacks #1 Rank (Strong Buy) stocks here.
Want the latest recommendations from Zacks Investment Research? Today, you can download 7 Best Stocks for the Next 30 Days. Click to get this free report
This article originally published on Zacks Investment Research (zacks.com).
| Jul-20 | |
| Jul-16 | |
| Jul-16 | |
| Jul-16 | |
| Jul-16 | |
| Jul-16 | |
| Jul-15 | |
| Jul-14 | |
| Jul-13 | |
| Jul-07 | |
| Jul-06 | |
| Jul-02 | |
| Jul-01 | |
| Jul-01 | |
| Jun-30 |
Join thousands of traders who make more informed decisions with our premium features. Real-time quotes, advanced visualizations, alerts, and much more.
Learn more about Finviz Elite