|
|
|

|
|||||
|
|
|
Last week, the three most widely followed U.S. indexes The Nasdaq Composite, the S&P 500, and the Dow Jones Industrial Average slipped 3.21%, 2.79%, and 2.60%, respectively. A sharp sell-off began due to heightened uncertainty after the government shutdown and a dramatic escalation in the trade conflict between the United States and China, the world's top two economies.
With the shutdown entering its second week, public services were disrupted, and key official economic data, such as the September jobs numbers, got delayed, leaving investors and policymakers to rely on private-sector indicators. Escalating the trade conflict, President Donald Trump threatened to impose a 100% tariff on Chinese goods after China enforced new export controls on rare earth minerals, which are critical to various U.S. tech manufacturing industries.
The University of Michigan's preliminary Consumer Sentiment index came in relatively steady at 55.0 in October compared with a final reading of 55.1 in September due to concerns over high prices and a weakening job market. The Federal Reserve's minutes of the meeting indicate a cautious approach by the central bank while taking future policy moves, citing concerns over high inflation and a softening labor market
Due to fiscal and geopolitical uncertainties, gold prices continued a record-breaking rally, surpassing $4,000 per ounce for the first time, reflecting heightened safe-haven demand.
Regardless of market conditions, we, here at Zacks, provide investors with unbiased guidance on how to beat the market.
As usual, Zacks Research guided investors over the past three months with its time-tested methodologies. Given the prevailing market uncertainty, you may want to look at our feats to prepare better for your next action.
Here are some of our key achievements:
Shares of Montrose Environmental Group, Inc. MEG have gained 20.6% (versus the S&P 500’s 4% increase) since it was upgraded to a Zacks Rank #1 (Strong Buy) on August 6.
Another stock, Xeris Biopharma Holdings, Inc. XERS, which was also upgraded to a Zacks Rank #2 (Buy) on August 11, has returned 16.8% (versus the S&P 500’s 2.5% rise) since then.
Zacks Rank, our short-term rating system, has earnings estimate revisions at its core. Empirical research shows a strong correlation between trends in earnings estimate revisions and near-term stock price movements.
A hypothetical portfolio of Zacks Rank # 1 (Strong Buy) stocks returned +8.64% in 2025 (through September 1st) vs. +7.60% for the S&P 500 index.
This portfolio returned +22.4% in 2024, vs. +28% for the S&P 500 index and +19.9% for the equal-weight version of the S&P 500 index.
This hypothetical portfolio returned +20.65% in 2023 vs. +24.83% for the S&P 500 index and +15% for the equal-weight S&P 500 index.
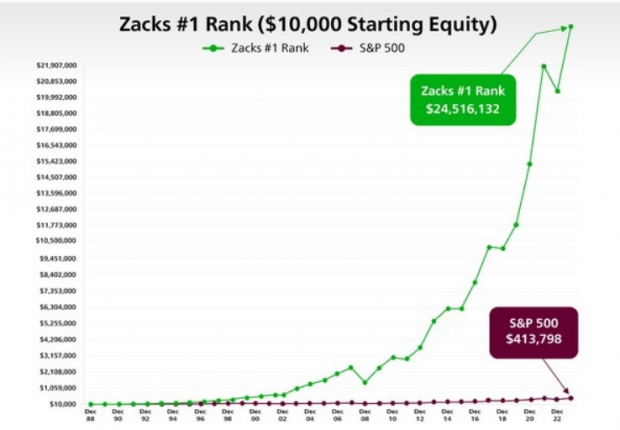
The Zacks Model Portfolio - consisting of Zacks Rank #1 stocks – has outperformed the S&P index by more than 12 percentage points since 1988 (through September 1st, 2025, the Zacks # 1 Rank stocks generated an annualized average return of +23.8% vs. +11.3% for the S&P 500 index).
You can see the complete list of today’s Zacks Rank #1 stocks here >>>
Check Montrose Environmental Group’s historical EPS and Sales here>>>
Check Xeris Biopharma’s historical EPS and Sales here>>>
Shares of MariMed Inc. IDCC and StoneCo Ltd. STNE have advanced 40.9% (versus the S&P 500’s 1.6% increase) and 20.6% (versus the S&P 500’s 2.7% increase), respectively, since their Zacks Recommendation was upgraded to Outperform on August 13 and August 12.
While the Zacks Rank is our short-term rating system that is most effective over the one- to three-month holding horizon, the Zacks Recommendation aims to predict performance over the next 6 to 12 months. However, just like the Zacks Rank, the foundation for the Zacks Recommendation is trends in earnings estimate revisions.
The Zacks Recommendation classifies stocks into three groups — Outperform, Neutral and Underperform. While these recommendations are determined quantitatively, our analysts have the flexibility to override them for the 1100+ stocks they closely follow based on their better judgment of factors such as valuation, industry conditions and management effectiveness than the quantitative model.
Shares of Micron Technology, Inc. MU, which belongs to the Zacks Focus List, have gained 45.8% over the past 12 weeks. The stock was added to the Focus List on December 27, 2016. Another Focus-List holding, Lam Research Corporation LRCX, which was added to the portfolio on December 5, 2016, has returned 29.1% over the past 12 weeks. The S&P 500 has advanced 4.8% over this period.
The 50-stock Focus List portfolio returned 18.3% in 2025 (through September 30th, 2025) vs. +14.8% for the S&P 500 index and +9.9% for the equal-weight version of the index.
The Zacks Focus List portfolio returned +18.41% in 2024 vs. +25.04% for the S&P 500 index and +13% for the equal-weight S&P 500 index. The portfolio had returned +29.54% in 2023 vs. +26.28% for the S&P 500 index and +13.61% for the equal-weight S&P 500 index. In 2022, the portfolio returned -15.2% vs. the S&P 500 index’s -17.96%.
The portfolio leads the broader market over the preceding one, three, five and ‘since 2004’ periods. These annualized return comparisons are: +16.96% for the Focus List vs. +17.60% for the index over the one-year period, +26.77% vs. +24.94% over the 3-year period, +17.38% vs. +14.48% over the 5-year period, and +12.13% vs. +10.71% since 2004.
Unlock all of our powerful research, tools and analysis, including the Focus List, Zacks #1 Rank List, Equity Research Reports, Zacks Earnings ESP Filter, Premium Screener and more, as part of Zacks Premium. Gain full access now >>
Oracle Corporation ORCL, a component of our Earnings Certain Admiral Portfolio (ECAP), has jumped 27.1% over the past 12 weeks. Thermo Fisher Scientific Inc. TMO has followed Oracle with 20.7% returns.
The Zacks Earnings Certain Admiral Portfolio (ECAP), which consists of 30 concentrated, ultra-defensive, long-term Buy-and-Hold stocks, returned +0.20% in the second quarter of 2025 vs. the S&P 500 index’s +10.94% gain (SPY ETF). In the year-to-date period through June 30th, the portfolio returned +3.93% vs. +6.20% gain for the S&P 500 index.
For the year 2024, the portfolio returned +16.26% vs. +24.89% for the S&P 500 index (SPY ETF).
In 2023, the portfolio returned +12.17% vs. +26.28% for the S&P 500 index. The portfolio returned -4.7% in 2022 vs. the S&P 500 index’s -17.96%.
With little to no turnover and annual rebalance periodicity, ECAP seeks to minimize capital loss by holding shares of companies whose earnings streams exhibit a proven 20+ year track record of surviving recessionary periods with minimal impact on aggregate earnings growth relative to the overall S&P 500.
The ECAP and many other model portfolios are available as part of Zacks Advisor Tools, a cloud-based solution to access Zacks award-winning stock, mutual fund and ETF research. Click here to schedule a demo.
UnitedHealth Group Incorporated UNH, which is part of our Earnings Certain Dividend Portfolio (ECDP), has returned 16.6% over the past 12 weeks. Another ECDP stock, Quest Diagnostics Incorporated DGX, has also climbed 9.5% over the same time frame. Of course, the inclination of investors toward quality dividend stocks to secure an income stream amid heightened market volatility contributed to this performance.
Check UnitedHealth‘s dividend history here>>>
Check Quest Diagnostics' dividend history here>>>
With an extremely low beta and a history of minimum earnings variability over the last 20+ years, this 25-stock portfolio helps to significantly mitigate risk.
The Zacks Earnings Certain Dividend Portfolio (ECDP) returned -3.17% in 2025 Q2 vs. the S&P 500 index’s +10.94% gain and the Dividend Aristocrats ETF’s (NOBL) -0.09% return. Year-to-date (through June 30th), the portfolio returned +2.38% vs. +2.18% gain for the Dividend Aristocrat ETF.
For the full year 2024, the portfolio returned +6.95% vs. +24.89% for the S&P 500 index and +6.72% for NOBL.
The portfolio returned -0.9% in 2023 vs. +26.28% for the S&P 500 index and +8.11% for NOBL. The portfolio returned -2.3% in 2022 vs. -17.96% for the S&P 500 index and -8.34% for NOBL.
Click here to access this portfolio on Zacks Advisor Tools.
MasTec, Inc. MTZ, from the Zacks Top 10 Stocks for 2025, has jumped 43.7% since the list was released on January 2. During this period, the S&P 500 has increased by +11.5%.
The Top 10 portfolio returned +26.47% this year (through the end of September 2025) vs. +14.84% for the S&P 500 index and +9.9% for the equal-weight version of the index.
The Top 10 portfolio returned +62.98% in 2024, vs. +25.04% for the S&P 500 index and +13% for the equal-weight version of the index. The portfolio had returned +25.15% in 2023 vs. +26.28% for the S&P 500 index.
Since 2012, the Top 10 portfolio has produced a cumulative return of +2,553.1% through the end of September 2025 vs. +545.2% for the S&P 500 index and +396.4% for the equal-weight version of the index. The portfolio has produced an average return of +26.6% in the period 2012 through September 30, 2025, vs. +13.1% for the S&P 500 index and +10.5% for the equal-weight version of the index.
Want the latest recommendations from Zacks Investment Research? Today, you can download 7 Best Stocks for the Next 30 Days. Click to get this free report
This article originally published on Zacks Investment Research (zacks.com).
| 19 min | |
| 20 min | |
| 32 min | |
| 36 min | |
| 50 min | |
| 51 min | |
| 1 hour | |
| 1 hour | |
| 1 hour | |
| 1 hour | |
| 2 hours | |
| 2 hours | |
| 2 hours | |
| 3 hours | |
| 4 hours |
Join thousands of traders who make more informed decisions with our premium features. Real-time quotes, advanced visualizations, alerts, and much more.
Learn more about Finviz Elite