|
|
|

|
|||||
|
|
|
Note: The following is an excerpt from this week’s Earnings Trends report. You can access the full report that contains detailed historical actual and estimates for the current and following periods, please click here>>>
Here are the key points:
We at Zacks are somewhat of outliers when it comes to industry and sector classifications. A case in point is the 16 sectors we divide the business world into, compared to the 11 sectors in the S&P Global Industry Classification System. We have a standalone sector for the automobile space, unlike the Consumer Discretionary and Industrial sectors, where automakers and other value-chain operators are conventionally classified.
Other stand-alone Zacks sectors include Retail, Construction, Conglomerates, Aerospace/Defense, Transportation, and Business Services. We believe that the stand-alone Zacks sectors for these businesses allow for a granular understanding of the issues specific to each, enabling users of our data to identify trend shifts more easily.
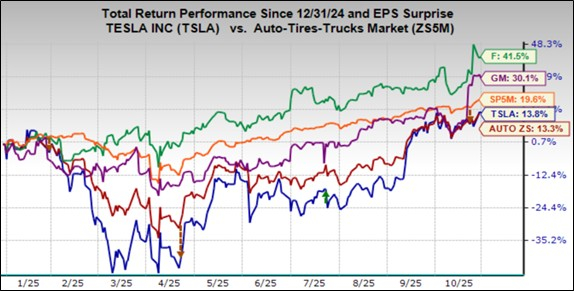
Getting back to the Zacks Auto sector, where General Motors GM, Ford F, Tesla TSLA, and other operators in the space are placed. We know that the market reacted positively to Q3 results from these three companies, more so for Ford and GM than for Tesla, but the overall market reaction has been positive.
For the Zacks Auto sector, we now have Q3 results from 57.1% of the sector players in the S&P 500 index. Total earnings for these auto sector players are down -23.9% from the same period last year on +4.2% higher revenues, with 50% beating EPS estimates and 100% beating revenue estimates.
The earnings declines are across the board, with Ford’s Q3 earnings down -7%, GM’s down -19.3% and Tesla’s down -39.5%. To give you a sense of the group’s margin trends, revenues were up +9.6% at Ford, flat at GM (actually down -0.3%), and up +11.6% at Tesla.
These numbers don’t appear to justify the market’s reaction to the Q3 results. But we have to be mindful that a stock’s reaction to quarterly results is primarily a function of what was feared and expected, rather than the absolute numbers.
It is no exaggeration to say that Tesla has unique, company-specific stock market drivers that aren’t applicable to others in the space. For Ford and GM, these results may not be pretty, but they were better than expected. Importantly, guidance for the current period was better than feared, with tariffs proving to be a smaller headwind than initially feared.
The chart below shows the year-to-date performance of Ford, Tesla, and GM shares relative to the Zacks Auto sector and the S&P 500 index.
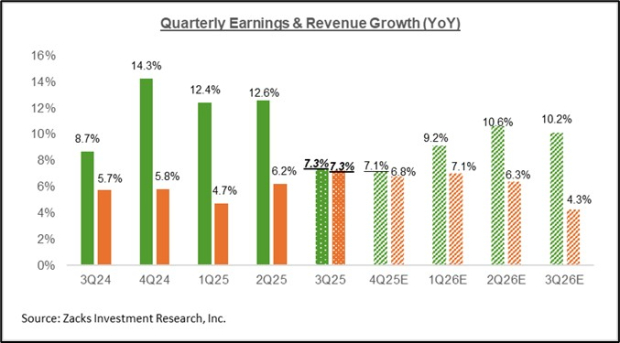
For 2025 Q3, the expectation is for earnings growth of +7.3% on +7.3% revenue gains. We have consistently shown in this space how Q3 estimates have steadily increased since the quarter began.
The chart below shows expectations for 2025 Q3 in terms of what was achieved in the preceding four periods and what is currently expected for the next three quarters.
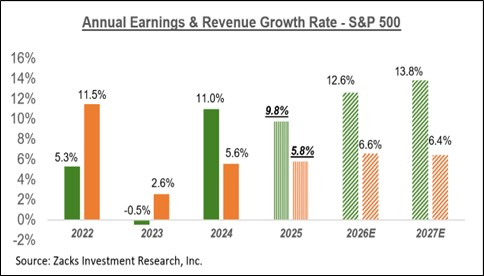
The chart below shows the overall earnings picture for the S&P 500 index on an annual basis.
The revisions trend at this stage in the Q3 reporting cycle is stable, with estimates for Q4 essentially unchanged since the quarter got underway. The typical behavior at this stage would have been for Q4 estimates to decline, which is what we have observed in the post-COVID period. At this stage in the preceding quarter, however, estimates had already started to rise.
We will see what trend takes shape in the days ahead as we get more Q3 results, which will allow analysts to adjust their estimates for Q4 and beyond. All in all, we are in a good place with the picture emerging from the Q3 reporting cycle.
Want the latest recommendations from Zacks Investment Research? Today, you can download 7 Best Stocks for the Next 30 Days. Click to get this free report
This article originally published on Zacks Investment Research (zacks.com).
| 2 hours | |
| 3 hours | |
| 3 hours | |
| 3 hours | |
| 5 hours | |
| Jul-30 | |
| Jul-30 |
Elon Musk Mulls Selling Tesla's China Unit To Smooth SpaceX Merger: WSJ
TSLA
Investor's Business Daily
|
| Jul-30 | |
| Jul-30 |
Tesla Weighs Sale of China Business to Pave Way for Potential SpaceX Merger
TSLA
The Wall Street Journal
|
| Jul-30 | |
| Jul-30 | |
| Jul-30 | |
| Jul-30 | |
| Jul-30 | |
| Jul-30 |
Join thousands of traders who make more informed decisions with our premium features. Real-time quotes, advanced visualizations, alerts, and much more.
Learn more about Finviz Elite