|
|
|

|
|||||
|
|
|
Major U.S. indexes experienced choppy but relatively flat performance last week. The Nasdaq Composite, the S&P 500 and the Dow Jones Industrial Average all lost ground by 2.7%, 1.4%, and 0.5%, respectively. Volatility was mainly due to investors shifting interest from high-valuation technology and AI stocks to more traditionally defensive sectors. Additionally, renewed uncertainty over the Federal Reserve’s December interest rate cut expectations following hawkish commentary from several Fed officials and a lack of reliable economic data has led investors to remain cautious.
The end of the historic 43-day government standoff last week removed major political risks after the U.S. Senate passed the funding bill. However, the delay in the release of key economic data, such as job and inflation reports, has created a data void for the Fed and investors making future decisions. The Fed is trying to strike the right balance between economic growth and inflation. Since inflation remains above its 2% target and the labor market continues to show resilience, expectations for a December rate cut are now in doubt.
Regardless of market conditions, we, here at Zacks, provide investors with unbiased guidance on how to beat the market.
As usual, Zacks Research guided investors over the past three months with its time-tested methodologies. Given the prevailing market uncertainty, you may want to look at our forecasts to better prepare for your next action.
Here are some of our key achievements:
Shares of Macy's, Inc. M have gained 14.9% (versus the S&P 500’s 2.2% increase) since it was upgraded to a Zacks Rank #1 (Strong Buy) on September 18.
Another stock, Fresnillo plc FNLPF, which was upgraded to a Zacks Rank #1 on September 19, has returned 7.2% (versus the S&P 500’s 1.8% increase) since then.
A hypothetical portfolio of Zacks Rank # 1 (Strong Buy) stocks returned +8.64% in 2025 (through September 1) vs. +7.60% for the S&P 500 index.
This portfolio returned +22.4% in 2024, vs. +28% for the S&P 500 index and +19.9% for the equal-weight version of the S&P 500 index.
This hypothetical portfolio returned +20.65% in 2023 vs. +24.83% for the S&P 500 index and +15% for the equal-weight S&P 500 index.
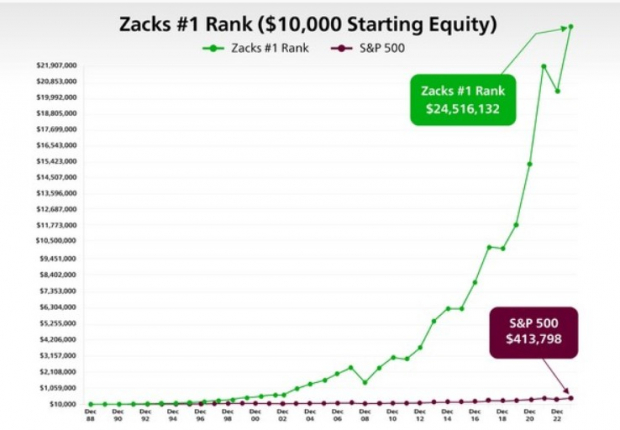
The Zacks Model Portfolio - consisting of Zacks Rank #1 stocks – has outperformed the S&P index by more than 12 percentage points since 1988 (through September 1, 2025, the Zacks # 1 Rank stocks generated an annualized average return of +23.8% vs. +11.3% for the S&P 500 index).
You can see the complete list of today’s Zacks Rank #1 stocks here >>>
Check Macy's historical EPS and Sales here>>>
Check Fresnillo’s historical EPS and Sales here>>>
Shares of United Natural Foods, Inc. UNFI and Lakeland Industries, Inc. LAKE have advanced 32.4% (versus the S&P 500’s 2.2% increase) and +8.1% (versus the S&P 500’s 2.1% increase), respectively, since their Zacks Recommendation was upgraded to Outperform on September 15 and September 17, respectively.
While the Zacks Rank is our short-term rating system that is most effective over the one- to three-month holding horizon, the Zacks Recommendation aims to predict performance over the next 6 to 12 months. However, just like the Zacks Rank, the foundation for the Zacks Recommendation is trends in earnings estimate revisions.
The Zacks Recommendation classifies stocks into three groups — Outperform, Neutral and Underperform. While these recommendations are determined quantitatively, our analysts have the flexibility to override them for the 1100+ stocks they closely follow based on their better judgment of factors such as valuation, industry conditions and management effectiveness than the quantitative model.
To access our research reports with Zacks Recommendations for the 1100+ stocks we cover, click here>>>
Shares of Caterpillar Inc. CAT, which belongs to the Zacks Focus List, have gained 35.9% over the past 12 weeks. The stock was added to the Focus List on April 18, 2017. Another Focus-List holding, CACI International Inc. CACI, which was added to the portfolio on December 2, 2015, has returned 20.1% over the past 12 weeks. The S&P 500 has advanced by 4.4% over this period.
The Zacks Focus List portfolio returned +18.41% in 2024 vs. +25.04% for the S&P 500 index and +13% for the equal-weight S&P 500 index. The portfolio had returned +29.54% in 2023 vs. +26.28% for the S&P 500 index and +13.61% for the equal-weight S&P 500 index. In 2022, the portfolio returned -15.2% vs. the S&P 500 index’s -17.96%.
The portfolio leads the broader market over the preceding one, three, five and ‘since 2004’ periods. These annualized return comparisons are: +16.96% for the Focus List vs. +17.60% for the index over the one-year period, +26.77% vs. +24.94% over the 3-year period, +17.38% vs. +14.48% over the 5-year period, and +12.13% vs. +10.71% since 2004.
Unlock all of our powerful research, tools and analysis, including the Focus List, Zacks #1 Rank List, Equity Research Reports, Zacks Earnings ESP Filter, Premium Screener and more, as part of Zacks Premium. Gain full access now >>
Cencora, Inc. COR, a component of our Earnings Certain Admiral Portfolio (ECAP), has jumped 23.6% over the past 12 weeks. Monster Beverage Corporation MNST has followed Cencora with 10.3% returns.
The Zacks Earnings Certain Admiral Portfolio (ECAP), which consists of 30 concentrated, ultra-defensive, long-term Buy-and-Hold stocks, returned -1.30% in the third quarter of 2025 vs. the S&P 500 index’s +8.1% gain (SPY ETF). In the year-to-date period through September 30, the portfolio returned +2.72% vs. +14.84% gain for the S&P 500 index.
For the year 2024, the portfolio returned +16.26% vs. +24.89% for the S&P 500 index (SPY ETF).
In 2023, the portfolio returned +12.17% vs. +26.28% for the S&P 500 index. The portfolio returned -4.7% in 2022 vs. the S&P 500 index’s -17.96%.
With little to no turnover and annual rebalance periodicity, ECAP seeks to minimize capital loss by holding shares of companies whose earnings streams exhibit a proven 20+ year track record of surviving recessionary periods with minimal impact on aggregate earnings growth relative to the overall S&P 500.
The ECAP and many other model portfolios are available as part of Zacks Advisor Tools, a cloud-based solution to access Zacks award-winning stock, mutual fund and ETF research. Click here to schedule a demo.
Johnson & Johnson JNJ, which is part of our Earnings Certain Dividend Portfolio (ECDP), has returned 10.9% over the past 12 weeks. Another ECDP stock, UnitedHealth Group Incorporated UNH, has increased 5.9% over the same time frame. Of course, the inclination of investors toward quality dividend stocks to secure an income stream amid heightened market volatility contributed to this performance.
Check Johnson & Johnson's dividend history here>>>
Check UnitedHealth’s dividend history here>>>
With an extremely low beta and a history of minimum earnings variability over the last 20+ years, this 25-stock portfolio helps to significantly mitigate risk.
The Zacks Earnings Certain Dividend Portfolio (ECDP) returned -0.01% in 2025 Q3 vs. the S&P 500 index’s +8.1% gain and the Dividend Aristocrats ETF’s (NOBL) +2.90% return. Year-to-date (through September 30th), the portfolio returned +1.58% vs. +5.15% gain for the Dividend Aristocrat ETF.
For the full year 2024, the portfolio returned +6.95% vs. +24.89% for the S&P 500 index and +6.72% for NOBL.
The portfolio returned -0.9% in 2023 vs. +26.28% for the S&P 500 index and +8.11% for NOBL. The portfolio returned -2.3% in 2022 vs. -17.96% for the S&P 500 index and -8.34% for NOBL.
Click here to access this portfolio on Zacks Advisor Tools.
MasTec, Inc. MTZ, from the Zacks Top 10 Stocks for 2025, has jumped 41.2% year to date compared with the S&P 500 index’s 14.7% increase.
The Top 10 portfolio returned +26.47% this year (through the end of September 2025) vs. +14.84% for the S&P 500 index and +9.9% for the equal-weight version of the index.
The Top 10 portfolio returned +62.98% in 2024, vs. +25.04% for the S&P 500 index and +13% for the equal-weight version of the index. The portfolio had returned +25.15% in 2023 vs. +26.28% for the S&P 500 index.
Since 2012, the Top 10 portfolio has produced a cumulative return of +2,553.1% through the end of September 2025 vs. +545.2% for the S&P 500 index and +396.4% for the equal-weight version of the index. The portfolio has produced an average return of +26.6% in the period 2012 through September 30, 2025, vs. +13.1% for the S&P 500 index and +10.5% for the equal-weight version of the index.
Want the latest recommendations from Zacks Investment Research? Today, you can download 7 Best Stocks for the Next 30 Days. Click to get this free report
This article originally published on Zacks Investment Research (zacks.com).
| 14 min | |
| 19 min | |
| 1 hour | |
| 2 hours | |
| 3 hours | |
| 3 hours | |
| 4 hours | |
| Jul-20 | |
| Jul-20 | |
| Jul-20 | |
| Jul-20 | |
| Jul-20 | |
| Jul-20 | |
| Jul-20 |
Monster Stock Creates Add-On Entry After Powerful Earnings-Fueled Breakout
MNST
Investor's Business Daily
|
| Jul-20 |
Join thousands of traders who make more informed decisions with our premium features. Real-time quotes, advanced visualizations, alerts, and much more.
Learn more about Finviz Elite