|
|
|

|
|||||
|
|
|
The TJX Companies, Inc. (TJX) posted third-quarter fiscal 2026 results, wherein the top and bottom lines beat the Zacks Consensus Estimate. Both metrics also increased from the year-ago quarter.
The TJX Companies’ earnings per share (EPS) were $1.28, up 12% from the year-ago quarter. The metric also exceeded the Zacks Consensus Estimate of $1.22 per share.

The TJX Companies, Inc. price-consensus-eps-surprise-chart | The TJX Companies, Inc. Quote
Net sales came in at $15.1 billion, registering an increase of 7% year over year and surpassing the Zacks Consensus Estimate of $14.9 billion.
In the Marmaxx (the United States) division, the company’s net sales were $9,037 million, up 7% year over year. Net sales amounted to $2,539 million, up 8% year over year, in the HomeGoods (the United States) division. TJX Canada’s net sales were $1,492 million, up 8% from the figure reported in the year-ago period. TJX International’s (Europe & Australia) net sales were $2,049 million, up 9% year over year.
The company witnessed a 5% jump in consolidated comparable store sales, supported by strong performance in every division. Comparable store sales rose 6% at Marmaxx (the United States), 5% at HomeGoods (the United States), 8% at TJX Canada and 3% at TJX International (Europe & Australia).
The TJX Companies’ pretax profit margin was 12.7%, up 0.4 percentage points from the year-ago quarter’s level. The gross profit margin was 32.6%, up 1.0 percentage points year over year, mainly driven by an elevated merchandise margin and expense leverage on strong sales growth.
The company’s selling, general and administrative costs, as a percent of sales, were 20.1%, a 0.6 percentage point increase. The increase was attributed to higher store wages and payroll costs, a contribution to the TJX Foundation, and elevated incentive compensation accruals.
During third-quarter fiscal 2026, this Zacks Rank #3 (Hold) company’s store count increased 57, ending the quarter with 5,191 stores.
The TJX Companies ended the quarter with cash and cash equivalents of $4.6 billion, long-term debt of $1.9 billion and shareholders’ equity of $9.4 billion. It generated an operating cash flow of $3.7 billion during the first nine months of fiscal 2026.
During the quarter, the company returned $1.1 billion to its shareholders. The TJX Companies repurchased 4.2 million shares. It paid out $472 million in dividends in the same quarter. In February 2025, management approved a new stock repurchase program, authorizing up to an additional $2.5 billion in share buybacks. As of Nov. 1, 2025, TJX had approximately $1.9 billion remaining under this stock repurchase authorization.
Consolidated inventories (on a per-store basis) as of Nov. 1, 2025, increased 8% year over year on a reported and constant currency basis, reflecting strong buying opportunities and robust marketplace availability. Management noted that this positions the company well to offer a diverse mix of assortments and gifts for the holiday season.
For fiscal 2026, The TJX Companies now expects consolidated comparable store sales growth of 4%, up from the previously estimated 3% rise. The company also raised its pretax profit margin outlook to 11.6% compared with the prior range of 11.4% to 11.5%, and now anticipates earnings per share of $4.63 to $4.66, above the earlier forecast of $4.52 to $4.57.
For the fourth quarter of fiscal 2026, management expects consolidated comparable store sales to grow 2-3%. The company projects a pretax profit margin between 11.7% and 11.8%. The quarterly EPS is expected in the range of $1.33-$1.36.
The TJX Companies’ fourth-quarter and fiscal 2026 guidance assumes that existing U.S. tariffs on imports into the United States, as of Nov. 19, 2025, will stay in place through the rest of the fiscal year.
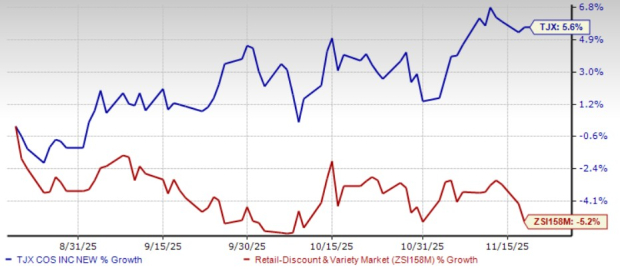
Shares of the company have gained 5.6% in the past three months against the industry’s decline of 5.2%.
Casey's General Stores, Inc. (CASY) operates convenience stores under the Casey's and Casey's General Store names in the United States. At present, Casey's General Stores sports a Zacks Rank of 2 (Buy). You can see the complete list of today’s Zacks #1 Rank (Strong Buy) stocks here.
The consensus estimate for Casey's General Stores’ current fiscal-year sales and earnings implies an increase of 9.6% and 10.5%, respectively, from the prior-year levels. CASY delivered a trailing four-quarter earnings surprise of 24.6%, on average.
Five Below, Inc. (FIVE) operates as a specialty value retailer in the United States. It carries a Zacks Rank #2 at present. Five Below delivered a trailing four-quarter earnings surprise of 50.5%, on average.
The Zacks Consensus Estimate for Five Below’s current fiscal-year sales and earnings implies an increase of 16.2% and 1.2%, respectively, from the prior-year levels.
Sally Beauty Holdings, Inc. (SBH) operates as a specialty retailer and distributor of professional beauty supplies. It holds a Zacks Rank of 2 at present. Sally Beauty delivered a trailing four-quarter earnings surprise of 10.3%, on average.
The consensus estimate for Sally Beauty’s current fiscal-year sales and earnings implies growth of 1.3% and 8.4%, respectively, from the year-ago figures.
Want the latest recommendations from Zacks Investment Research? Today, you can download 7 Best Stocks for the Next 30 Days. Click to get this free report
This article originally published on Zacks Investment Research (zacks.com).
| Jul-14 | |
| Jul-09 | |
| Jul-09 | |
| Jul-09 | |
| Jul-09 | |
| Jul-06 | |
| Jul-03 | |
| Jun-29 | |
| Jun-26 | |
| Jun-26 | |
| Jun-26 | |
| Jun-25 | |
| Jun-25 | |
| Jun-25 | |
| Jun-24 |
Join thousands of traders who make more informed decisions with our premium features. Real-time quotes, advanced visualizations, alerts, and much more.
Learn more about Finviz Elite