|
|
|

|
|||||
|
|
|
Morgan Stanley MS shares have surged 31.6% this year, outperforming the industry, the Zacks Finance sector and the S&P 500. While it fared better than its close peer, JPMorgan JPM, it lagged Goldman Sachs GS.
Price Performance
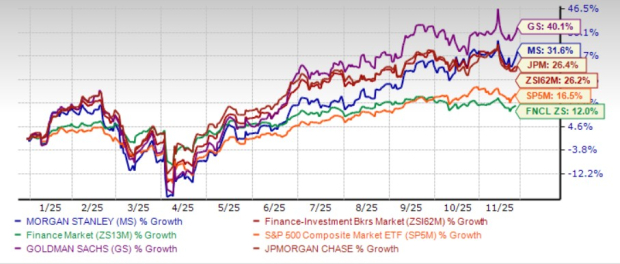
Bullish investor sentiments toward Morgan Stanley are largely driven by a rebound in global mergers & acquisitions (M&A). Global M&As in the third quarter of 2025 were impressive, rebounding from the lows recorded in April and May following President Donald Trump’s announcement of sweeping tariffs. As corporates adapt to the rapidly evolving geopolitical and macroeconomic scenarios, deal-making activity has picked up.
Can Morgan Stanley’s stock continue to benefit from the ongoing strength in M&A activity, or is a correction likely following the recent rally in share price? Let’s find out.
Increased Focus on Wealth & Asset Management Operations: Morgan Stanley has lowered its reliance on capital markets for income generation. It has now been focusing on expanding its wealth and asset management operations. The buyouts of Eaton Vance, E*Trade Financial and Shareworks are steps in this direction.
Further, in October, Morgan Stanley agreed to acquire EquityZen to tap the rapidly growing private markets landscape. These moves bolster the company’s diversification efforts, enhance stability and create a more balanced revenue stream across market cycles.
The wealth and asset management businesses’ aggregate contribution to total net revenues jumped to more than 55% in 2024 from 26% in 2010. In the first nine months of 2025, their aggregate contribution to net revenues was 53%.
The Wealth Management (WM) segment’s total client assets witnessed a five-year (2019-2024) compound annual growth rate (CAGR) of 18.1%, while the Investment Management (IM) segment’s total assets under management saw a CAGR of 24.7%. The uptrend for both metrics continued in the first nine months of 2025. The momentum is expected to continue as the operating environment becomes more favorable, given greater clarity on trade and tariffs.
Strategic Collaborations: MS’ partnership with Mitsubishi UFJ Financial Group, Inc. will likely continue to support its profitability. In 2023, the companies announced plans to deepen their 15-year alliance by merging certain operations within their Japanese brokerage joint ventures. The new partnership saw combined Japanese equity research, sales and execution services for institutional clients at Mitsubishi UFJ Morgan Stanley Securities and Morgan Stanley MUFG Securities. Also, their equity underwriting business has been rearranged between the two brokerage units. These efforts will solidify the company’s position in Japan’s market.
This has helped Morgan Stanley achieve record equity net revenues, particularly in Asia, through outperformance in prime brokerage and derivatives, led by solid client activity amid heightened volatility. The company’s Asia region revenues jumped 29% year over year to $7.27 billion in the first nine months of 2025.
Robust Balance Sheet Position: As of Sept. 30, 2025, Morgan Stanley had long-term debt of $324.1 billion, with $25.4 billion expected to mature over the next 12 months. The company’s average liquidity resources were $368.1 billion as of the same date.
Morgan Stanley’s capital distribution plans have been impressive. Following the clearance of the 2025 stress test, it announced an 8% hike in quarterly dividend to $1.00 per share. It reauthorized a multi-year share repurchase program of up to $20 billion (no expiration date). The company has increased its dividend five times in the last five years, with an annualized growth rate of 20.4%.
Given a solid liquidity position and earnings strength, Morgan Stanley is expected to be able to continue with efficient capital distribution activities, thereby enhancing shareholder value.
Over the past week, the Zacks Consensus Estimate for 2025 and 2026 earnings has been revised marginally upward to $9.76 and $10.32, respectively.
Estimate Revision Trend
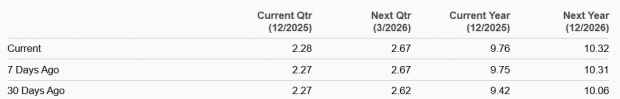
The Zacks Consensus Estimate for Morgan Stanley’s 2025 and 2026 earnings implies year-over-year growth of 22.8% and 5.8%, respectively.
From a valuation perspective, MS stock is currently trading at a forward 12-month price/earnings (P/E) of 16.11X. This is above the industry’s 14.09X.
Forward 12-Month P/E
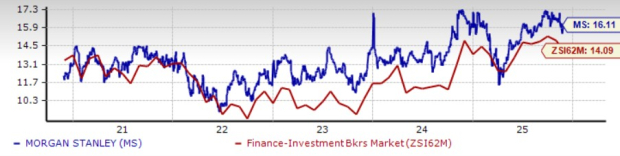
On the other hand, JPMorgan and Goldman Sachs have a forward P/E of 14.49X and 14.78X, respectively. This reflects that Morgan Stanley is expensive compared to its peers.
Morgan Stanley’s efforts to become less dependent on capital markets-driven revenues, inorganic expansion efforts/strategic alliances, along with declining rates, are expected to aid financials. Bullish analyst sentiments are another positive.
Additionally, Morgan Stanley’s growth initiatives have helped generate higher returns. This is demonstrated by the company’s return on equity (ROE) of 16.4% compared with the industry’s ROE of 12.51%.
Return on Equity
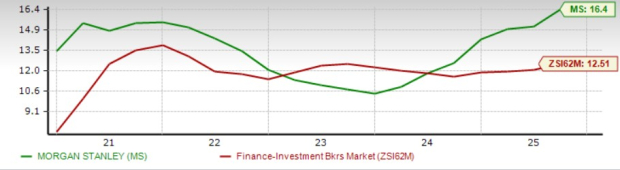
On the other hand, JPMorgan and Goldman have delivered ROE of 17.18% and 15.29%, respectively, reflecting cumulative sectoral tailwind over the years.
However, rising expenses will likely hurt the company’s profitability in the near term. High reliance on trading revenues is another headwind. Further, a stretched valuation poses concern.
Nonetheless, an enhanced deal-making backdrop will likely drive Morgan Stanley’s financials. Also, supported by a solid balance sheet position, the company is expected to be able to meet near-term debt obligations, even if the economic situation worsens.
Hence, this seems to be the right time to buy Morgan Stanley shares before they soar further.
At present, the company sports a Zacks Rank #1 (Strong Buy). You can see the complete list of today’s Zacks #1 Rank stocks here.
Want the latest recommendations from Zacks Investment Research? Today, you can download 7 Best Stocks for the Next 30 Days. Click to get this free report
This article originally published on Zacks Investment Research (zacks.com).
| 9 hours | |
| 9 hours | |
| 10 hours | |
| 11 hours | |
| 12 hours | |
| 12 hours | |
| 14 hours | |
| 15 hours | |
| 15 hours | |
| 16 hours | |
| 16 hours | |
| 16 hours | |
| Apr-08 | |
| Apr-08 | |
| Apr-08 |
Join thousands of traders who make more informed decisions with our premium features. Real-time quotes, advanced visualizations, alerts, and much more.
Learn more about Finviz Elite