|
|
|

|
|||||
|
|
|
On January 15th, I wrote an article titled,“Repeat of History? Why Silver May Be Forming a Blow-Off Top?" Friday, silver and the iShares Silver ETF (SLV) each dropped nearly 40% intraday, marking one of the precious metal’s worst drops over the past century.

“Wall Street never changes, the pockets change, the suckers change, the stocks change, but Wall Street never changes, because human nature never changes.” ~ Jesse Livermore
While I don’t claim to have a crystal ball and I am only human and often incorrect in my analysis, studying silver’s illustrious history provided me with critical clues. Some of the clues that a blow-off top was about to occur included:
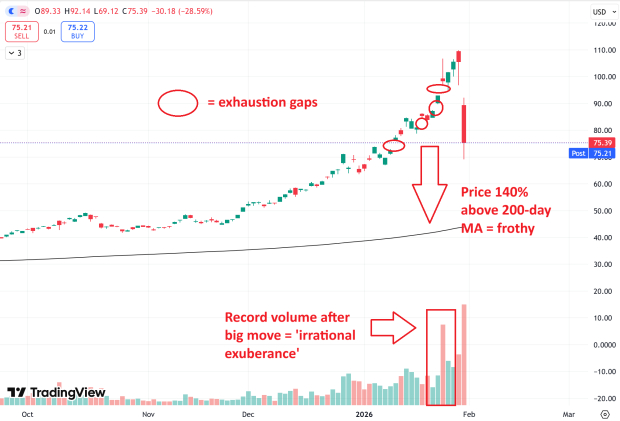
· Distance from 200-day moving average: Silver was more than 100% above its 200-day moving average. Historically, such a wide distance from the 200-day has been unsustainable.
· Exhaustion gaps emerged: An exhaustion gap occurs when a stock or ETF gaps higher in overnight trading after a sustained price move. Prior to silver’s plunge, the SLV ETF flashed four classic exhaustion gaps.
· Record trading volume: SLV and silver proxies like the Sprott Physical Silver Trust (PSLV), Global Silver Miners ETF (SIL), and the ProShares Ultra Silver ETF (AGQ), flashed record trading volumes. Record trading volumes after a large price advance are a classic signal that a trade has become obvious to the crowd and “irrational exuberance” has kicked in.
· 261.8% Fib level: Fibonacci extensions are used by technicians to identify price targets. Silver touched the 261.8% fib extension target (nearly to the penny) before dropping.

While the losses in silver were due to a combination of profit-taking, a rebounding U.S. dollar, and a new Fed Chair, the price action told the story in advance.
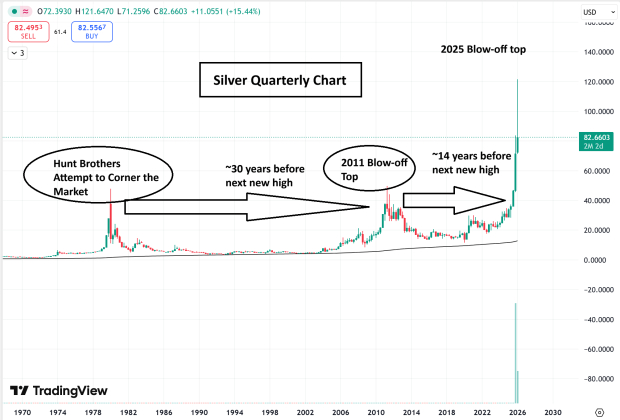
If history is any guide (and it has been a great one for silver), silver has just witnessed a multi-year top. Silver had two similar blow-off tops:
1. Hunt Brothers: In 1980, silver topped when the Hunt Brothers attempted (but failed) to corner the silver market. Silver would not breach the spike high for another 30 years.
2. Early 2000s Commodity Bull: After the early 2000s, China-driven bull market, silver again had a screaming bull market that ended in 2011 in blow-off top form. Silver would not make another high for 13 years.
Over the long-term, silver is often moderately correlated with equities, as a strong economy drives industrial demand. Over the past two years, the correlation between silver and equities has grown closer as silver is used in fast-growing technologies such as semiconductors, electric vehicles, and AI data centers.
After silver topped in 1980, markets were lower and more volatile for a few weeks before bottoming. However, with the silver and equity correlation having grown closer in recent months, investors may want to look at 2011 as a possible precedent. In 2011, the S&P 500 fell ~11% in five trading sessions after silver topped.

Bottom Line
The recent 40% intraday plunge in silver isn’t just a localized event; it is a stark reminder that human nature – and its tendency toward “irrational exuberance” – remains the market’s ultimate constant. As silver’s industrial ties to the AI sector have strengthened, its downfall may no longer be a side show but instead a leading indicator for stocks.
Want the latest recommendations from Zacks Investment Research? Today, you can download 7 Best Stocks for the Next 30 Days. Click to get this free report
This article originally published on Zacks Investment Research (zacks.com).
| Jul-07 | |
| May-21 | |
| May-07 | |
| May-06 | |
| May-02 | |
| Apr-20 | |
| Apr-09 | |
| Mar-30 | |
| Mar-24 | |
| Mar-17 | |
| Mar-11 | |
| Mar-11 | |
| Mar-09 | |
| Mar-05 | |
| Mar-05 |
Join thousands of traders who make more informed decisions with our premium features. Real-time quotes, advanced visualizations, alerts, and much more.
Learn more about Finviz Elite