|
|
|

|
|||||
|
|
|
The U.S. housing market remains constrained by elevated mortgage rates and limited inventory, creating a complex backdrop for digital real estate platforms. Against this environment, Opendoor Technologies Inc. OPEN and Zillow Group, Inc. Z are pursuing distinct models to capture transaction flow and long-term share. While Opendoor is sharpening its asset-light, data-driven home-flipping platform under its “Opendoor 2.0” framework, Zillow is doubling down on its housing super app strategy, integrating search, financing and touring capabilities. For investors, the debate centers on which approach offers better risk-adjusted upside. Let’s analyze.
Opendoor is building momentum through its “Opendoor 2.0” transformation, centered on scaling acquisitions, improving unit economics and accelerating resale velocity. In the fourth quarter of 2025, the company increased home purchases 46% sequentially to 1,706 homes, marking an inflection from its prior high-spread strategy. Management highlighted that the October 2025 acquisition cohort is tracking as the most profitable October cohort in company history on a contribution margin basis, with more than 50% sold through or under resale contract and materially improved velocity versus prior years.
Product innovation is playing a central role in this shift. The company expanded its Cash Plus offering, giving sellers greater flexibility while reducing capital at risk. Opendoor Checkout is live in 40 states, embedding mortgage preapproval, buyer protections and streamlined digital closing tools. Geographic coverage has also expanded significantly, with availability now extending to nearly all homeowners across the Lower 48 states. At the same time, AI-driven underwriting, pricing and operational automation initiatives are improving conversion, enhancing pricing accuracy, accelerating resale velocity and lowering infrastructure costs.
Operational discipline is also evident. Fixed operating expenses declined sequentially and year over year; hosting and infrastructure costs were substantially reduced; and the percentage of homes on the market for more than 120 days improved meaningfully from the prior quarter. Management reiterated its objective of achieving adjusted net income profitability on a 12-month go-forward basis by the end of 2026.
However, near-term financial performance continues to reflect the transition phase as legacy inventory is cleared from the balance sheet. Revenues declined sequentially in the fourth quarter due to lower starting inventory levels and the accelerated sell-through of older homes. Contribution margins were pressured by the mix of previously acquired inventory, and adjusted EBITDA remained negative. Looking ahead, management expects sequential revenue decline in the first quarter as acquisitions ramp and inventory is rebuilt under the new model.
Zillow continues to focus on scaling its integrated “housing super app” model aimed at capturing more of the residential transaction journey across buying, selling, renting and financing. The company is executing on its strategy of deepening connections between consumers and real estate professionals while expanding adjacent services to strengthen its ecosystem and drive higher transaction capture.
During the fourth quarter 2025, management highlighted continued momentum in its Residential segment, supported by improvements in Premier Agent performance and enhanced digital shopping tools. Product innovations — including AI-enabled search functionality, improved touring workflows and better partner integrations — are designed to increase engagement and conversion within Zillow’s platform. At the same time, the Rentals business remains a key growth pillar, benefiting from expanded multifamily relationships and stronger listing inventory.
Zillow is also advancing its integrated transaction capabilities. Growth in Zillow Home Loans and tighter coordination between financing, touring and agent connections are aimed at improving attachment rates and increasing the share of transactions that remain within Zillow’s ecosystem. Management emphasized ongoing product refinement and operational discipline to enhance partner productivity and consumer experience.
However, the company continues to operate within a constrained housing backdrop marked by affordability pressures and mortgage rate volatility. Despite the flexibility of its capital-light marketplace model, Zillow continues to operate in a housing environment where transaction volumes remain materially below historical levels, constraining near-term revenue acceleration and leaving performance heavily dependent on a broader market recovery.
The Zacks Consensus Estimate for Opendoor’s 2026 sales suggests a year-over-year decline of 1.5%, while earnings per share (EPS) indicate a rise of 42.3% in 2026. In the past 60 days, earnings estimates for 2026 have declined 15.4%.
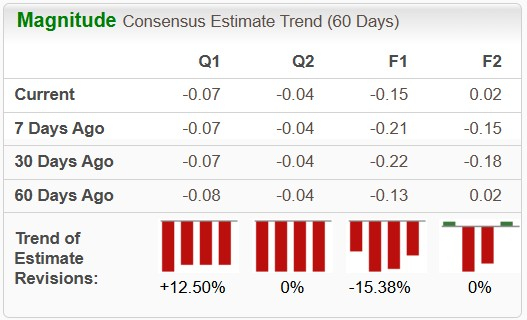
The Zacks Consensus Estimate for Zillow’s 2026 sales and EPS suggests year-over-year increases of 15.1% and 28.1%, respectively. In the past 60 days, earnings estimates for 2026 have declined 4.1%.

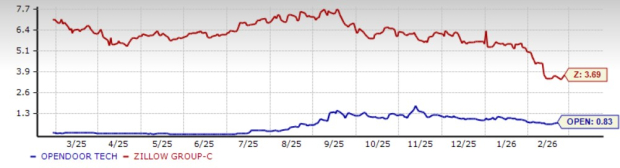
Over the past year, Opendoor stock has skyrocketed 278.3%, vastly outperforming both the broader Zacks Computer and Technology sector and the S&P 500. By contrast, Zillow stock has lost 38.9% during the same period, lagging its peers and the benchmark.

Opendoor is trading at a forward 12-month price-to-sales (P/S) ratio of 0.83, below the industry average of 3.87, over the last year. Z’s forward 12-month P/S multiple sits at 3.69 over the same time frame.
Opendoor emerges as the more aggressive upside play at this stage, supported by its scaled acquisition ramp, expanding product ecosystem and sharper focus on contribution margins under the “Opendoor 2.0” framework. The company’s structural reset — including disciplined underwriting and faster resale velocity — is positioning the model for improved operating leverage as housing activity stabilizes.
While Zillow continues to benefit from its capital-light marketplace structure, diversified revenue streams and integrated housing super app strategy, its premium valuation and reliance on a broader recovery in transaction volumes may temper near-term upside relative to peers.
With a more pronounced valuation gap and greater sensitivity to improvements in spreads and resale momentum, Opendoor appears better positioned to deliver outsized returns in a housing recovery scenario.
OPEN and Z carry a Zacks Rank #3 (Hold) each at present. You can see the complete list of today’s Zacks #1 Rank (Strong Buy) stocks here.
Want the latest recommendations from Zacks Investment Research? Today, you can download 7 Best Stocks for the Next 30 Days. Click to get this free report
This article originally published on Zacks Investment Research (zacks.com).
| 1 hour |
Mortgage and refinance rates today, Wednesday, July 22, 2026: Interest creeps up
Z
Yahoo Personal Finance
|
| Jul-21 | |
| Jul-21 | |
| Jul-21 |
Mortgage and refinance interest rates today, Tuesday, July 21, 2026: Inching lower
Z
Yahoo Personal Finance
|
| Jul-20 | |
| Jul-19 | |
| Jul-18 | |
| Jul-17 |
Mortgage and refinance interest rates today, Friday, July 17, 2026: Rates are mixed today
Z
Yahoo Personal Finance
|
| Jul-16 |
Mortgage and refinance interest rates today, Thursday, July 16, 2026: Rates on the rise
Z
Yahoo Personal Finance
|
| Jul-15 | |
| Jul-15 | |
| Jul-14 | |
| Jul-14 |
Mortgage & refinance interest rates today, Tuesday, July 14, 2026: Rates mixed this morning
Z
Yahoo Personal Finance
|
| Jul-14 |
Mortgage & refinance rates today, Tuesday, July 14, 2026: Rates mixed this morning
Z
Yahoo Personal Finance
|
| Jul-13 |
Join thousands of traders who make more informed decisions with our premium features. Real-time quotes, advanced visualizations, alerts, and much more.
Learn more about Finviz Elite