|
|
|

|
|||||
|
|
|
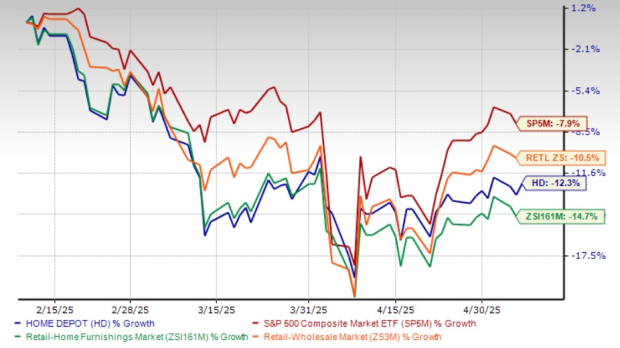
The Home Depot Inc. HD stock has lost 12.3% in the past three months, marking an outperformance from the broader industry’s 14.7% fall. However, it has underperformed the Retail-Wholesale sector and the S&P 500’s declines of 10.5% and 7.9%, respectively.
Despite the dip, the HD stock performance is better than its industry peers like Lowe’s Companies Inc. LOW, Williams-Sonoma WSM and Haverty Furniture Companies HVT, which have lost 12.9%, 24.7% and 14.4%, respectively, in the past three months.
At the current price of $362.75, the HD stock trades at a discount of 17.4% to its 52-week high of $439.37. The current stock price reflects a 12% premium from its 52-week-low mark.
HD trades above its 200-day moving averages, signaling strong upward momentum and price stability. This technical strength indicates positive market sentiment and confidence in the company's financial health and prospects.
Home Depot’s stock performance shows mixed sentiments based on its comparisons to industry, sector and the market as a whole, as well as its historical benchmarks. Let us find out how we should play the stock.
While HD’s recent price decline may raise concerns among investors, its ongoing strategic initiatives continue to draw favorable sentiment. That said, evaluating whether the stock is a smart buy at current levels requires a closer look at both its growth levers and operational pressures.
Home Depot has delivered consistent growth by capitalizing on its leadership in the home improvement space and executing its “One Home Depot” strategy. This plan emphasizes investments in technology, supply-chain modernization and digital transformation. The company’s ability to cater to both DIY customers and professional contractors has been instrumental in maintaining customer loyalty and broadening its market appeal.
With a vast store network, a comprehensive product offering and a growing online presence, HD is well-positioned to meet evolving consumer demands. Its interconnected retail model and strong tech infrastructure have driven web traffic and supported the buildout of a scalable Pro ecosystem, solidifying its competitive advantage.
However, the company continues to grapple with ongoing challenges, including softened demand and pressure in high-ticket discretionary categories, factors that have impacted both total and comparable sales. For fiscal 2025, Home Depot projects a 2.8% year-over-year increase in sales, suggesting a slowdown from the 4.5% growth reported in fiscal 2024. Comparable sales are expected to rise just 1%, while the gross margin is forecast to remain flat at 33.4%. The operating margin is projected at 13%, with an adjusted figure of 13.4% — both slightly lower than the prior year.
Macroeconomic pressures are also weighing on profitability. Elevated interest rates, which surged in early 2024, continue to impact consumer behavior and financing costs. The company expects net interest expenses to increase to $2.2 billion in fiscal 2025 from the $2.1 billion reported in the prior year.
As a result, Home Depot anticipates a 3% decline in GAAP earnings per share and a 2% year-over-year fall in adjusted EPS. Despite these near-term headwinds, the company remains committed to its long-term growth strategy, reinforcing its dominant position in the home improvement sector.
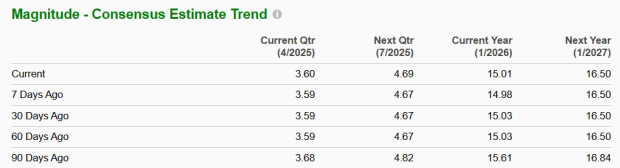
Home Depot’s estimates for fiscal 2025 have shown an uptrend in the past seven days. The Zacks Consensus Estimate for HD’s fiscal 2025 earnings per share rose 0.2% in the last seven days. The upward revision in earnings estimates indicates that analysts have continued faith in the company’s growth potential. For fiscal 2026, the Zacks Consensus Estimate for earnings per share was unchanged in the last 30 days. (See the Zacks Earnings Calendar to stay ahead of market-making news.)
For fiscal 2025, the Zacks Consensus Estimate for HD’s sales implies 2.7% year-over-year growth, while that for earnings per share suggests a decline of 1.5%. The consensus mark for fiscal 2026 sales and earnings indicates 4.5% and 9.9% year-over-year growth, respectively.
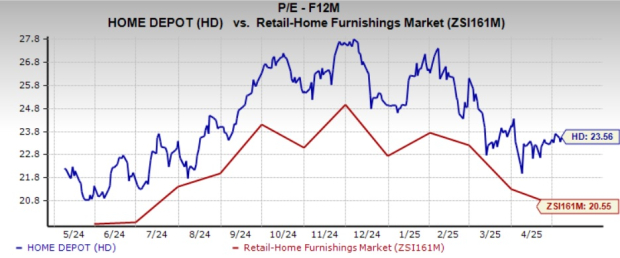
While the HD stock lost some steam in the past three months, the company is currently trading at a forward 12-month P/E multiple of 23.56X, exceeding the industry average of 20.55X and the S&P 500’s average of 20.65X. At current levels, Home Depot’s stock valuation looks expensive.
At 23.56X forward 12-month P/E, HD is trading at a valuation much higher than its competitors. Its competitors, such as Lowe’s, Williams-Sonoma and Haverty Furniture, are trading at more reasonable multiples. Lowe’s, Williams-Sonoma and Haverty Furniture have forward 12-month P/E ratios of 17.79X, 18.28X and 11.11X — all lower than Home Depot. At such levels, HD’s stock valuation seems out of step with its growth trajectory.
The premium valuation indicates that investors have high expectations for HD’s performance and growth potential. However, the valuation premium may not be justified if the company fails to deliver on its long-term growth targets. Investors may be skeptical about buying the stock at these premium levels and may wait for a better entry point.
Home Depot stock’s downward trajectory, premium valuation and its cautious outlook raise valid concerns for investors. While HD’s earnings guidance is disappointing, growth initiatives like the "One Home Depot" plan and strong Pro customer sales position it well for the long term.
However, caution is warranted, given the prevailing headwinds, which call for a thorough evaluation of recent developments before making investment decisions. As it stands, with a Zacks Rank #4 (Sell), Home Depot remains a stock to avoid until clearer recovery indicators emerge.
You can see the complete list of today's Zacks #1 Rank (Strong Buy) stocks here.
Want the latest recommendations from Zacks Investment Research? Today, you can download 7 Best Stocks for the Next 30 Days. Click to get this free report
This article originally published on Zacks Investment Research (zacks.com).
| Jul-27 | |
| Jul-23 | |
| Jul-20 | |
| Jul-17 | |
| Jul-17 | |
| Jul-15 | |
| Jul-15 | |
| Jul-15 | |
| Jul-14 | |
| Jul-13 | |
| Jul-10 | |
| Jul-10 | |
| Jul-10 | |
| Jul-10 | |
| Jul-10 |
Join thousands of traders who make more informed decisions with our premium features. Real-time quotes, advanced visualizations, alerts, and much more.
Learn more about Finviz Elite