|
|
|

|
|||||
|
|
|
The market wasn’t particularly excited about Walmart’s WMT results last Thursday, but we think the retail leader did an excellent job in an otherwise challenging operating environment.
The positives of the Walmart report were better-than-expected comps, the company’s domestic ecommerce business turning profitable for the first time, and its ability to provide guidance despite the all-around operating uncertainty.
On the negative side, Walmart’s ‘general merchandise’ comps were ‘slightly negative’, with weakness in electronics, home, and sporting goods offsetting positive momentum from toys, automotive, and kids apparel. Management had told the investor community about this category's soft start to the quarter at the April investor meeting, with trends improving later in the period.
The general merchandise category has been weak post-COVID, with some early signs of life in recent quarters. But the Walmart results show that the near-term outlook for this category is unlikely to improve in any meaningful way soon. This is a net negative for Target TGT, which has a much bigger exposure to this category than Walmart.
Target will report quarterly results before the market’s open on Wednesday, May 21st. Other major retailers reporting results this week include Home Depot HD, Lowe’s LOW, Deckers Outdoors DECK, and others.
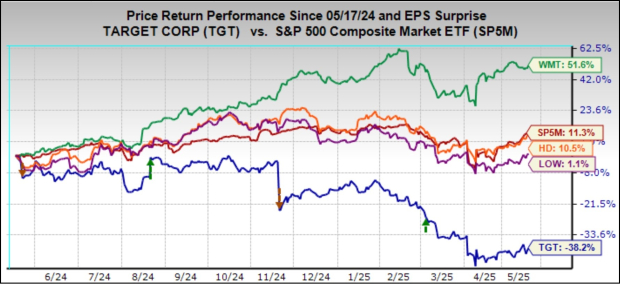
Target shares have been big-time laggards lately, with the stock losing more than a quarter of its value this year, handily lagging the broader market (flat in the year-to-date period) and Walmart (up more than +8%). The chart below shows the one-year performance of Target shares (down -38.2%) relative to Walmart (up +51.6%)
Target is expected to report $1.68 in EPS on $24.42 billion in sales, representing year-over-year changes of -17.2% and -0.47%. Estimates for the period have been steadily on a downtrend, with today’s $1.68 estimate down from $1.74 a week ago and $1.81 two months back. Same-store sales are expected to be down -1.7% this period, which would compare to +1.5% in the preceding quarter and +0.3% in the quarter before that.
In addition to continued weak demand trends for Target’s discretionary-heavy merchandise, these products also tend to be more trade-exposed relative to food and other traditional grocery merchandise. Walmart claims that two-thirds of its merchandise is domestically sourced, limiting its exposure to the unsettled tariff situation. Between Walmart and Target, the latter is far more vulnerable to the unfavorable global trade regime.
The all-around negative sentiment on Target shares and weak expectations suggest to us limited downside risk for the retailer due to this quarterly release. But the stock had reacted negatively to each of the last two quarterly releases.
As with Target, the operating environment for Home Depot and Lowe’s remains difficult. But unlike Target, the headwind for these home-improvement retailers is tied to the interest rate backdrop. However, weakness around discretionary spending is also at play here, as residential remodeling and the associated big-ticket purchases like appliances, cabinets, flooring, etc., are basically discretionary spending categories.
Concerning the rates, the elevated levels despite the U.S. Fed’s easing policy bias have proved a big disappointment for the broader housing space, including the home-improvement retailers. Hard to accurately decipher the factors driving the strength in treasury yields, but the potential inflationary effects of the emerging tariffs regime and the country’s fiscal situation appear to be the culprits here.
Whatever the reason, yields remain high, keeping mortgage rates elevated, which is keeping a lid on housing-related activities. The read-through for Home Depot and Lowe’s of this interest rate discussion is that mortgage rates may not come down as fast or as much as expected in a Fed easing cycle.
This means that trends in the existing home sales space are unlikely to meaningfully improve over the near term, though one would expect the medium- to long-term view to be positive on economic and demographic grounds.
These favorable fundamentals include the record homeowners’ equity in excess of $30 trillion, an aging housing stock (more than 50% of homes are more than 40 years old), and a housing shortage. All of these point towards the favorable long-term fundamentals of Home Depot’s and Lowe’s markets.
Home Depot and Lowe’s have executed well in a difficult environment, and we don’t expect any major surprises in these releases. The China tariff pause is a net positive, but it points to challenges in the second half of the year, when activity levels were expected to start improving. Most activity at Home Depot and Lowe’s has been geared to repair and replace, with big-ticket purchases that typically accompany residential remodel projects on hold.
Home Depot, which reports before the market’s open on Tuesday, May 20th, is expected to earn $3.59 per share on $39.33 billion in revenues, representing year-over-year changes of -1.1% and +8%.
Home Depot’s comps had turned positive for the first time after eight quarters of declines in the preceding period, increasing +0.8% vs. estimates of -1.2%. The expectation is for same-store sales of +0.28% for this quarter. Lowe’s comps had also turned positive in the preceding quarter after remaining negative as long as Home Depot’s, but are expected to be down -1.99% again this quarter.
With respect to the Retail sector 2025 Q1 earnings season scorecard, we now have results from 21 of the 33 retailers in the S&P 500 index. Regular readers know that Zacks has a dedicated stand-alone economic sector for the retail space, unlike the placement of the space in the Consumer Staples and Consumer Discretionary sectors in the Standard & Poor’s standard industry classification.
The Zacks Retail sector includes Walmart, Target, and other traditional retailers, online vendors like Amazon (AMZN), and restaurant players. The 21 Zacks Retail companies in the S&P 500 index that have reported Q1 results already belong mostly to the ecommerce and restaurant industries, though Walmart’s results are included in that number.
Total Q1 earnings for these 21 retailers that have reported are up +16.7% from the same period last year on +5.4% higher revenues, with 57.1% beating EPS estimates and only 47.6% beating revenue estimates.
The comparison charts below put the Q1 beats percentages for these retailers in a historical context.
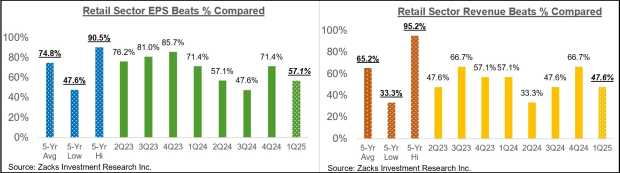
As you can see above, the EPS and revenue beats percentages for these companies are tracking significantly below the historical averages for this group of companies.
With respect to the elevated earnings growth rate at this stage, we like to show the group’s performance with and without Amazon, whose results are among the 21 companies that have already reported. As we know, Amazon’s Q1 earnings were up +42.6% on +8.6% higher revenues, beating EPS and top-line expectations.
As we all know, the digital and brick-and-mortar operators have been converging for some time now. Amazon is now a decent-sized brick-and-mortar operator after Whole Foods, and Walmart is a growing online vendor. As we noted in the context of discussing Walmart’s upcoming results, the retailer is steadily becoming a big advertising player, thanks to its growing digital business. This long-standing trend got a huge boost from the COVID-19 lockdowns.
The two comparison charts below show the Q1 earnings and revenue growth relative to other recent periods, both with Amazon’s results (left side chart) and without Amazon’s numbers (right side chart)
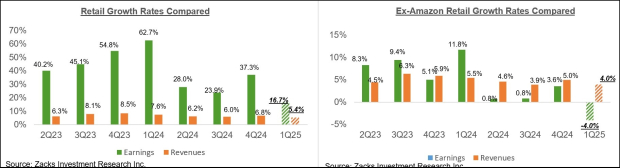
As you can see above, earnings for the group outside of Amazon are down -4% on a +4% top-line gain, which points to margin pressures for the group.
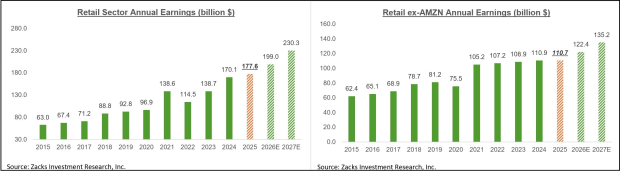
The chart below shows the sector’s earnings picture on an annual basis, with the right-hand chart showing the Zacks Retail sector’s earnings excluding Amazon. As you can see, the sector’s entire earnings growth in recent years has been solely due to Amazon, with profits essentially flat since 2021.
Key Earnings Reports This Week
We have over 100 companies on deck to report results this week, including 15 S&P 500 members. In addition to Target, Home Depot, and Lowe’s, the notable companies reporting this week include Ralph Lauren, TJX Companies, Toll Brothers, and China’s Baidu.
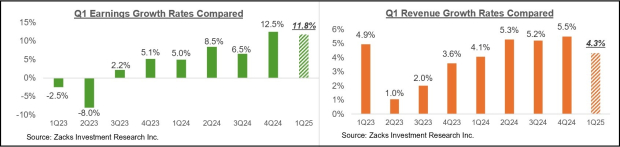
The Q1 Earnings Scorecard
Through Friday, May 16th, we have seen Q1 results from 462 S&P 500 members, or 92.4% of the index’s total membership. The Q1 reporting cycle has ended for 9 of the 16 Zacks sectors. Total earnings for these 462 index members are up +11.8% from the same period last year on +4.3% revenue gains, with 74.2% of the companies beating EPS estimates and 62.1% beating revenue estimates.
The comparison charts below put the Q1 earnings and revenue growth rates for these index members in a historical context.
The comparison charts below put the Q1 EPS and revenue beats percentages in a historical context.
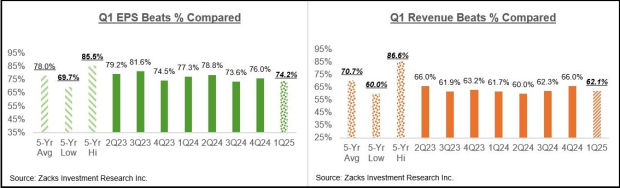
As you can see here, the EPS and revenue beats percentages are tracking below historical averages, with the Q1 EPS beats percentage of 74.2% comparing to the average for the same group of 78% over the preceding 20-quarter period (5 years). The Q1 revenue beats percentage of 62.1% compares to the 5-year average for this group of index members of 70.7%.
Is the Turnaround in Estimates for Real?
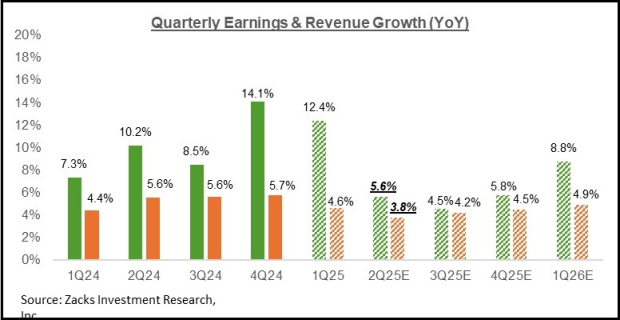
Looking at Q1 as a whole, combining the actuals from the 462 S&P 500 members with estimates for the still-to-come companies, the expectation is that earnings will be up +12.4% from the same period last year on +4.6% higher revenues, which would follow the +14.1% earnings growth on +5.7% revenue gains in the preceding period.
The chart below shows current earnings and revenue growth expectations for 2025 Q1 in the context of where growth has been over the preceding four quarters and what is currently expected for the following three quarters.
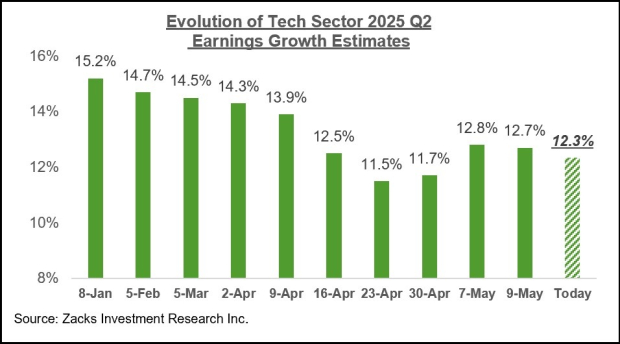
We have been flagging consistently in recent weeks that estimates for the current period (2025 Q2) have been coming down, as you can see in the chart below.
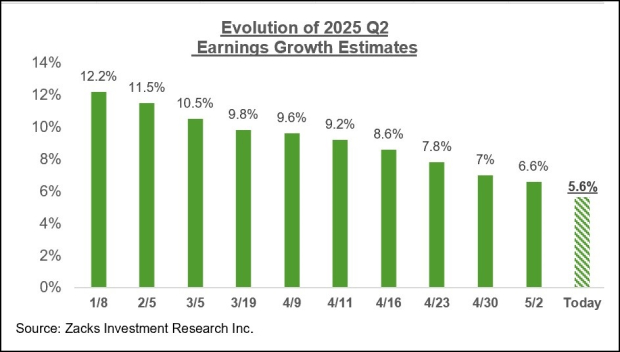
The magnitude of cuts to 2025 Q2 estimates since the start of the period is bigger and more widespread relative to what we have become used to seeing in the post-COVID period. But you have likely noticed in recent weeks that we have been pointing to signs of stabilization in Tech sector estimates for Q2 and full-year 2025.
The chart below shows how Tech sector earnings estimates for the period appear to have bottomed two weeks back and have, in fact, actually started going back up.
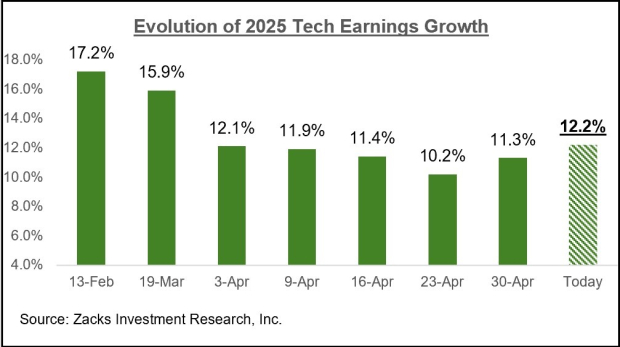
We see this same trend at play in annual estimates as well. The chart below shows the Tech sector’s evolving earnings expectations for full-year 2025
As favorable as this development on the revisions front is, we are hesitant to claim that the process of downward adjustments to estimates has run its course. After all, it is possible that analysts had ended up cutting estimates more than what was needed after the April 2nd tariff announcements.
The subsequent management commentary on the Q1 earnings calls may have made analysts realize this reality, and this modest uptick in estimates is a result of that realization. That said, if the trend continues in the coming weeks, it will be hard to interpret this development any other way than a clear sign that the earnings picture has clearly stabilized and started to strengthen.
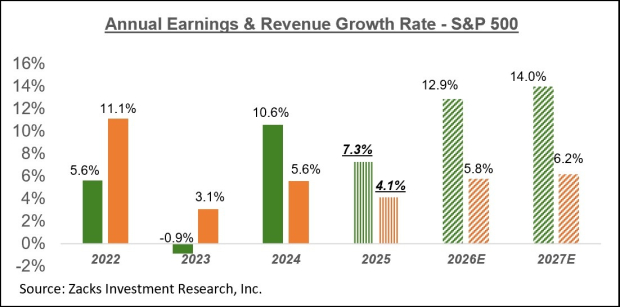
The chart below shows the overall earnings picture on a calendar-year basis.
For more details about the evolving earnings picture, please check out our weekly Earnings Trends report here >>>> Making Sense of the Evolving Earnings Picture
Want the latest recommendations from Zacks Investment Research? Today, you can download 7 Best Stocks for the Next 30 Days. Click to get this free report
This article originally published on Zacks Investment Research (zacks.com).
| 5 hours | |
| 7 hours | |
| 9 hours | |
| 13 hours | |
| 16 hours | |
| Feb-14 | |
| Feb-14 | |
| Feb-14 | |
| Feb-14 | |
| Feb-13 | |
| Feb-13 | |
| Feb-13 | |
| Feb-13 | |
| Feb-13 |
Walmart Stock Delivers Returns By Riding Change. This Investor Explains How.
WMT
Investor's Business Daily
|
| Feb-13 |
Join thousands of traders who make more informed decisions with our premium features. Real-time quotes, advanced visualizations, backtesting, and much more.
Learn more about FINVIZ*Elite