|
|
|

|
|||||
|
|
|
Last Friday, the three most widely followed benchmark indexes closed a losing week. The Dow Jones Industrial Average, the Nasdaq Composite and the S&P 500 declined 2.5%, 2.5% and 2.6%, respectively.
Markets remained volatile last week, adversely impacted by renewed trade tensions and rising bond yields. President Trump's threats of tariffs on European Union goods and levies on foreign-made iPhones, particularly affecting Apple, led to significant market declines. Investor concerns were further heightened by a spike in U.S. Treasury yields, with the 30-year yield surpassing 5% for the first time since 2023, amid fears of increasing federal deficits.
However, in response to the market turmoil, President Trump extended the deadline for imposing tariffs on EU imports from June 1 to July 9, 2025, following a conversation with European Commission President Ursula von der Leyen. It remains to be seen whether this relief is temporary or whether it has a lasting impact.
Regardless of market conditions, we, here at Zacks, provide investors with unbiased guidance on how to beat the market.
As usual, Zacks Research guided investors over the past three months with its time-tested methodologies. Given the prevailing market uncertainty, you may want to look at our feats to prepare better for your next action.
Here are some of our key achievements:
Shares of Inter & Co, Inc. INTR have gained 27.8% (versus the S&P 500’s 0.9% increase) since it was upgraded to a Zacks Rank #2 (Buy) on March 25.
Another stock, GE Aerospace GE, which was also upgraded to a Zacks Rank #2 on March 24, has returned 14% (versus the S&P 500’s 2.7% increase) since then.
A hypothetical portfolio of Zacks Rank # 1 (Strong Buy) stocks returned -8.32% in 2025 (through May 5th) vs. -5.35% for the S&P 500 index.
This portfolio returned +22.4% in 2024, vs. +28% for the S&P 500 index and +19.9% for the equal-weight version of the S&P 500 index.
This hypothetical portfolio returned +20.65% in 2023 vs. +24.83% for the S&P 500 index and +15% for the equal-weight S&P 500 index.
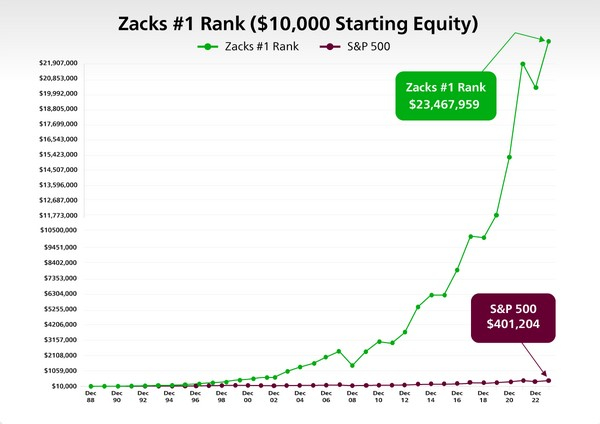
The Zacks Model Portfolio - consisting of Zacks Rank #1 stocks – has outperformed the S&P index by more than 12 percentage points since 1988 (through May 5th, 2025, the Zacks # 1 Rank stocks generated an annualized average return of +23.5% vs. +11% for the S&P 500 index).
You can see the complete list of today’s Zacks Rank #1 stocks here >>>
Check Inter’s historical EPS and Sales here>>>
Check GE Aerospace’s historical EPS and Sales here>>>
Shares of Contango Ore, Inc. CTGO and Heritage Insurance Holdings, Inc. HRTG have advanced 83.1% (versus the S&P 500’s 3.2% rise) and 58.8% (versus the S&P 500’s 4.3% rise), since their Zacks Recommendation was upgraded to Outperform on April 2 and March 31, respectively.
While the Zacks Rank is our short-term rating system that is most effective over the one- to three-month holding horizon, the Zacks Recommendation aims to predict performance over the next 6 to 12 months. However, just like the Zacks Rank, the foundation for the Zacks Recommendation is trends in earnings estimate revisions.
The Zacks Recommendation classifies stocks into three groups — Outperform, Neutral and Underperform. While these recommendations are determined quantitatively, our analysts have the flexibility to override them for the 1100+ stocks they closely follow based on their better judgment of factors such as valuation, industry conditions and management effectiveness than the quantitative model.
To access our research reports with Zacks Recommendations for the 1100+ stocks we cover, click here>>>
Shares of Palantir Technologies Inc. PLTR, which belongs to the Zacks Focus List, have gained 45.5% over the past 12 weeks. The stock was added to the Focus List on March 26, 2024. Another Focus-List holding, CACI International Inc CACI, which was added to the portfolio on December 2, 2015, has returned 37.5% over the past 12 weeks. The S&P 500 has declined 1% over this period.
The Focus List portfolio has returned -3.23% through April 30th, 2025, vs. -4.92% for the S&P 500 index and -2.88% for the equal-weight version of the index.
The 50-stock Zacks Focus List portfolio returned +18.41% in 2024 vs. +25.04% for the S&P 500 index and +13% for the equal-weight S&P 500 index. The portfolio had returned +29.54% in 2023 vs. +26.28% for the S&P 500 index and +13.61% for the equal-weight S&P 500 index. In 2022, the portfolio returned -15.2% vs. the S&P 500 index’s -17.96%.
Since 2004, the Focus List portfolio has produced an annualized return of +11.33% (through the end of April 2025). This compares to a +9.95% annualized return for the S&P 500 index and +9.17% for the equal-weight version of the index in the same time period.
The portfolio lags the broader market over the preceding year (+10.74% vs. +12.12%), but leads over the preceding 3-year (+47.29% vs. +41.16%), 5-year (+122.94% vs. +106.51%), and 10-year (+225.28% vs. +219.55%) periods.
Unlock all of our powerful research, tools and analysis, including the Focus List, Zacks #1 Rank List, Equity Research Reports, Zacks Earnings ESP Filter, Premium Screener and more, as part of Zacks Premium. Gain full access now >>
Monster Beverage Corporation MNST, a component of our Earnings Certain Admiral Portfolio (ECAP), has jumped 22% over the past 12 weeks. Cencora, Inc. COR has followed Monster Beverage with 17.4% returns.
The Zacks Earnings Certain Admiral Portfolio (ECAP), which consists of 30 concentrated, ultra-defensive, long-term Buy-and-Hold stocks, returned +3.20% in the first quarter of 2025 vs. the S&P 500 index’s -4.30% decline (SPY ETF).
For the year 2024, the portfolio returned +16.26% vs. +24.89% for the S&P 500 index (SPY ETF).
In 2023, the portfolio returned +12.17% vs. +26.28% for the S&P 500 index. The portfolio returned -4.7% in 2022 vs. the S&P 500 index’s -17.96%.
With little to no turnover and annual rebalance periodicity, ECAP seeks to minimize capital loss by holding shares of companies whose earnings streams exhibit a proven 20+ year track record of surviving recessionary periods with minimal impact on aggregate earnings growth relative to the overall S&P 500.
The ECAP and many other model portfolios are available as part of Zacks Advisor Tools, a cloud-based solution to access Zacks award-winning stock, mutual fund and ETF research. Click here to schedule a demo.
American Tower Corporation AMT, which is part of our Earnings Certain Dividend Portfolio (ECDP), has returned 3.9% over the past 12 weeks. Another ECDP stock, Hormel Foods Corporation HRL, has climbed 3.7% over the same time frame. Of course, the inclination of investors toward quality dividend stocks to secure an income stream amid heightened market volatility contributed to this performance.
Check American Tower's dividend history here>>>
Check Hormel Foods’ dividend history here>>>
With an extremely low beta and a history of minimum earnings variability over the last 20+ years, this 25-stock portfolio helps significantly mitigate risk.
The Zacks Earnings Certain Dividend Portfolio (ECDP) returned +5.74% in 2025 Q1 vs. the S&P 500 index’s -2.41% pullback and the Dividend Aristocrats ETF’s (NOBL) +3.11% return.
For the full-year 2024, the portfolio returned +6.95% vs. +24.89% for the S&P 500 index and +6.72% for NOBL.
The portfolio returned -0.9% in 2023 vs. +26.28% for the S&P 500 index and +8.11% for NOBL. The portfolio returned -2.3% in 2022 vs. -17.96% for the S&P 500 index and -8.34% for NOBL.
Click here to access this portfolio on Zacks Advisor Tools.
Westinghouse Air Brake Technologies Corporation WAB, from the Zacks Top 10 Stocks for 2025, has jumped 5.1% year to date against the S&P 500 Index’s 1.1% decrease.
The Top 10 portfolio returned -7.88% this year (through the end of April 2025) vs. -4.92% for the S&P 500 index and -2.88% for the equal-weight version of the index.
The Top 10 portfolio returned +62.98% in 2024, vs. +25.04% for the S&P 500 index and +13% for the equal-weight version of the index. The portfolio had returned +25.15% in 2023 vs. +26.28% for the S&P 500 index.
Since 2012, the Top 10 portfolio has produced a cumulative return of +1832.3% through the end of April 2025 vs. +434.2% for the S&P 500 index and +338.6% for the equal-weight version of the index. The portfolio has produced an average return of +24.3% in the period 2012 through April 30, 2025, vs. +11.6% for the S&P 500 index and +9.58% for the equal-weight version of the index.
Want the latest recommendations from Zacks Investment Research? Today, you can download 7 Best Stocks for the Next 30 Days. Click to get this free report
This article originally published on Zacks Investment Research (zacks.com).
| Jul-27 | |
| Jul-27 | |
| Jul-27 | |
| Jul-27 | |
| Jul-27 | |
| Jul-27 | |
| Jul-27 | |
| Jul-27 | |
| Jul-27 | |
| Jul-27 | |
| Jul-27 | |
| Jul-27 | |
| Jul-27 | |
| Jul-27 | |
| Jul-27 |
Join thousands of traders who make more informed decisions with our premium features. Real-time quotes, advanced visualizations, alerts, and much more.
Learn more about Finviz Elite